
- Avantis price today trades near $0.505, facing continued rejection at the descending trendline and sustained negative flows.
- Coinglass data shows $558K in net outflows, confirming persistent distribution and weak buyer conviction.
- Losing $0.47–$0.45 support could trigger a slide toward $0.40, while reclaiming $0.533 may signal the first bullish shift.
Avantis price today trades near $0.505, slipping after another rejection at the descending trendline that has capped every rally this month. The token continues to coil inside a narrowing structure, but flows remain negative and the EMA stack sits firmly above price. This keeps sellers in control as AVNT approaches a major demand zone.
Spot Outflows Show Persistent Distribution
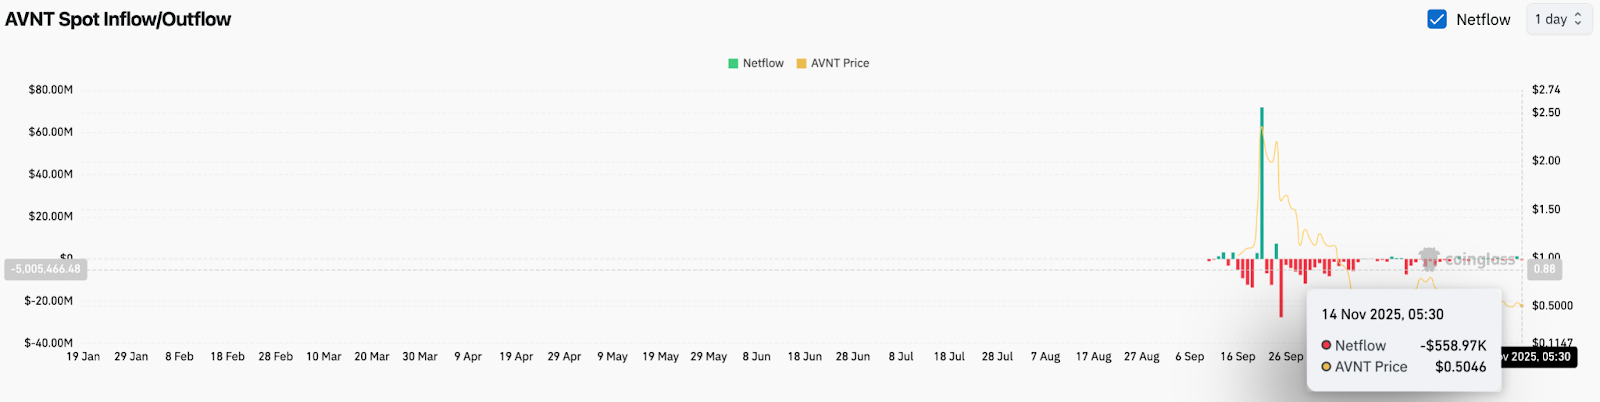
Coinglass data shows $558,000 in net outflows on November 14. The trend has been negative for weeks, with repeated red sessions reflecting distribution rather than accumulation. Liquidity continues to leave exchanges, confirming that participants are reducing exposure instead of positioning for upside.
The broader picture shows no signs of sustained inflows since late September. The long stretch of negative flow aligns with the persistent decline in price, reinforcing that the downtrend is supported by real selling pressure, not only technical weakness.
When outflows remain consistent at this scale, rallies tend to fade quickly. The latest spike above $0.60 was rejected within minutes, matching the flow data and showing that buyers lack conviction at higher levels.
Trendline Rejection Keeps Bears In Control
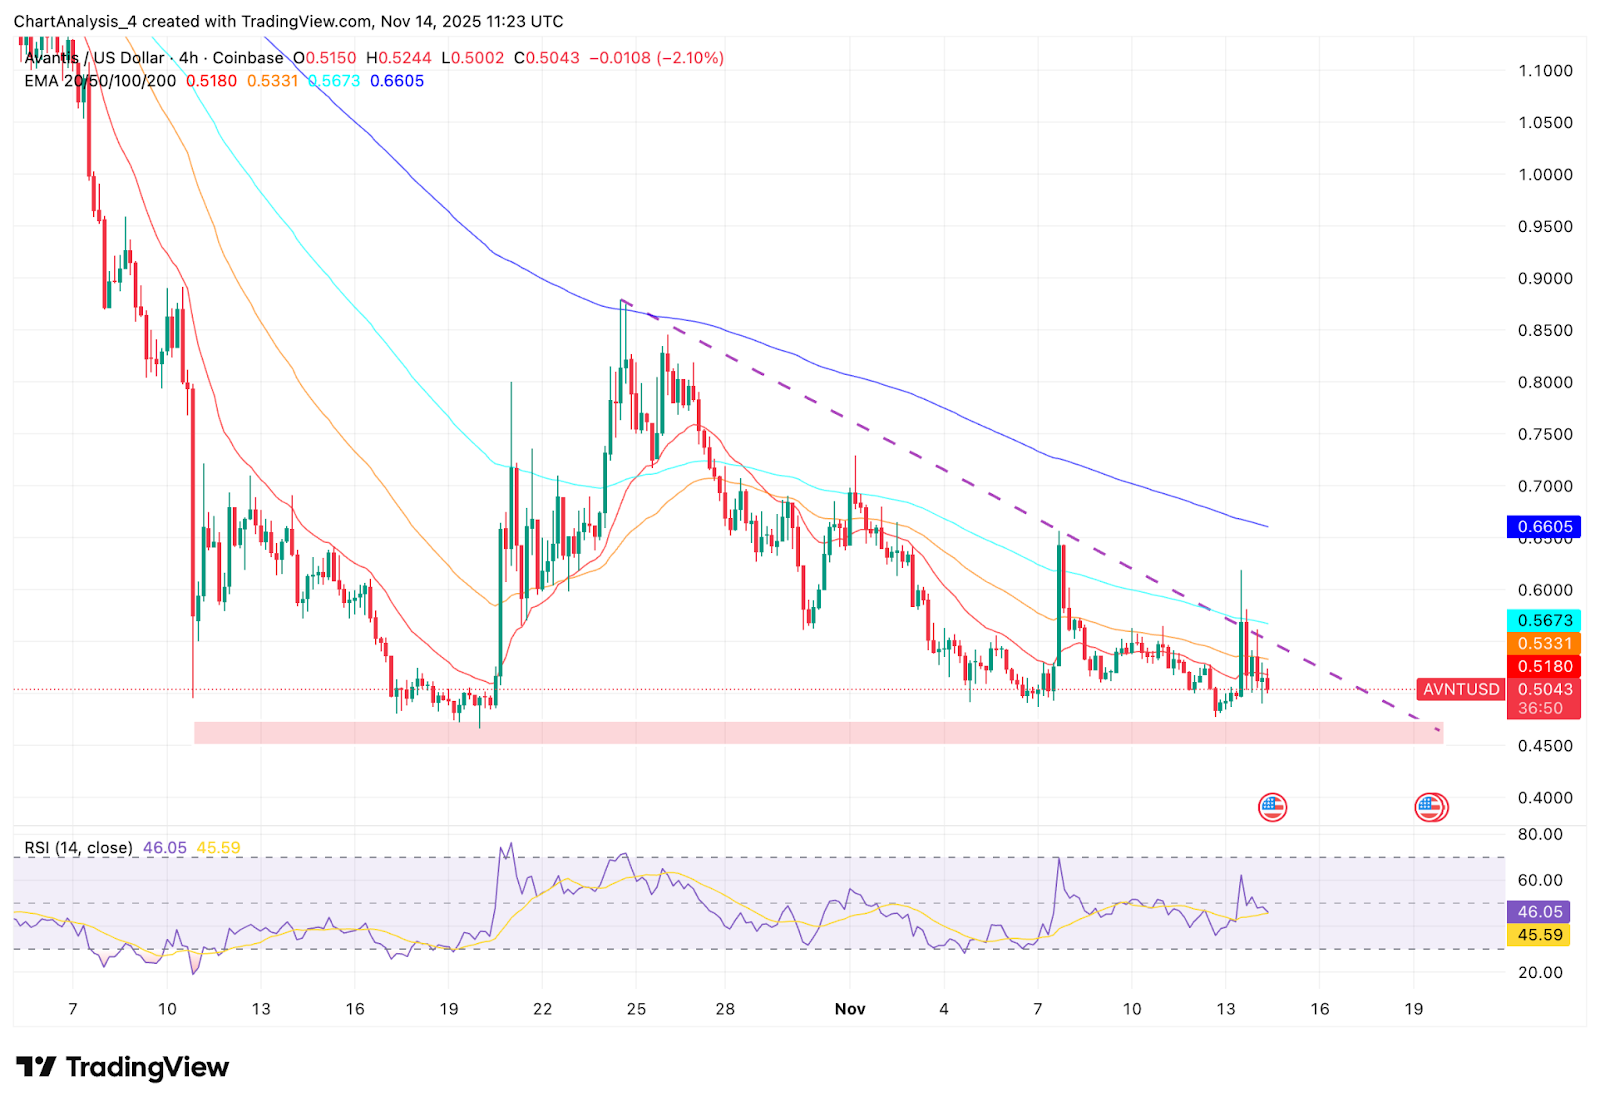
The 4 hour chart highlights a clean rejection from the descending trendline, which has acted as a guide for the entire November slide. Every attempt to rise above this line has failed, including the sharp wick toward $0.62 earlier this week.
AVNT now trades below all major EMAs:
- 20 EMA at $0.518
- 50 EMA at $0.533
- 100 EMA at $0.567
- 200 EMA at $0.660
This alignment forms a strong overhead ceiling. As long as price remains under the 20 and 50 EMAs, momentum stays bearish. Sellers have repeatedly used these moving averages to reenter the trend, pushing price back toward the lower support zone.
The key structure to watch is the demand region between $0.47 and $0.45, which has held since mid October. This is the final major shelf before a deeper breakdown. A failure here opens the path toward $0.40.
RSI near 46 shows neutral momentum, but the indicator has been capped under 55 since November 10, proving that AVNT has not been able to build sustained intraday strength.
Short Term Chart Shows Tight Compression
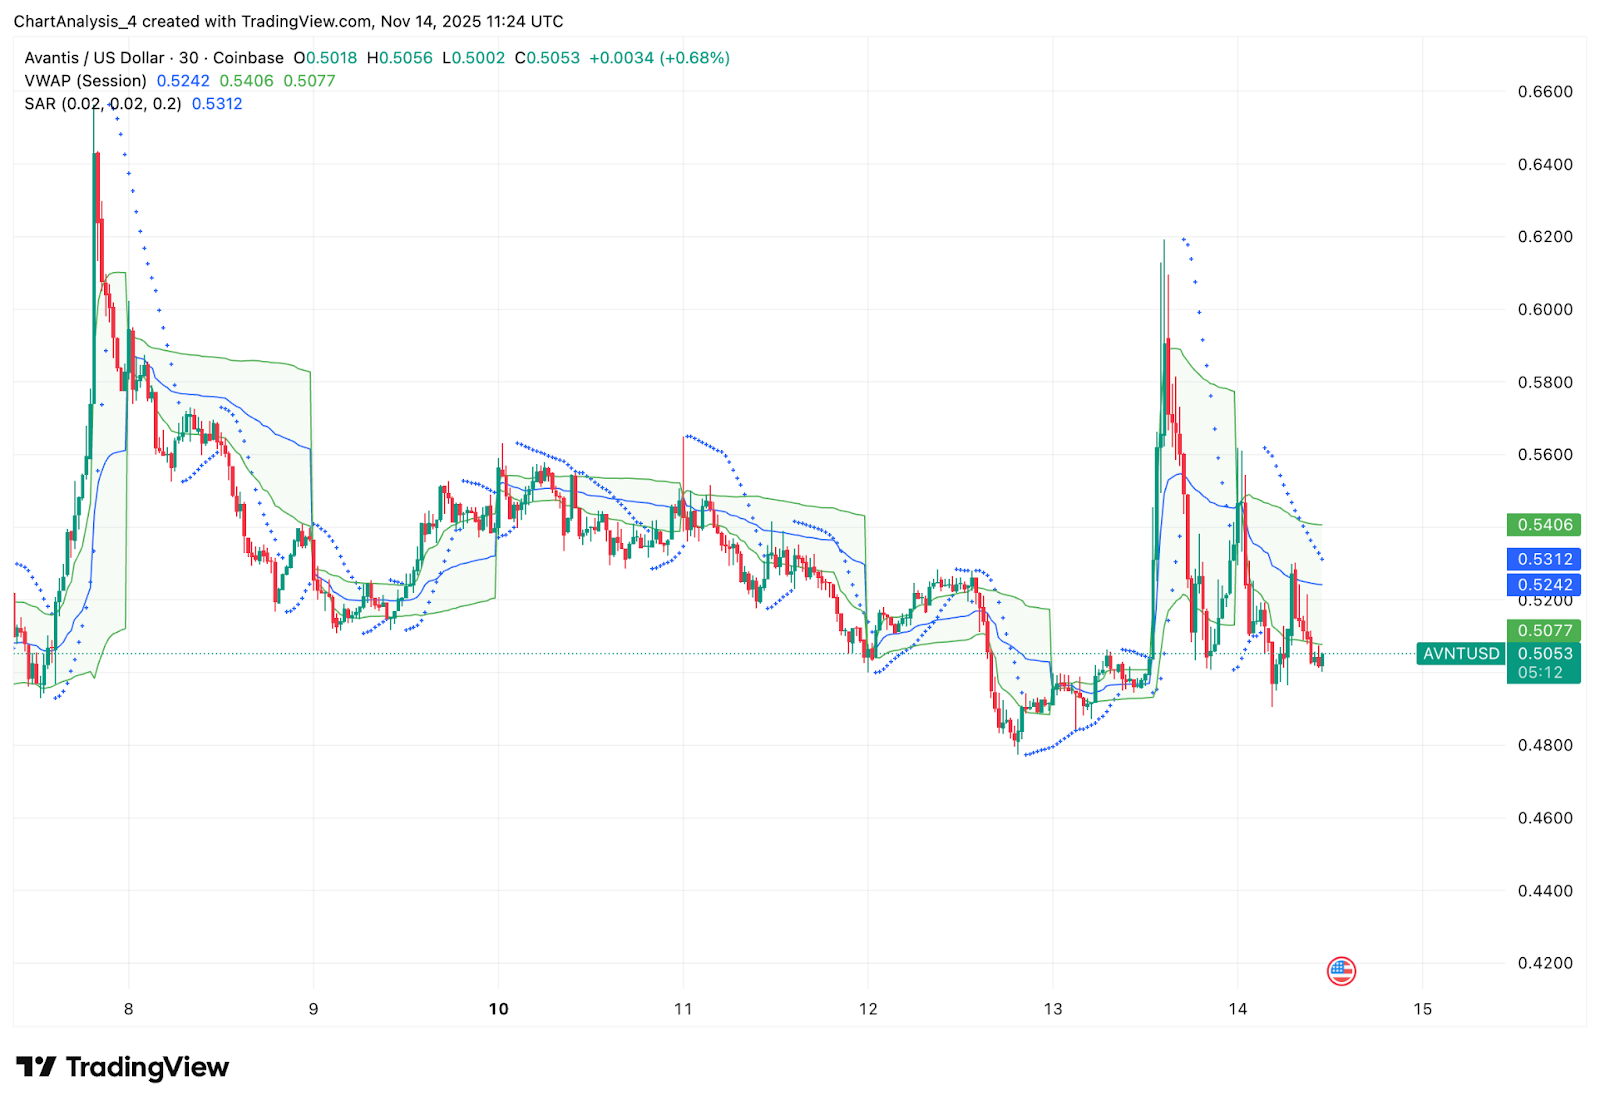
The 30 minute chart shows AVNT trading inside a tight compression range after yesterday’s volatility. Price is oscillating near the VWAP band around $0.507, but buyers have failed to reclaim the mid band near $0.524.
Parabolic SAR remains above price, signaling continued downside risk. Until the SAR flips, intraday traders will treat every bounce as corrective.
Outlook. Will Avantis Go Up?
Avantis remains under pressure as long as the descending trendline and EMA cluster cap upside attempts. The flow data confirms real distribution, and the technical picture shows no sign of a trend reversal yet.
- Bullish case: A breakout above $0.533 followed by a close above $0.567 would show that buyers can reclaim trend control. This would flip short term momentum and target $0.62 and potentially $0.70.
- Bearish case: A close below $0.47 would break the final support shelf and expose the path toward $0.42 and then $0.40. Continued negative flows strengthen this scenario.
Disclaimer: The information presented in this article is for informational and educational purposes only. The article does not constitute financial advice or advice of any kind. Coin Edition is not responsible for any losses incurred as a result of the utilization of content, products, or services mentioned. Readers are advised to exercise caution before taking any action related to the company.


