- Stellar (XLM) price finds stability after an initial drop, showing resilience.
- Increased market interest drives XLM’s market cap and trading volume up.
- Overbought conditions suggest a potential trend reversal for XLM/USD.
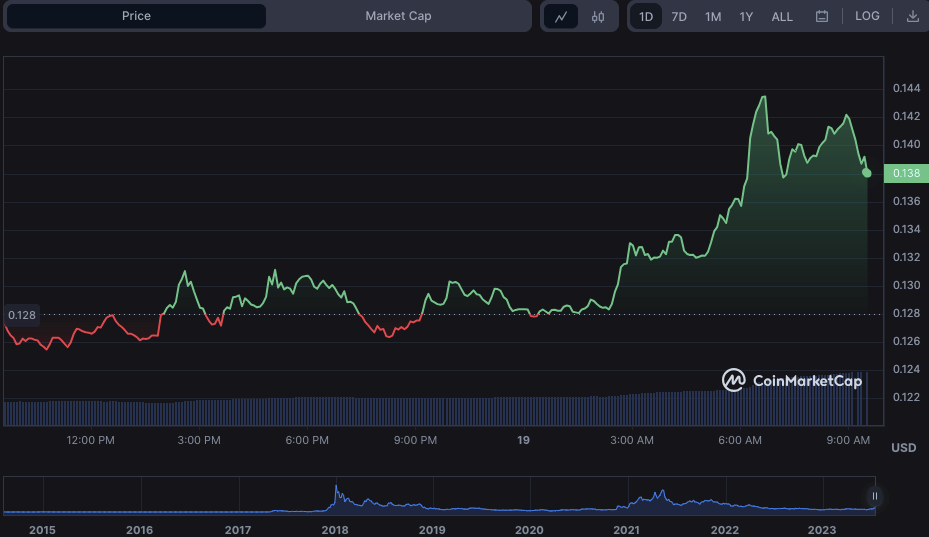
Despite a rocky start that saw the Stellar (XLM) price plummet, support at the intraday low of $0.1254 helped it stabilize. This level of support drew buyers who saw an opportunity to enter the market at a lower price.
As a result, the Stellar price began to recover and demonstrated resilience. The XLM price rose to a 24-hour high of $0.1435 before hitting resistance. At the time of publication, the bulls were still in control, resulting in an 8.99% increase to $0.1394.
If bullish momentum breaks through $0.1435, the Stellar price may continue to rise and test higher resistance levels. The next critical resistance level to watch is around $0.1500. If the bulls fail to break through this level, the Stellar price may consolidate or fall slightly as traders take profits.
During the bull run, XLM’s market capitalization and 24-hour trading volume increased by 8.91% and 122.67%, respectively, to $3,769,919,702 and $294,832,210. This increase reflects the market’s increased interest and demand for Stellar. It suggests that more investors are purchasing and trading XLM, which could contribute to its upward trend.

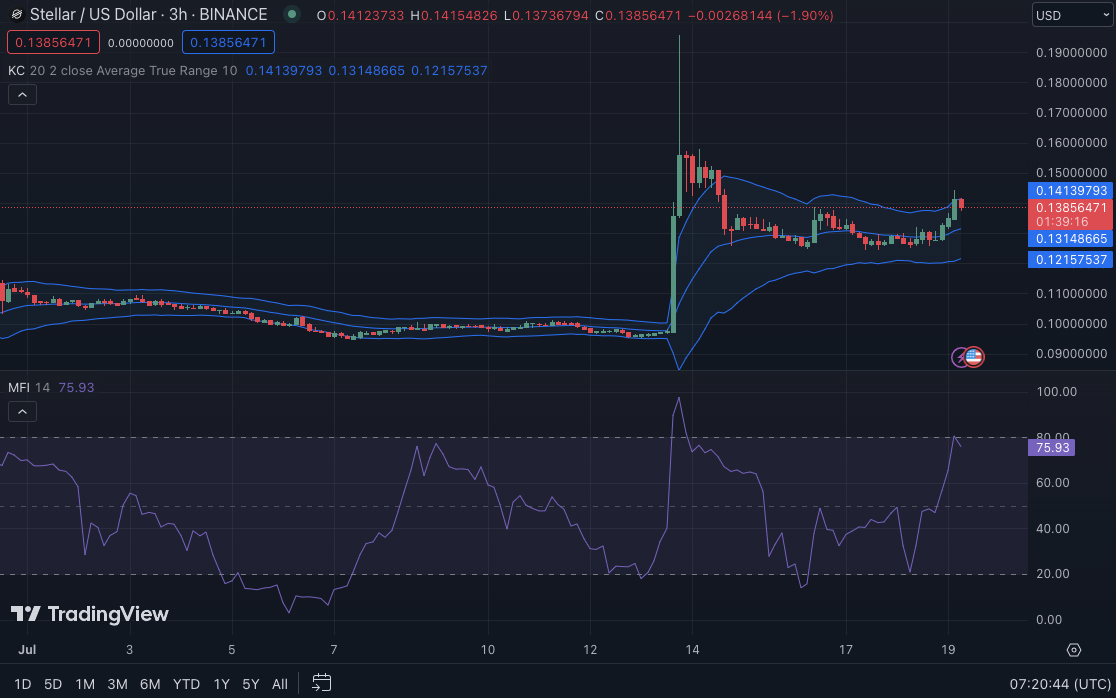
On the XLMUSD price chart, Keltner Channel bands are rising, with the upper, middle, and lower bands touching $0.14130898, $0.13482800, and $0.12148697, respectively. This movement indicates that volatility in the XLMUSD market has increased.
However, the price action has reached the upper band and is forming red candles, indicating that the market is potentially overbought. If the price action falls below the middle band, it may signal a change in momentum and a possible trend reversal.
The Money Flow Index rating of 76.10 and pointing south indicates that the bulls still control the market but that buying pressure may decrease. If the MFI continues to fall and drops below 50, it could mean a weakening bullish trend and a shift toward bearish sentiment.

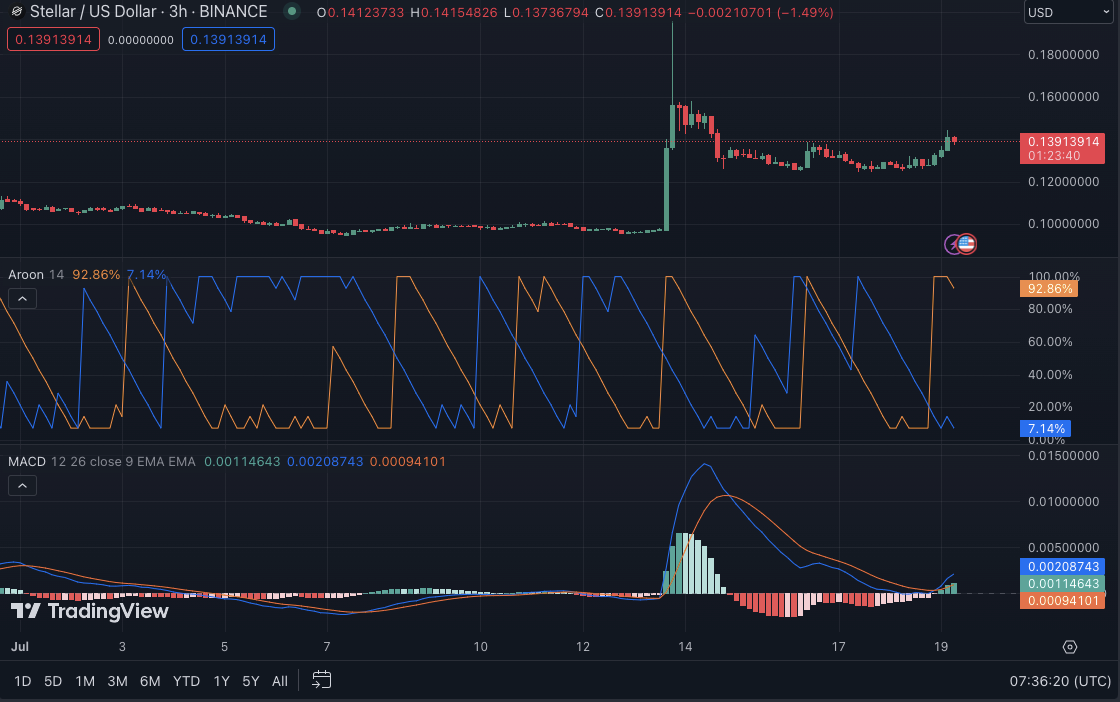
On the XLMUSD 3-hour, the Aroon up reads 92.86, while the Aroon down has a score of 7.14%, indicating a strong bullish sentiment in the market. However, if the Aroon down reading begins to rise and approaches the Aroon up reading, it could signal a shift in sentiment toward bearishness and a weakening of the bullish trend.
The MACD (blue) line is still moving above its signal line, with a reading of 0.00206550, indicating that bullish momentum is still present. The histogram also shows positive values, bolstering the bullish sentiment.
Traders should watch for any divergence or crossover between the MACD line and its signal line, as this could indicate a reversal in momentum and a shift toward bearishness.

In summary, Stellar (XLM) has shown resilience after a dip, with increasing market interest and demand. Bullish momentum continues, but caution is advised as overbought conditions and weakening buying pressure may signal a potential reversal soon.
Disclaimer: The views, opinions, and information shared in this price prediction are published in good faith. Readers must do their research and due diligence. Any action taken by the reader is strictly at their own risk. Coin Edition and its affiliates will not be liable for direct or indirect damage or loss.
Disclaimer: The information presented in this article is for informational and educational purposes only. The article does not constitute financial advice or advice of any kind. Coin Edition is not responsible for any losses incurred as a result of the utilization of content, products, or services mentioned. Readers are advised to exercise caution before taking any action related to the company.


