


- Bulls defy the bearish trend on the yearn.finance (YFI) market.
- Recent price analysis shows that YFI is in an obvious uptrend.
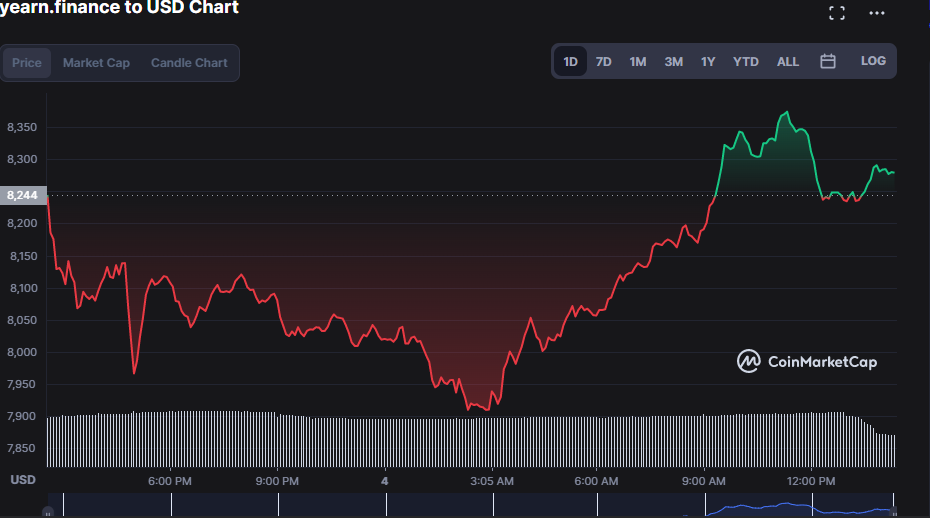
- YFI finds support at its intraday low of $7,907.28.
Yearn.finance price (YFI) has increased in the last few hours, according to the most recent price research on the daily price chart. As a result of favorable market dominance, the price of YFI has risen from its intra-day lows of $7,907.28 to its present high.
As of press time, yearn.finance (YFI) was trading at $8,221.18 after a 1.39% price surge.
A 0.22% increase in market capitalization to $299,854 may have contributed to the digital currency’s price growth, however, there is a 34.47% fall in 1-day trading volume to $40,238,402.
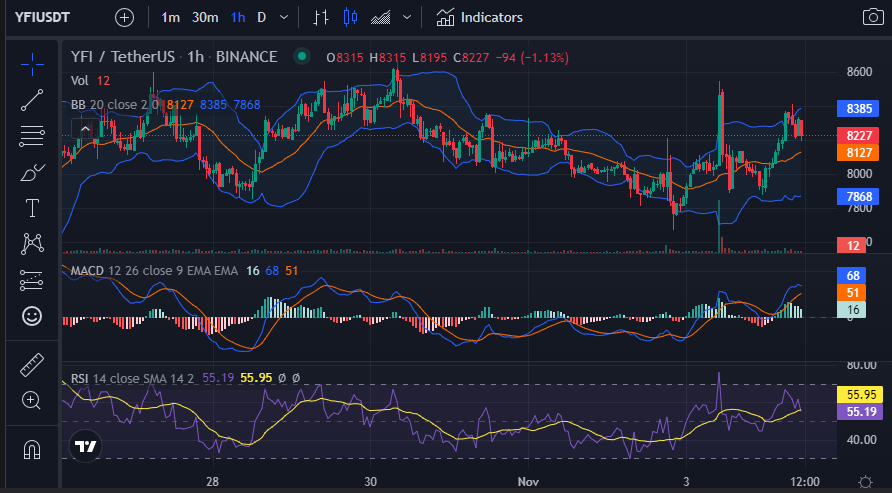
The Bollinger Bands are widening on the 1-hour price chart, indicating that the buying and selling pressures in the YFI market are increasing. The upper band reaches $8,384, while the bottom band reaches $7,869. The price movement toward the upper band rekindles the chance of a breakout.
The Moving Average Convergence Divergence (MACD) is rising and in the positive zone, with a score of 68. Furthermore, a crossing of the MACD blue line above the signal line signals bullish momentum. The present market trend is also supported by the bullish histogram movement.
The Relative Strength Index is 57.98, with a declining gradient that is approaching oversold territory. If the RSI score reverses its present advance toward the oversold zone, this price action indicates that the market’s favorable trend will continue.
The Stoch RSI has recently reached the overbought region, resulting in the YFI market’s recent short-term bearish trend. The bulls, on the other hand, defied this tendency, and bullish momentum returned. At the time of publication, the Stoch RSI was reading 60.78, which is neither overbought nor oversold.
With a score of 125, the Bear Bull Power (BBP), despite pointing south, suggests a bullish run because it has a rating over zero.
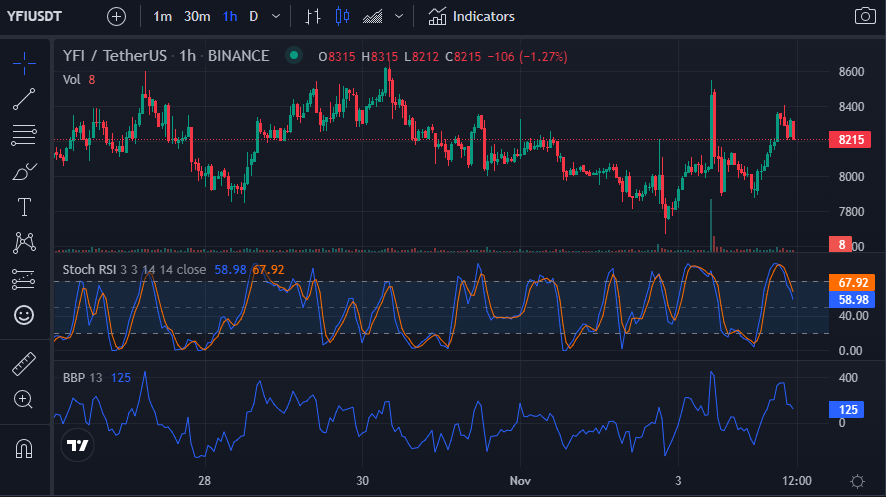
The bullish trend visible on the YFI market is expected to continue, with technical indications forecasting a continuation of the current trend.
Disclaimer: The views and opinions, as well as all the information shared in this price prediction, are published in good faith. Readers must do their research and due diligence. Any action taken by the reader is strictly at their own risk. Coin Edition and its affiliates will not be held liable for any direct or indirect damage or loss.
Disclaimer: The information presented in this article is for informational and educational purposes only. The article does not constitute financial advice or advice of any kind. Coin Edition is not responsible for any losses incurred as a result of the utilization of content, products, or services mentioned. Readers are advised to exercise caution before taking any action related to the company.


