- PEPE faces resistance at $0.00000134 amid bearish momentum, sinking the price to a 7-day low.
- The declining market cap and volume may hinder PEPE’s recovery.
- Oversold indicators hint at a potential price bounce for PEPE.
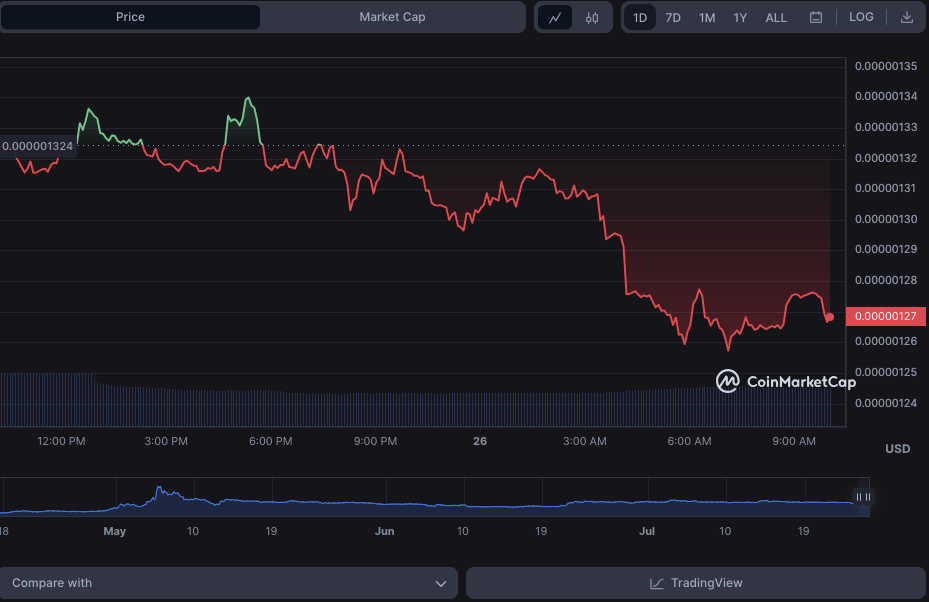
Attempts by Pepe (PEPE) market bulls to stage a recovery over the past day have met resistance at $0.00000134 as the underlying market continues to slide lower. As a result, selling pressure persisted in the PEPE market, pushing prices down to a 7-day low of $0.000001264 before finding support.
PEPE was priced at $0.000001269 at the time of publication, representing a 4.29% drop from its previous high. If bearish momentum breaks through the $0.000001264 support level, the next level to watch is $0.0000012, a 30-day low.
This movement would indicate a continuation of the downward trend in the PEPE market and could attract additional bearish activity. However, recovery is possible if buyers step in and push the price back toward $0.00000134, indicating a possible reversal of the current downward trend.
PEPE’s market capitalization and 24-hour trading volume fell by 4.20% and 28.53%, to $497,267,834 and $82,397,217, respectively. These market capitalization and trading volume decreases point to a possible lack of liquidity in the PEPE market and a loss of investor confidence. This decline may worsen the ongoing downtrend, making a rebound more unlikely.

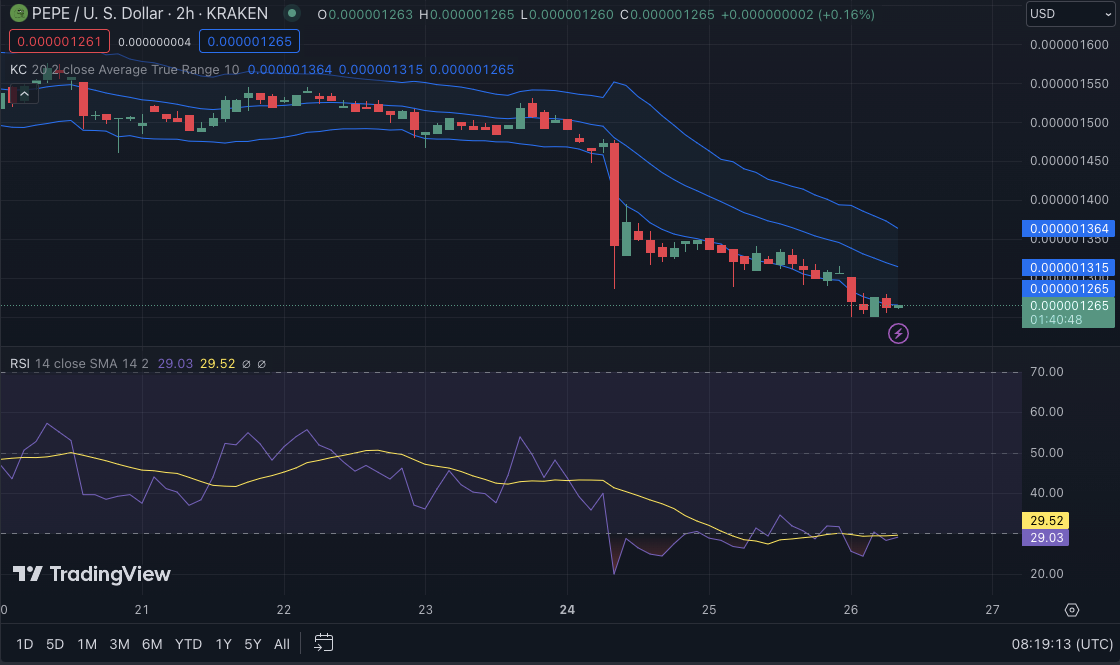
Keltner Channel bands are moving downwards on the PEPEUSD 2-hour price chart, with the upper, middle, and lower bands touching 0.000001364, 0.000001315, and 0.000001265. This move reflects the market’s increasing bearish pressure. As the price approaches the lower band of the Keltner Channel, traders may interpret this as a possible continuation of the downtrend.
However, green candlesticks below the lower band indicate that the market may be oversold. This movement could indicate that selling pressure has been exhausted, potentially leading to a short-term price bounce or reversal.
The Relative Strength Index rating of 29.03 increases the likelihood of an impending bounce or reversal. The RSI reading below 30 indicates that the market is oversold and due for an upward correction. This level may attract buyers who believe the market is undervalued, resulting in upward momentum.

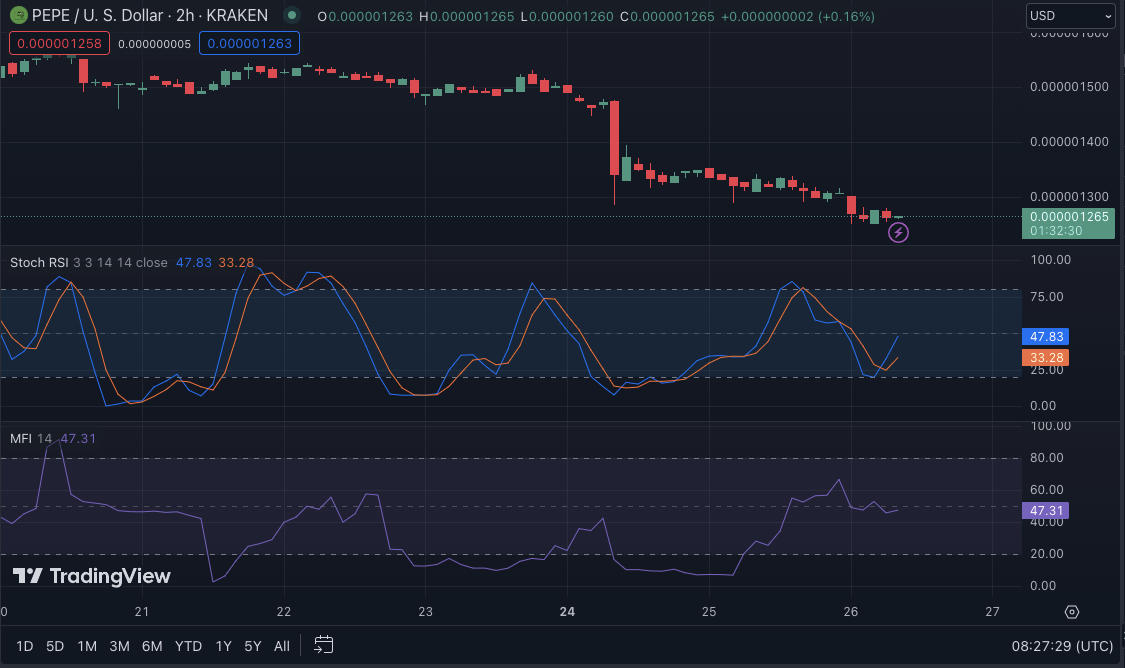
The stochastic RSI, trending north with a reading of 47.83, also supports the possibility of a price bounce or reversal. While not yet in overbought territory, the upward trend suggests that buying pressure is increasing, which could lead to a temporary price increase. Traders may interpret this as an invitation to enter the market and profit from the potential upward momentum.
With the Money Flow Index at 47.31, there is a balanced flow of money into and out of the market. This level indicates that there may be potential buying opportunities because investors are not selling off their positions in large numbers. If the Money Flow Index rises above 50, it could indicate increased buying pressure and potentially lead to further price increases.

To sum up, PEPE’s downward trend faces resistance at $0.00000134, but oversold conditions and bullish indicators hint at possible price recovery ahead.
Disclaimer: The views, opinions, and information shared in this price prediction are published in good faith. Readers must do their research and due diligence. Any action taken by the reader is strictly at their own risk. Coin Edition and its affiliates will not be liable for direct or indirect damage or loss.
Disclaimer: The information presented in this article is for informational and educational purposes only. The article does not constitute financial advice or advice of any kind. Coin Edition is not responsible for any losses incurred as a result of the utilization of content, products, or services mentioned. Readers are advised to exercise caution before taking any action related to the company.


