- Binance integration is forecasted to have a positive impact on BNB’s price.
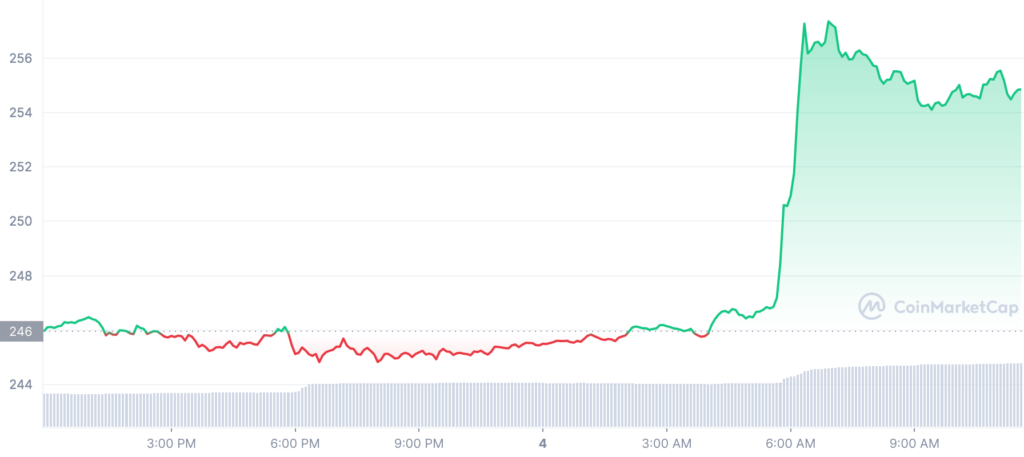
- BNB price has risen steadily in the past 24 hours hitting the $255 mark.
- Technical indicators show that BNB will continue rising in the short term.
A new integration with Google and Apple Pay that Binance recently announced will significantly enhance the user experience around the world. Users would be able to pay for items on Binance using Google and Apple Pay thanks to this new connectivity.
Following this disclosure, measures for Binance Coin [BNB] showed a favourable response, suggesting that investors should expect better times in the future. BNB is now trading at $255.33 and has a $40,842,936,642 market capitalization.

As the bulls continued to control the market, the price of BNB rose sharply throughout the day, rising 3.72% to $255.33, at the time of writing.
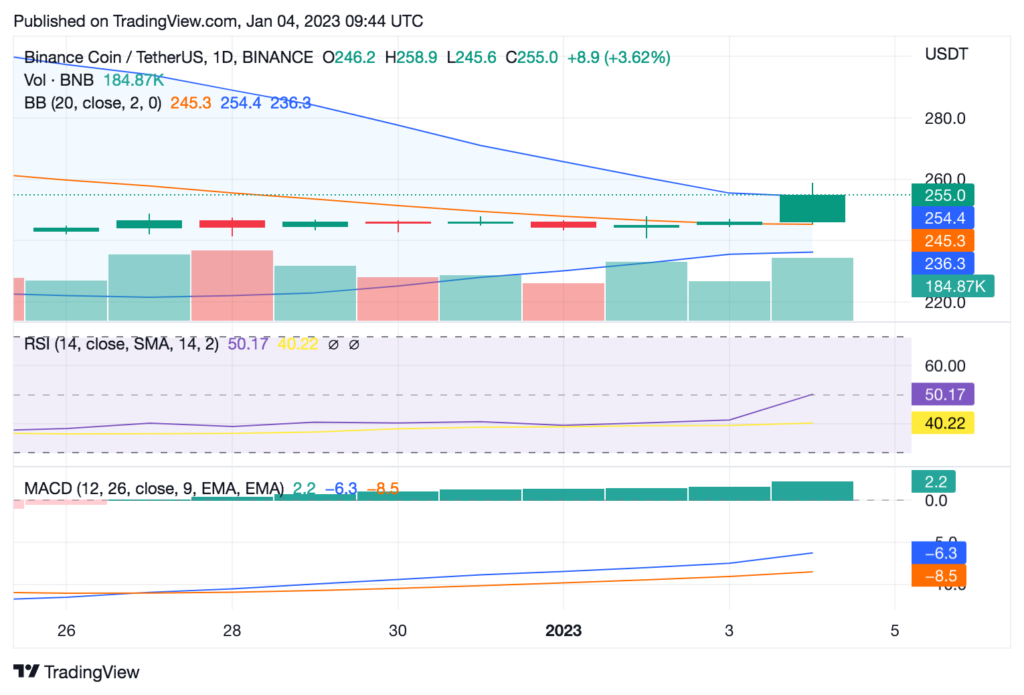
As the top band reaches $257.27 and the lower band approaches $244.82, the Bollinger Bands are enlarging, signalling increased market volatility.

Given that bulls have the advantage as indicated by the green engulfing candlestick and that growing volatility increases the likelihood of a breakout, a break over the resistance level is likely if bulls battle. Additionally, there is a higher chance that this bull run will continue given the price action’s march towards the upper band.
The market closed on a positive note yesterday, and it is starting today with strong bullish indications that build on yesterday’s surge over the level at $246, which was the greatest support for the BNB/USD currency pair. $259 represents a significant barrier level that the bulls’ rally today will encounter.
On the daily chart, the moving average convergence and divergence (MACD) indicator is still moving upward. The MACD line is rising over the signal line, indicating that the price of BNB/USD will increase steadily and strongly during the next few days.
The market is currently very close to the overbought region, according to the relative strength index (RSI) indicator, which is currently at 50.71. Additionally, the 200 SMA and 50 SMA are providing solid support and are likely to do so for the foreseeable future.

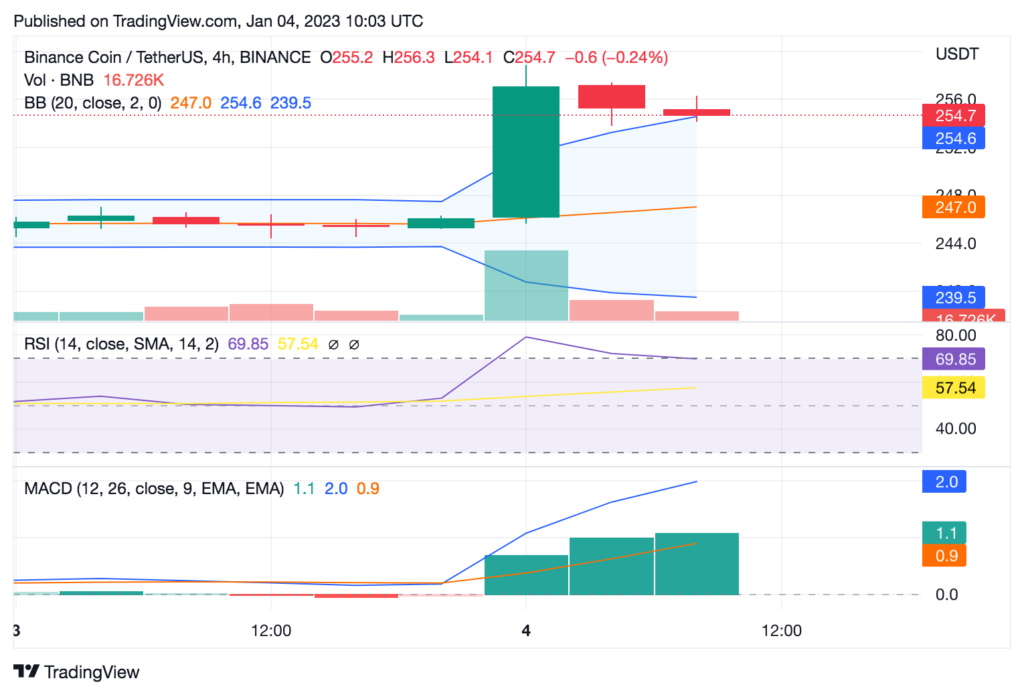
Widening Bollinger Bands on the 4-hour price chart show increased 24-hour trading activity, with the upper band approaching $254.7 and the lower band reaching $239.2. This change supports bullish predictions amid increased market volatility. The bullish run is anticipated to continue as long as the price is above the top of the range and bullish strength is increasing.
Disclaimer: The views and opinions, as well as all the information shared in this price analysis, are published in good faith. Readers must do their own research and due diligence. Any action taken by the reader is strictly at their own risk, Coin Edition and its affiliates will not be held liable for any direct or indirect damage or loss
Disclaimer: The information presented in this article is for informational and educational purposes only. The article does not constitute financial advice or advice of any kind. Coin Edition is not responsible for any losses incurred as a result of the utilization of content, products, or services mentioned. Readers are advised to exercise caution before taking any action related to the company.


