
- The 8-year trendline has marked every major Bitcoin peak and correction since 2017.
- Past failures at this line led to steep pullbacks, while breakouts triggered record highs.
- The current test sits at $117,250, a level Soloway calls critical for confirming a breakout.
Chief Market Strategist Gareth Soloway flagged an 8-year trendline that has tracked every major Bitcoin top and correction since 2017. The same line capped the 2017 peak, both 2021 highs, and late 2024 into early 2025 rallies; each rejection bringing 30%+ drawdowns.
Whenever Bitcoin broke and held above the line, it later printed new all-time highs. That line now sits near $117,250.
Why $117,250 Matters
According to Soloway, Bitcoin must break above $117,250 and hold for at least a couple of daily closes to confirm a breakout. If it does, he believes history suggests another record high is likely.
But if Bitcoin fails at this level, the downside risk grows. Soloway warned that a rejection could push the price first under $100,000, and possibly down to $89,000–$90,000 based on long-term support lines.
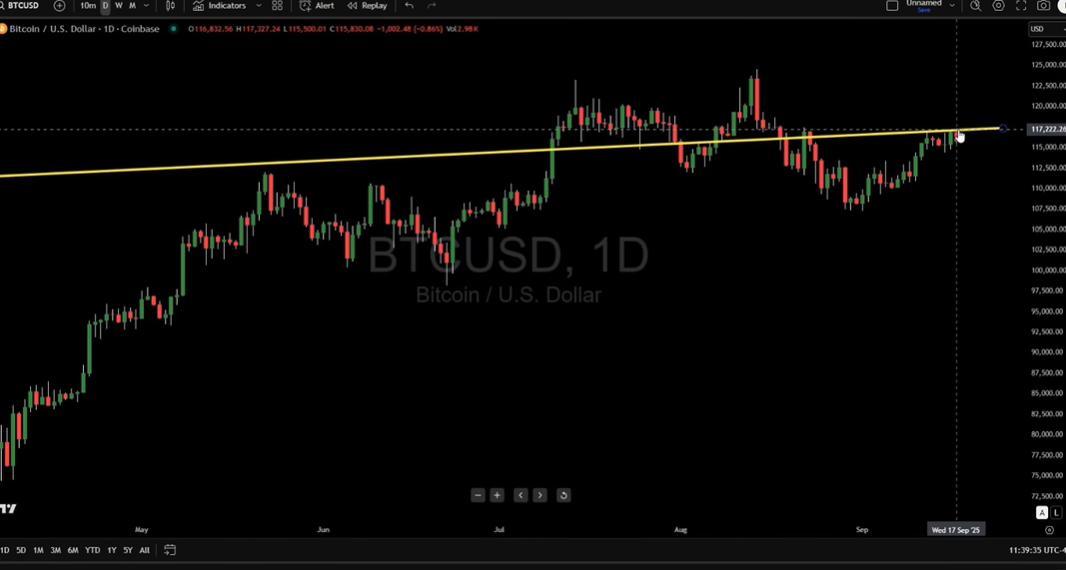
He stressed that while today’s market has more institutional involvement than in 2017 or 2021, making extreme drops less likely, significant corrections remain possible if Bitcoin cannot reclaim this critical level.
An 8-year line that has guided every BTC cycle
The same line has played a role in:
- The 2017 top and the bear market that followed.
- Both 2021 highs, which led into another correction.
- The late 2024 and early 2025 rallies, when Bitcoin pulled back more than 30% after hitting resistance.
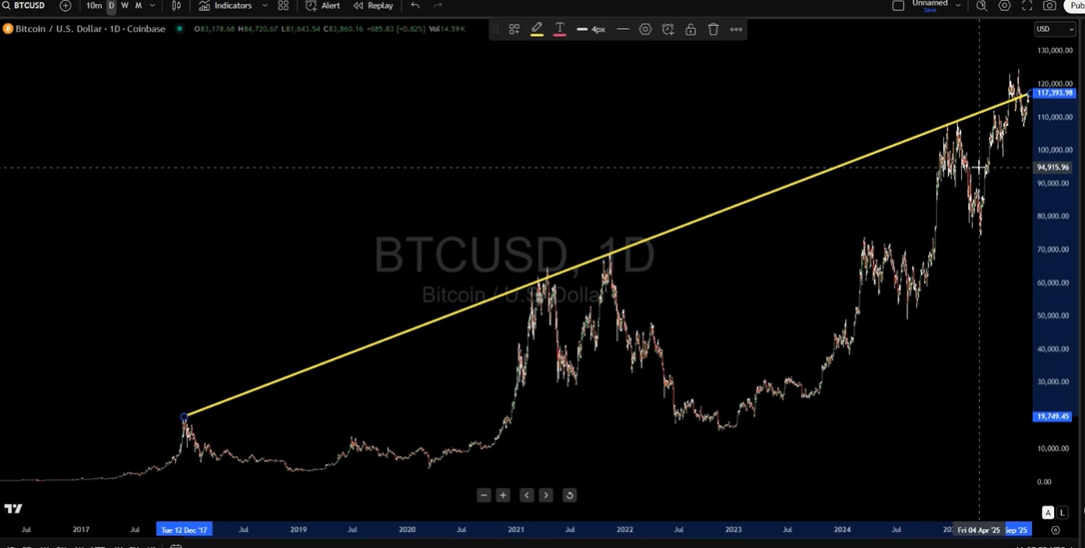
When Bitcoin broke above and held the line, it went on to set new records. When it failed, larger corrections followed.
Understanding What’s Next for BTC
CoinEdition reviewed three major BTC forecasts, all converging on a similar pivot zone.
Gareth Soloway observed an 8-year trendline near $117,250. But Bitcoin is also in the “banana zone” of its cycle, where prices tend to rise steadily and pullbacks are smaller. Support around $113,500–$114,900 shows the bullish trend is still holding.
Related: Bitcoin ‘Banana Zone’ Points to Early Oct–Nov 2025 ATH
Fibonacci targets observe that Bitcoin could reach around $155,600 if it clears $117,250. Strong accumulation and low selling pressure add to the positive outlook.
But if Bitcoin fails to hold this level, it could drop toward $90,000, showing that corrections are still possible even in this cycle.
At the time of writing, Bitcoin is trading around $116,915 and is down by more than 1% in the last 14 hours.
Why this trendline matters now
Soloway admitted that he had dismissed the line a few months ago when Bitcoin briefly pushed above it. But after the latest price action, he believes it has once again proven its relevance.
Whenever Bitcoin stayed above this line, it went on to reach new all-time highs, while falling below it often led to sharp pullbacks. This test, he added, could decide whether the market enters another major rally or faces a steep correction.“That’s why this test could be the pivot point between another historic rally or a major correction,” he said.
Related: Bitcoin Cash (BCH) Peaks to 17-Month High as BTC Battles Major Resistance Near $118K
Disclaimer: The information presented in this article is for informational and educational purposes only. The article does not constitute financial advice or advice of any kind. Coin Edition is not responsible for any losses incurred as a result of the utilization of content, products, or services mentioned. Readers are advised to exercise caution before taking any action related to the company.


