
- Bitcoin’s price drop led to resistance at break-even levels for short-term holders.
- Surge in Open Interest and spot inflows added strain, causing high liquidations.
- Both BTC and ETH show potential for a bullish reversal despite recent declines.
Bitcoin and Ethereum saw significant price drops over the past two days. Bitcoin fell 10.8% from $65,062 to $58,053, while Ethereum experienced a steeper 14.5% decline, moving from $2,792 to $2,384, according to CryptoQuant data. These movements highlight the volatile nature of the cryptocurrency market and shed light on key factors behind the recent downturn.
Short-term holders played a role in creating a resistance level at their break-even price. As Bitcoin’s price dropped earlier this month, these investors faced an average 17% loss. When the price returned to their average cost basis, many sold at break-even, forming a resistance level. This selling pressure, combined with hopes for higher prices, created a fragile market environment.
Adding to this, open interest in the market jumped from $13.5 billion to $17.9 billion, a 31% increase since August 5th. Funding rates stayed positive, meaning traders were paying a premium on perpetual contracts. This often leads to instability, as traders’ positions become more vulnerable to market swings. The increase in spot inflows during the price decline put even more strain on an already fragile market.
A surge in Bitcoin inflows to spot exchanges during the price drop signaled increased selling pressure. These inflows primarily came from large holders, further destabilizing futures positions.
Cryptoquant’s analysis shows that both Bitcoin and Ethereum saw significant long liquidations. Ethereum liquidations surged to $55 million, and Bitcoin liquidations reached $90 million. These were the highest levels since August 5th and led to a $2.2 billion drop in open interest as many traders were forced out of their positions.
The market remains in a state of flux, requiring time to stabilize. Monitoring on-chain data in the coming days will be crucial in understanding the market’s direction. Despite the recent downturn, the live Bitcoin price stands at $59,931.44, down 3.92% in the last 24 hours, with a trading volume of $44.5 billion. Ethereum’s live price is $2,521.31, down 4.48%, with a trading volume of $22.1 billion.
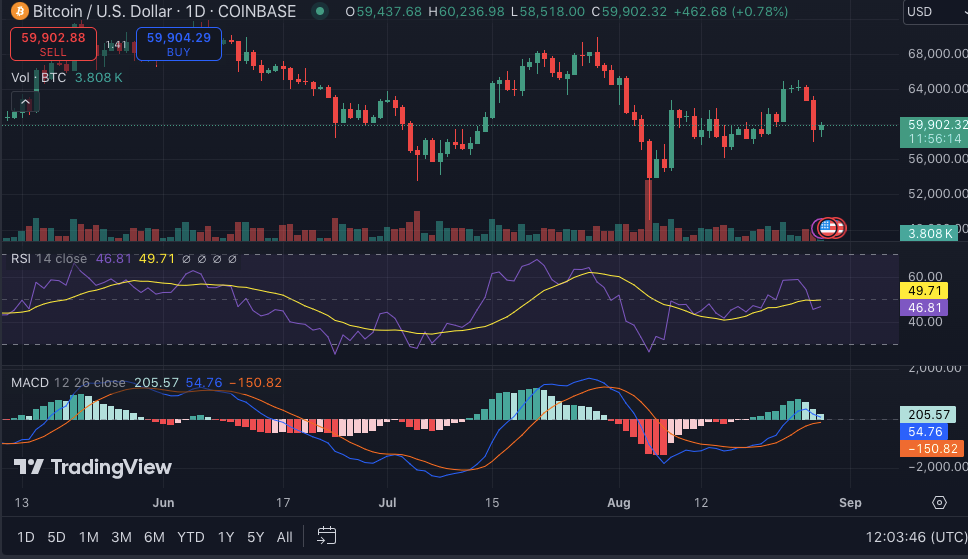
BTC/USD 1-day price chart, Source: Trading view
The 1-day RSI for Bitcoin is at 46.44, suggesting that the cryptocurrency is neither overbought nor oversold. Additionally, the 1-day MACD trading above the signal line indicates potential bullish momentum.
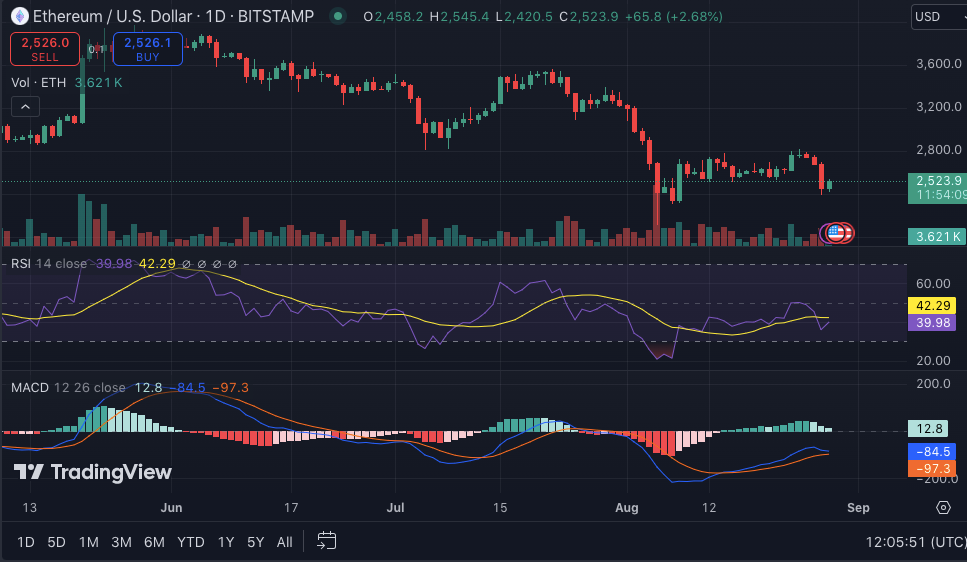
ETH/USD 1-day price chart, Source: Trading view
Similarly, Ethereum’s 1-day RSI at 39.84 suggests that the market may be approaching oversold conditions. With the 1-day MACD also trading above the signal line, there is potential for a bullish reversal in the near future.
Disclaimer: The information presented in this article is for informational and educational purposes only. The article does not constitute financial advice or advice of any kind. Coin Edition is not responsible for any losses incurred as a result of the utilization of content, products, or services mentioned. Readers are advised to exercise caution before taking any action related to the company.


