
- Bitcoin rebounds 5% as the Greed and Fear Index hits historical low, signaling potential bottom.
- Recent bounce off lower downtrend channel boundary suggests key technical support.
- BTC’s 1-day RSI at 47.62 and 1-week MACD show technical stability and short-term gains.
Bitcoin has shown resilience, bouncing back 5% in the past 24 hours according to Matrixport data. This recovery follows a dip in the Greed and Fear Index to a historically low level.
Such levels have often marked tactical bottoms in the market, suggesting that the cryptocurrency might be finding a temporary floor. This recovery aligns with technical expectations, particularly as Bitcoin has bounced off the lower boundary of its downtrend channel.
The latest chart report from Matrixport highlights several critical points. Bitcoin’s recent uptick underscores the effectiveness of the Greed and Fear Index as an indicator. This index, which reflects market sentiment, had reached a low that historically precedes price recoveries. As such, it has served as a useful gauge for anticipating potential market reversals.
Read also: Bitcoin Bounces Back 5%, Signaling Potential Market Reversal
Additionally, Bitcoin’s has been confined within a downward channel, and its recent rebound from the lower boundary suggests traders are keenly observing these technical levels. The lower boundary, in particular, has served as a crucial support level.
Market Driven by Technical Factors
The current market movement appears to be primarily driven by technical factors. With both the Greed and Fear Index and the downtrend channel providing strong signals, traders are reacting to these indicators while awaiting further fundamental developments.
Bitcoin’s Recent Price Action
The Bitcoin chart for the past months depicts the price trend from February to September, with the cryptocurrency’s value fluctuating between $45,000 and $75,000. Presently, Bitcoin is trading at $57,198.53, marking a 4.04% increase in the last 24 hours.
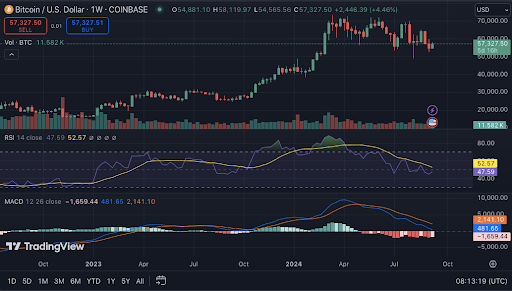
The 1-day Relative Strength Index (RSI) stands at 47.62, indicating that Bitcoin is neither overbought nor oversold. Additionally, the 1-week Moving Average Convergence Divergence (MACD) shows slight bullish momentum, suggesting potential short-term gains.
Disclaimer: The information presented in this article is for informational and educational purposes only. The article does not constitute financial advice or advice of any kind. Coin Edition is not responsible for any losses incurred as a result of the utilization of content, products, or services mentioned. Readers are advised to exercise caution before taking any action related to the company.

 Price Prediction: Can Bulls Break the $329 Barrier?")


