 Price Prediction: Breakout or Breakdown Next?")
Bitcoin price today is trading around $107,800, holding just above its short-term support after a volatile weekend. The token’s correction from its August highs near $118,000 has lasted longer, with sellers keeping the pressure on as whales move their holdings and spot outflows speed up.
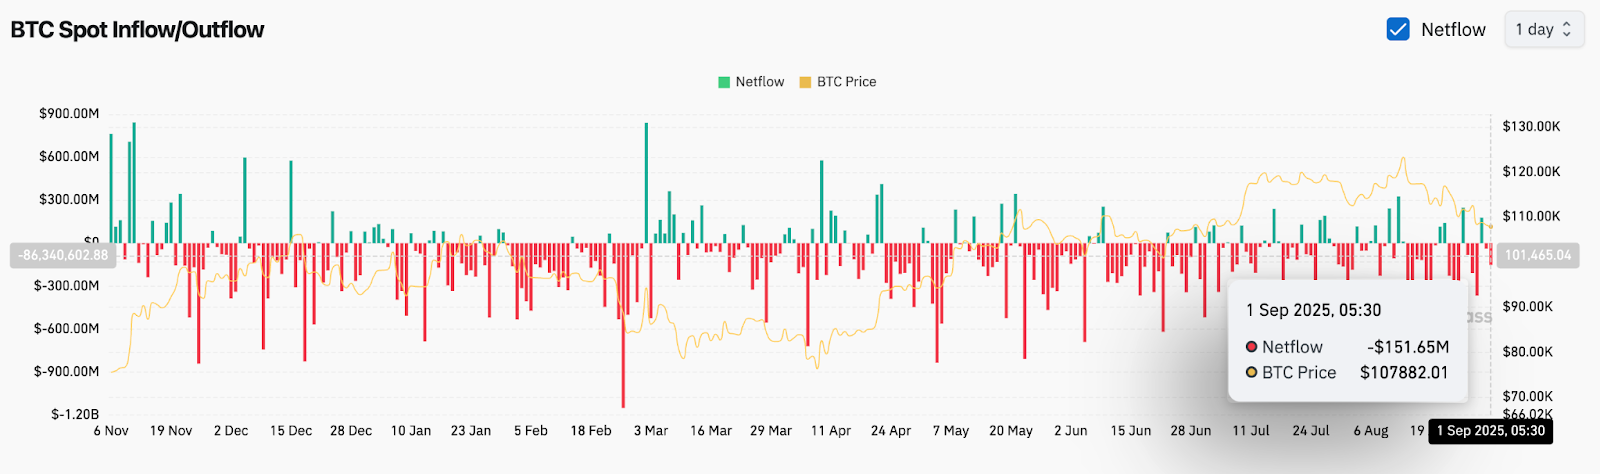
The decline comes amid a $215 million Bitcoin selloff linked to a major holder who shifted into Ethereum, a move that sparked debate about institutional positioning. At the same time, Coinglass data shows BTC exchange netflows turning negative by $151 million on September 1, underlining persistent selling.
With technicals pressing into key support at $107,000 and macro chatter about an extended bull run later this year, Bitcoin sits at a pivotal inflection point.
Bitcoin Price Holds Firm at Descending Resistance
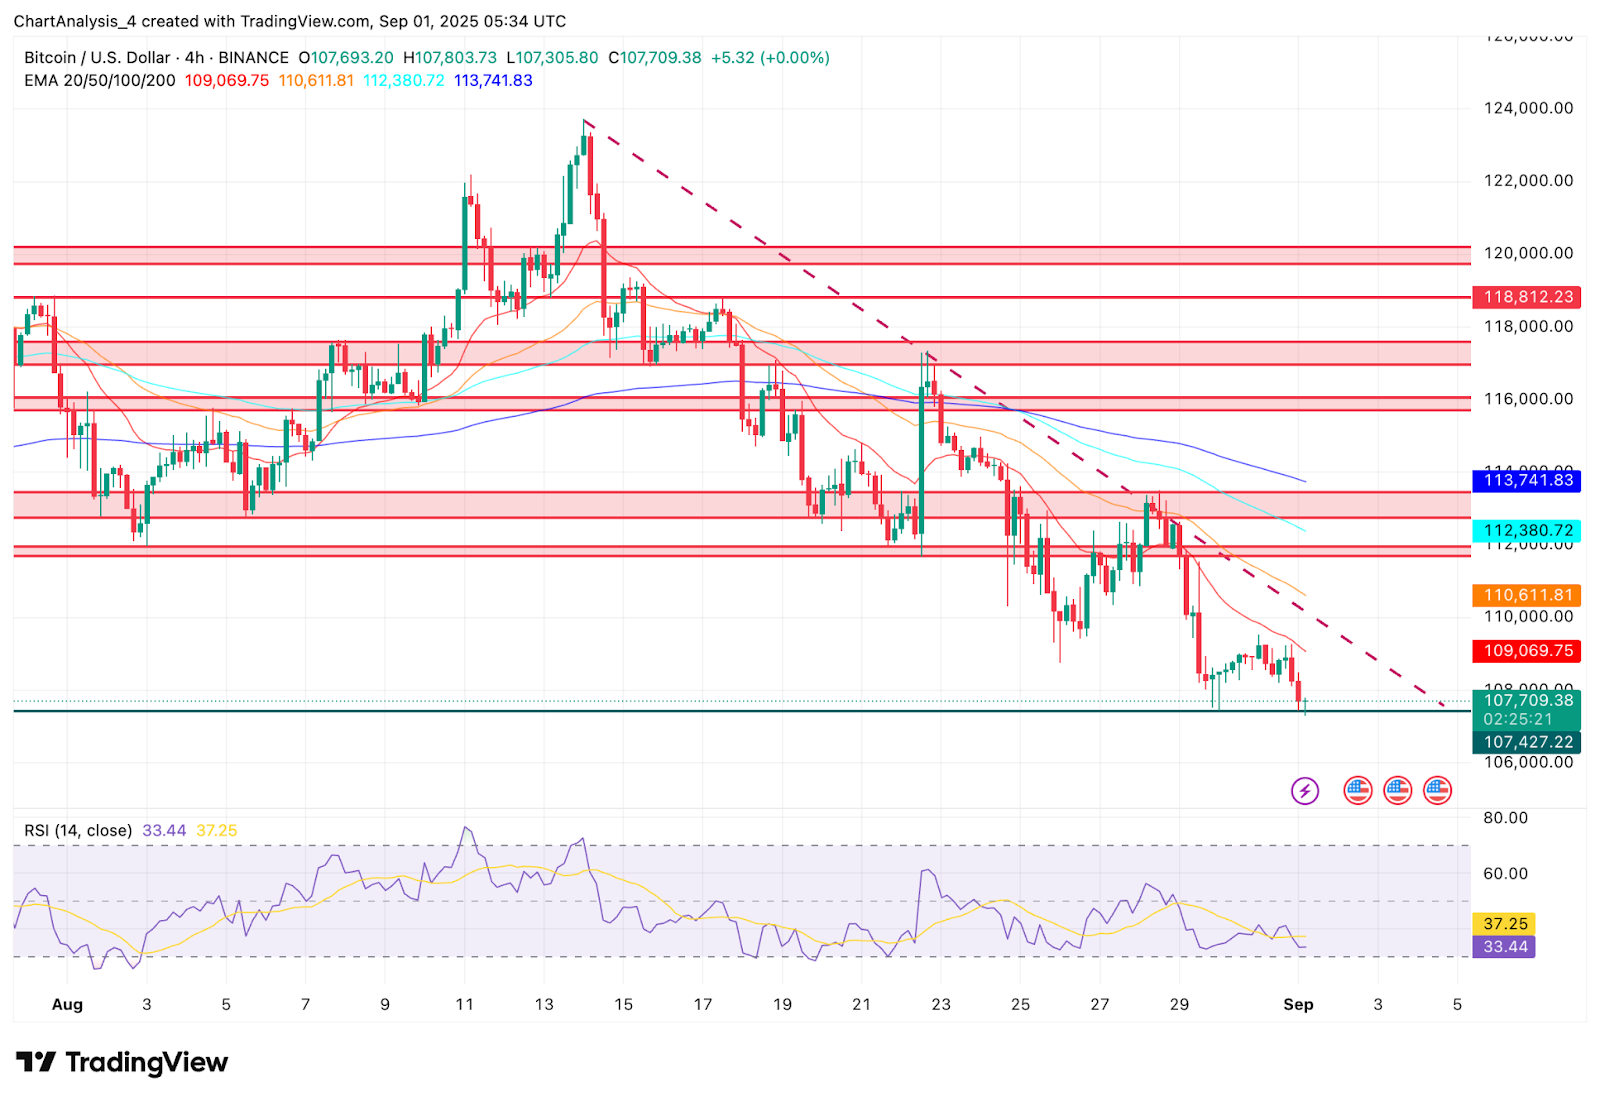
A descending trendline from mid-August continues to constrain Bitcoin price action on the 4-hour chart, with multiple rejections reinforcing $109,000–$110,000 as significant resistance. Immediate support lies at $107,000, with a breakdown exposing deeper bids toward $105,000.
Exponential moving averages cluster tightly overhead. The 20-EMA and 50-EMA limit the price to around $109,000, whereas the 100-EMA and 200-EMA are positioned higher at $112,000 and $113,700, respectively. The setup emphasizes how bulls must clear multiple layers before regaining momentum. RSI has slipped to 33 on the 4-hour chart, suggesting oversold conditions but not yet signaling a confirmed reversal.
The supertrend indicator has flipped bearish below $116,400, underlining the importance of reclaiming higher resistance before buyers can reassert control. Meanwhile, the Parabolic SAR plots above price at $111,600, reinforcing short-term pressure against upside moves.
Despite near-term weakness, holding the $107,500 trendline keeps the broader bullish structure intact. A decisive break beneath this zone would shift focus toward $105,000 and potentially $101,000. Conversely, a rebound here could reestablish momentum toward $112,000 and $116,000, where multiple technical barriers align.
Whale Rotation and Exchange Outflows Add Pressure
On-chain data reveals significant shifts in positioning. A major Bitcoin wallet offloaded $215 million worth of BTC before accumulating $4 billion in Ethereum, according to data shared by on-chain trackers.
The rotation highlights diverging conviction among large holders, raising questions about short-term Bitcoin dominance.
Spot exchange flows add weight to the bearish tilt. Coinglass reports a $151 million net outflow on September 1, extending a pattern of sustained withdrawals since mid-August. Historically, large negative flows suggest coins moving into custody, but in this case, pressure has coincided with failed resistance retests.
Sentiment remains divided. Some analysts on X highlight historical cycles, comparing today’s structure with the 2020–2021 pre-bull phase. One projection suggests Bitcoin could rally toward $265,000 if the cyclical pattern repeats. Still, short-term flows show sellers firmly in control.
Contrasting Views: Bulls Eye Trendline, Bears Target Breakdown
Bulls argue that Bitcoin is still defending its broader daily trendline from March, which sits near $107,500. Holding this zone could stabilize price and set the stage for a rebound toward $112,000 and $116,000. A breakout above the supertrend resistance near $116,400 would flip bias decisively higher.
Bears, however, remain unconvinced. They point to repeated failures at descending resistance and heavy liquidations that have capped rallies since mid-August. If $107,000 fails, Bitcoin risks sliding toward $105,000 and even $101,000, where long-term support aligns with prior accumulation zones.
This divergence underscores the near-term tension: while the long-term cycle narrative remains bullish, near-term momentum and flows lean cautious.
Bitcoin Short-Term Outlook: Breakout or Breakdown Next?
Heading into September 2, traders are watching whether Bitcoin can defend $107,000 and reclaim $109,000. A push above this level would ease immediate downside pressure and target $112,000–$113,000, while a confirmed daily close below $107,000 would open a path to $105,000 and potentially $101,000.
With RSI showing oversold conditions and sentiment split between accumulation narratives and whale rotation fears, volatility is expected to stay elevated. The short-term Bitcoin price prediction favors consolidation with downside risk unless bulls step in with volume above $110,000.
Bitcoin Price Forecast Table
| Indicator | Signal | Levels/Notes |
| Price Today | $107,800 | Hovering near $107K support |
| Support | $107,000 / $105,000 / $101,000 | Key downside zones |
| Resistance | $109,000 / $112,000 / $116,400 | EMA cluster and supertrend |
| RSI | 33 (4H) | Oversold but not reversed |
| MACD | Bearish tilt | Momentum still negative |
| Pattern | Descending trendline | Caps rallies since mid-August |
| Flows | –$151M outflow | Selling pressure intensifies |
| Supertrend | Bearish below $116,400 | Trend bias remains under pressure |
Disclaimer: The information presented in this article is for informational and educational purposes only. The article does not constitute financial advice or advice of any kind. Coin Edition is not responsible for any losses incurred as a result of the utilization of content, products, or services mentioned. Readers are advised to exercise caution before taking any action related to the company.
 Price Prediction for April 2026: Will Chainlink Move Higher?")
 Price Prediction: Can Bulls Sustain the $0.045 Push?")


