 Price Prediction: BTC Slips Below Key Levels as Derivatives Cool and Bhutan Sells")
- Bitcoin remains under pressure, trading below Ichimoku cloud with weak recovery attempts.
- Spot outflows and derivatives contractions highlight ongoing selling and cautious sentiment.
- Bhutan’s $50M BTC sales add macro pressure despite profitable mining operations since 2019.
Bitcoin continues to face firm downside pressure on the four-hour chart, with sellers maintaining control below several critical technical thresholds. Price action remains well beneath the Ichimoku cloud, confirming a sustained bearish structure.
Lower highs and lower lows dominate the chart, while repeated failures near short-term averages reinforce fading bullish attempts. Consequently, traders remain cautious as Bitcoin trades near the $71,700 area, searching for short-term stability.
Bearish Structure Dominates the 4H Chart
Technical indicators continue to align with the broader downtrend. Bitcoin failed to reclaim both the Tenkan-sen and Kijun-sen, signaling weak recovery momentum.
Moreover, the forward Ichimoku cloud slopes downward and remains thick, acting as firm resistance. A breakdown below the 0.236 Fibonacci level further highlights limited dip-buying interest.
Directional Movement Index data supports this view. The negative directional index remains dominant, while the positive index stays deeply suppressed. Hence, selling pressure appears structural rather than temporary.
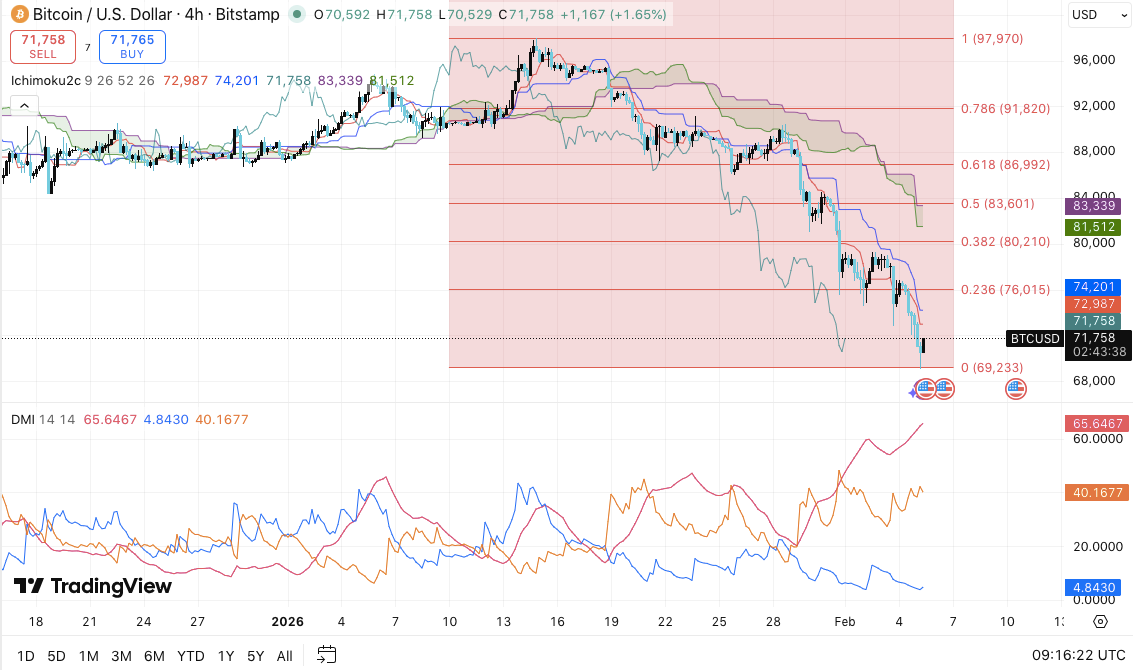
Immediate support sits between $71,750 and $71,500, where price currently reacts. However, a decisive break lower could expose $69,230, followed by the psychological $68,000 level.
On the upside, resistance remains layered and heavy. The first barrier sits between $72,987 and $74,200, where short-term averages cluster.
Related: World Mobile Token (WMTX) Price Prediction 2026-2030
Additionally, Bitcoin must reclaim $76,015 to slow downside momentum. A broader shift would require acceptance above $80,210, which marks a prior breakdown zone.
Derivatives and Spot Flows Signal Caution
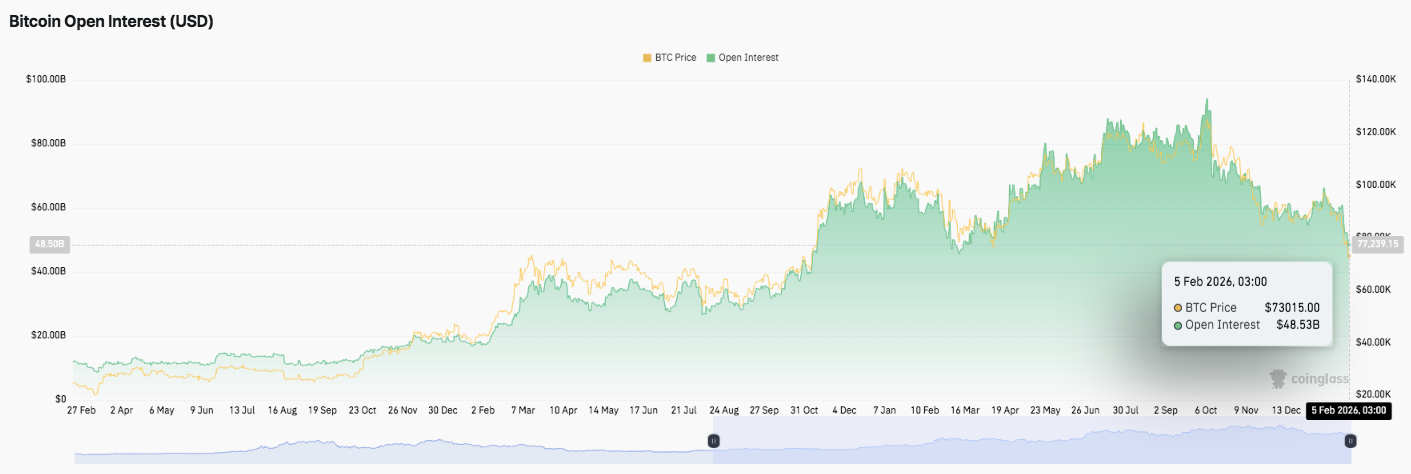
Derivatives data shows long-term growth in market participation, despite recent stress. Open interest expanded steadily through multiple price cycles, confirming deeper liquidity and engagement.
However, sharp contractions followed major pullbacks, reflecting leverage flushes and forced position reductions. Recently, open interest peaked above $80 billion before declining sharply, signaling risk reduction amid heightened volatility.
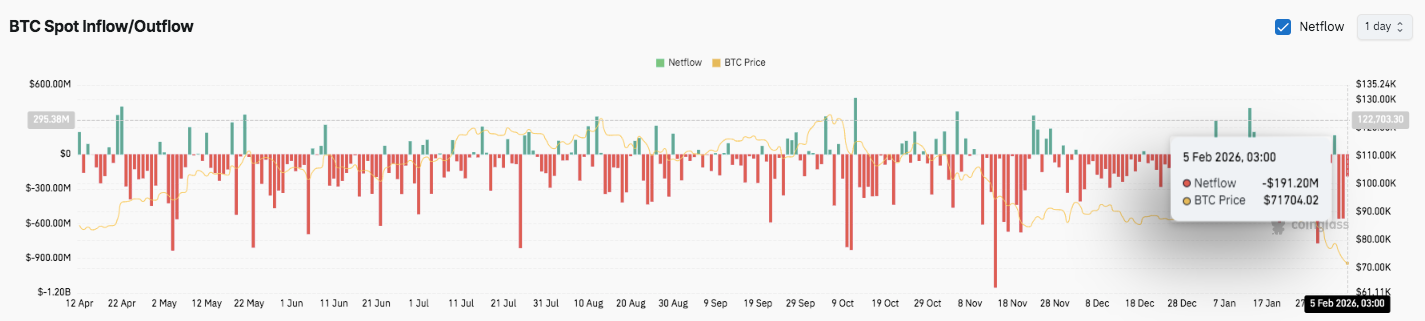
Spot flow data adds another layer of caution. Net outflows dominate recent sessions, indicating ongoing distribution pressure. Besides, deeper outflow spikes often align with sharp price declines, reinforcing reactive selling behavior.
Related: XRP Price Prediction: Token Crashes to Post-Election Low at $1.43 as $1 Target…
In contrast, inflows remain brief and inconsistent, failing to support sustained rebounds. Recent net outflows near $191 million reflect weak spot demand at current levels.
Bhutan’s Bitcoin Sales Add a Macro Layer
Additionally, sovereign activity has entered the narrative. Bhutan continues selling Bitcoin in roughly $50 million tranches after years of mining operations.
The country has generated more than $765 million in mining profits since 2019, far exceeding its energy investment. Consequently, these sales appear strategic rather than distressed, likely funding broader development initiatives.
Technical Outlook for Bitcoin (BTC)
Key levels remain clearly defined as Bitcoin trades inside a fragile short-term structure.
On the upside, $72,987 and $74,200 act as the first recovery hurdles, followed by $76,015 as the key Fibonacci level to reclaim. A sustained breakout above $76,000 could open room toward $80,210, where prior breakdown pressure emerged and medium-term momentum may shift.
On the downside, $71,750–$71,500 remains the immediate support zone to watch. A failure to hold this range exposes $69,230 as the next critical downside target, aligned with the Fibonacci base. Below that, $68,000 stands as a psychological support that may attract reactive bids.
The technical picture suggests Bitcoin remains locked in a controlled downtrend, marked by lower highs and persistent selling pressure. Price continues to trade below the Ichimoku cloud, keeping trend resistance firmly overhead. As long as BTC stays capped below the $74,000–$76,000 zone, upside moves likely remain corrective.
Will Bitcoin Rebound?
Bitcoin’s near-term outlook depends on whether buyers can defend the $71,500 region long enough to challenge overhead resistance. Compression between support and trend resistance points to rising volatility ahead.
If inflows strengthen and BTC reclaims $76,000, momentum could shift toward a broader recovery phase. However, failure to hold $71,500 risks accelerating losses toward $69,230 and possibly $68,000. For now, Bitcoin sits at a pivotal inflection point, where technical confirmation and conviction flows will define the next directional move.
Related: Hyperliquid Price Prediction: HYPE Price Pauses After Rally as Treasury Unlocks New Yield Path
Disclaimer: The information presented in this article is for informational and educational purposes only. The article does not constitute financial advice or advice of any kind. Coin Edition is not responsible for any losses incurred as a result of the utilization of content, products, or services mentioned. Readers are advised to exercise caution before taking any action related to the company.

 Price Prediction: Can Bulls Sustain Above $2,100?")


