 Price Prediction for July 12")
After spending nearly eight weeks inside a range-bound structure, Bitcoin price today has blasted through upper resistance to hit $118,000, marking its highest level since early April. The breakout comes as ETF inflows resume and institutional interest picks up, supported by the prospect of Federal Reserve rate cuts in Q3. Technicals now show BTC entering a high-momentum phase, with potential targets around $120,000 and beyond.
What’s Happening With Bitcoin’s Price?
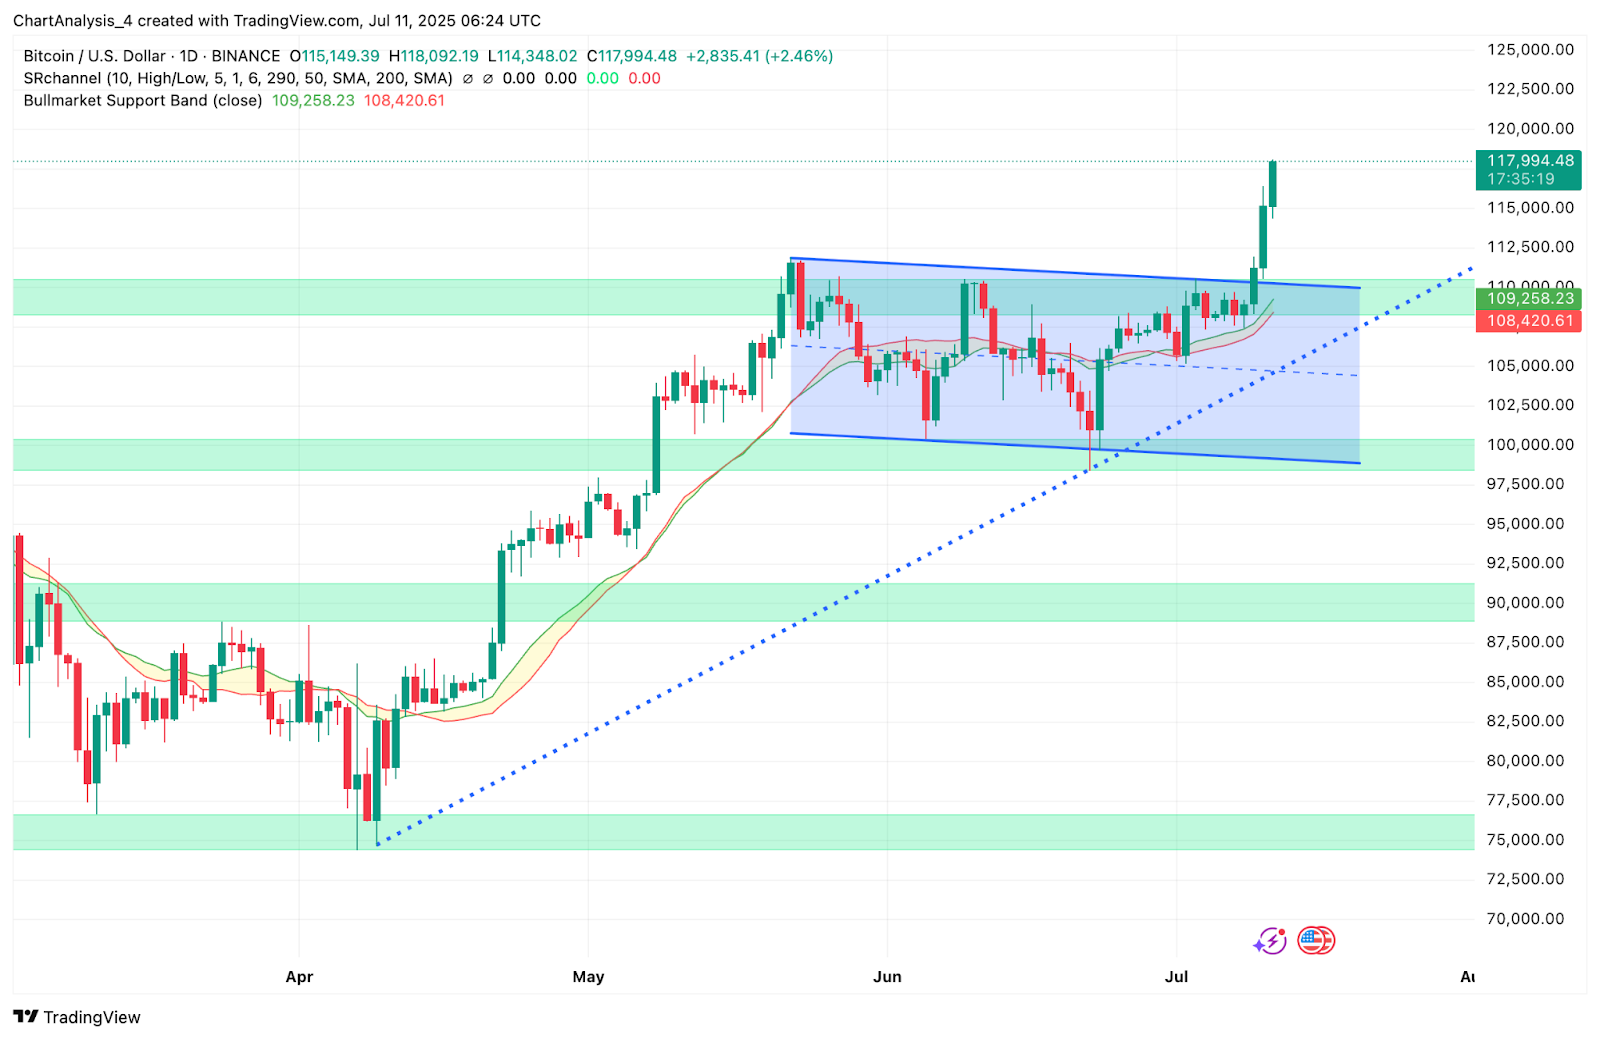
On the daily chart, Bitcoin price has cleanly broken out of a broad descending channel that held price action between $100,000 and $111,000. The breakout candle on July 10 came with strong body expansion and follow-through volume, confirming bullish intent. BTC has also reclaimed the 20/50 EMA cluster and is trading well above the Bull Market Support Band, currently near $109,250–$108,420.
This upside resolution has invalidated the prior range and pushed BTC into a new structural leg. With $111,000 now flipped into support, the broader trend bias has turned aggressively bullish. The breakout also aligns with a longer-term ascending trendline, reinforcing the bullish market structure from March onward.
Why Is The Bitcoin Price Going Up Today?
The primary catalyst behind why Bitcoin price going up today is a combination of strong inflows into spot ETFs, heightened on-chain activity, and institutional buying interest in anticipation of the U.S. Federal Reserve easing rates in Q3.
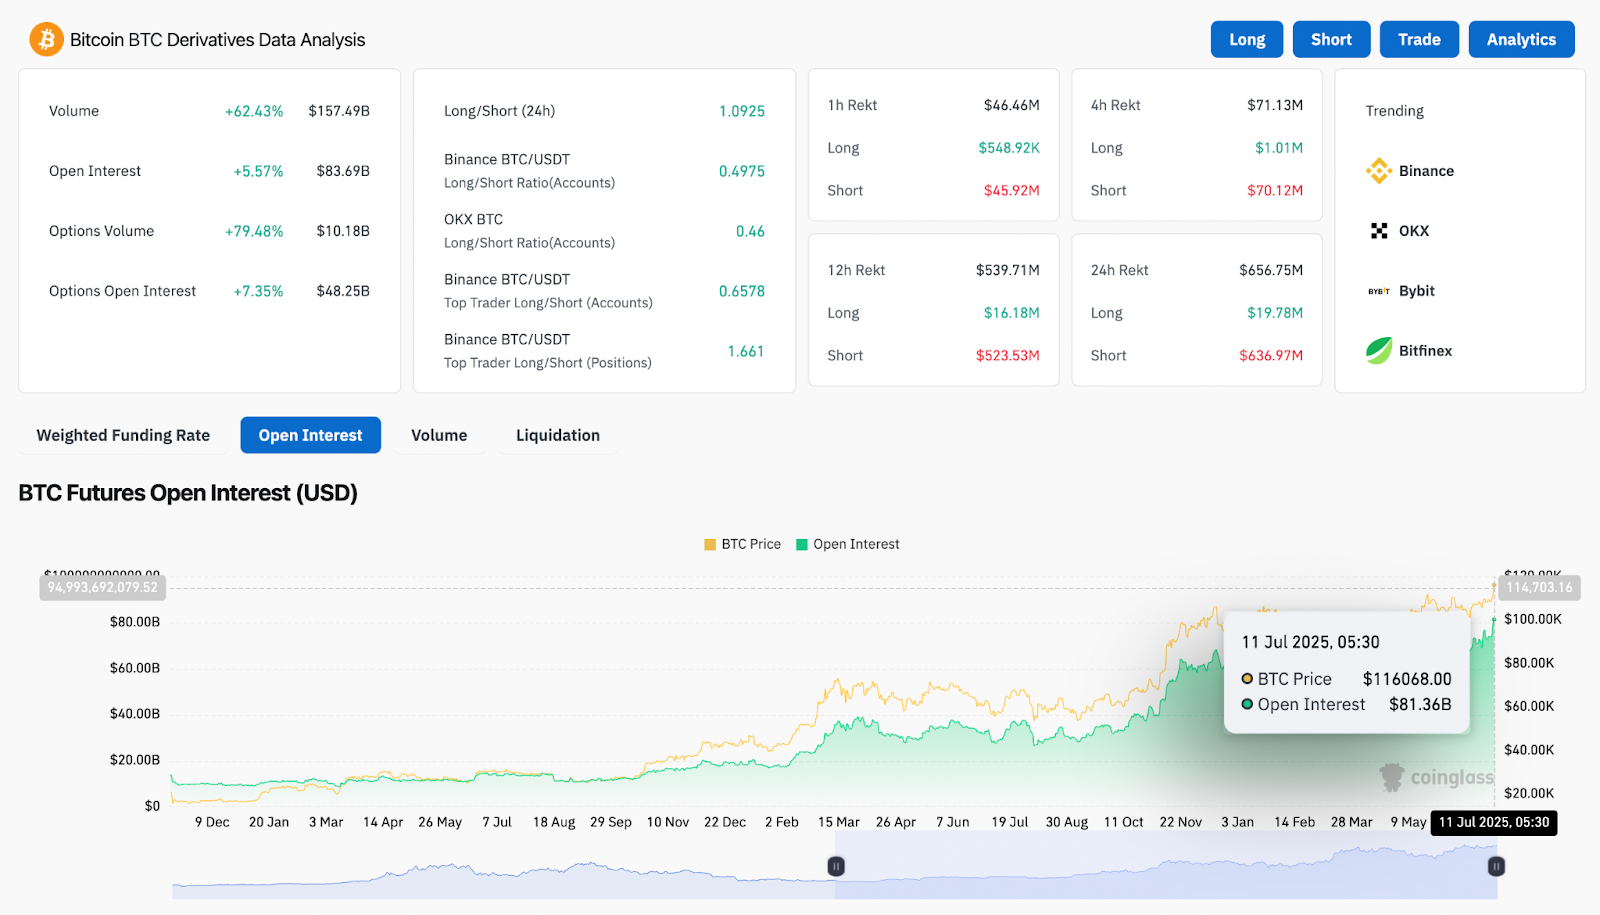
Derivatives metrics show a strong long bias: open interest has surged by 5.57%, and 24-hour volume is up by 62.43%, now totaling over $157 billion. Options volume has also soared by nearly 80%, suggesting traders are positioning for continued upside. Long/short ratios remain skewed in favor of bulls across Binance (1.09), OKX, and Bybit. Importantly, top traders on Binance are holding a 1.66 long/short ratio, indicating high-conviction directional bets.
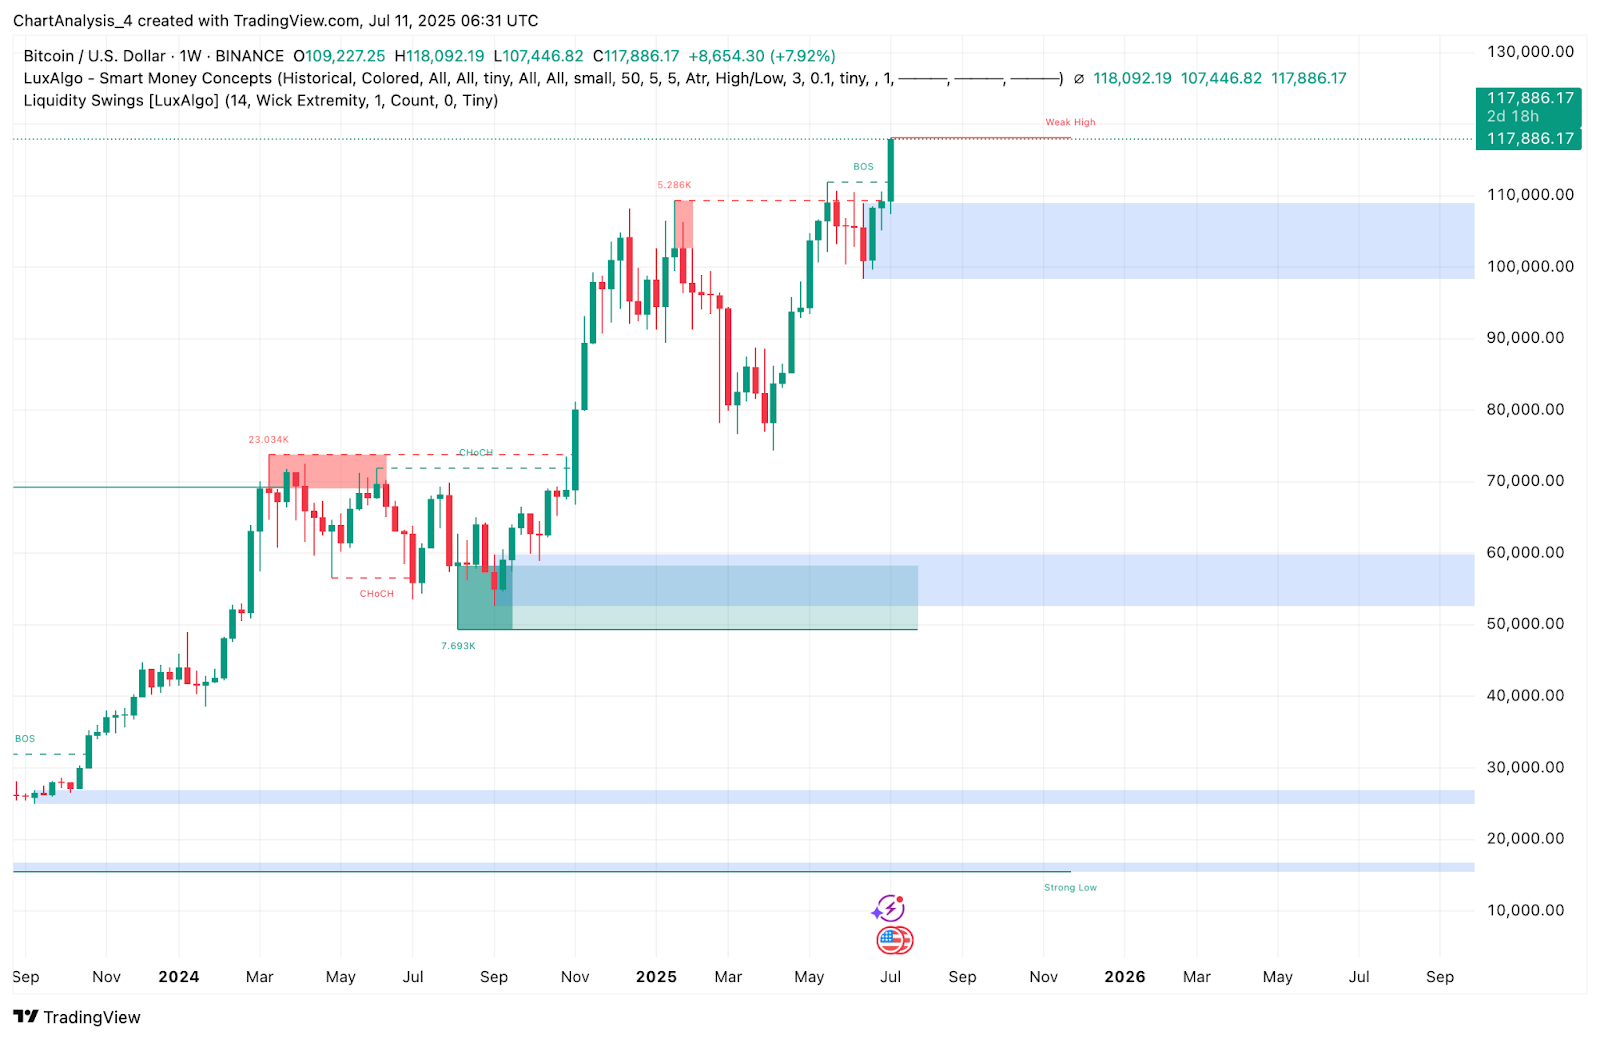
This bullish drive is also visible on the Smart Money Concepts chart. BTC has broken structure (BOS) above the previous weekly high, confirming a macro bullish transition. With liquidity above $118,000 now being taken out, the next upside targets could reside between $120,000 and $125,000.
Bollinger Bands, RSI, And MACD Signal Momentum Continuation
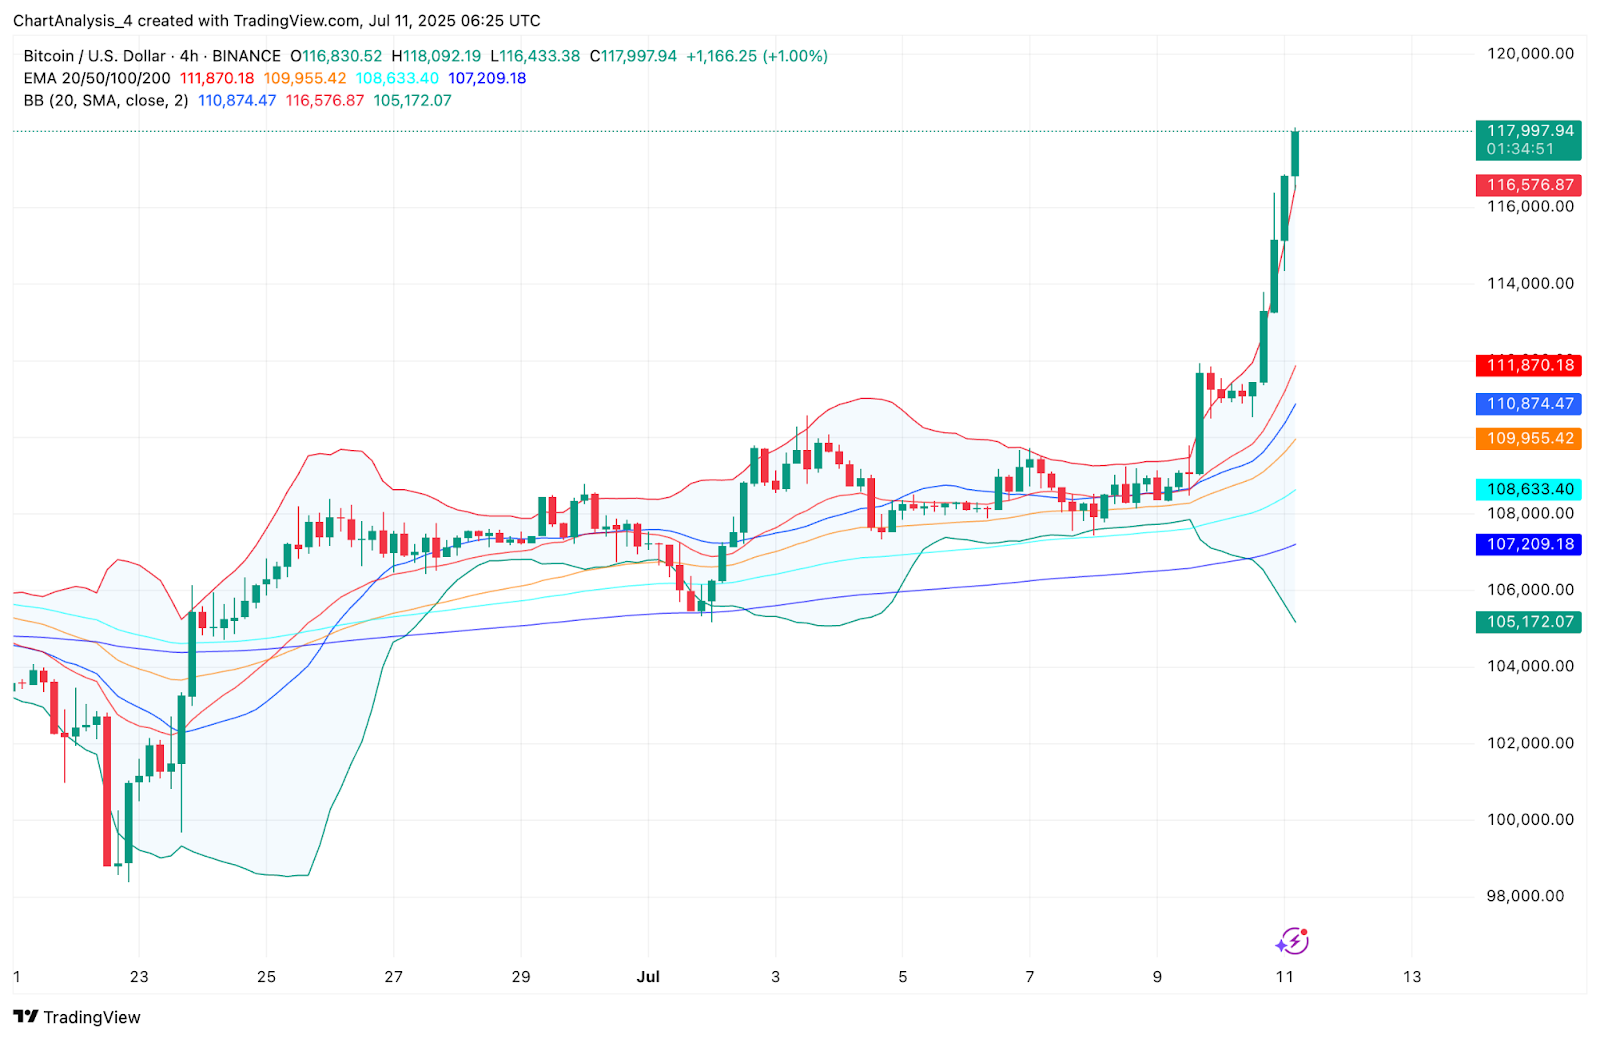
On the 4-hour chart, Bollinger Bands are aggressively expanding, with Bitcoin price pushing through the upper band near $116,500. Price is now trading in a strong volatility expansion phase, often associated with trending breakouts. The 20/50/100/200 EMAs are all stacked bullishly below price, with the closest dynamic support near $111,870.
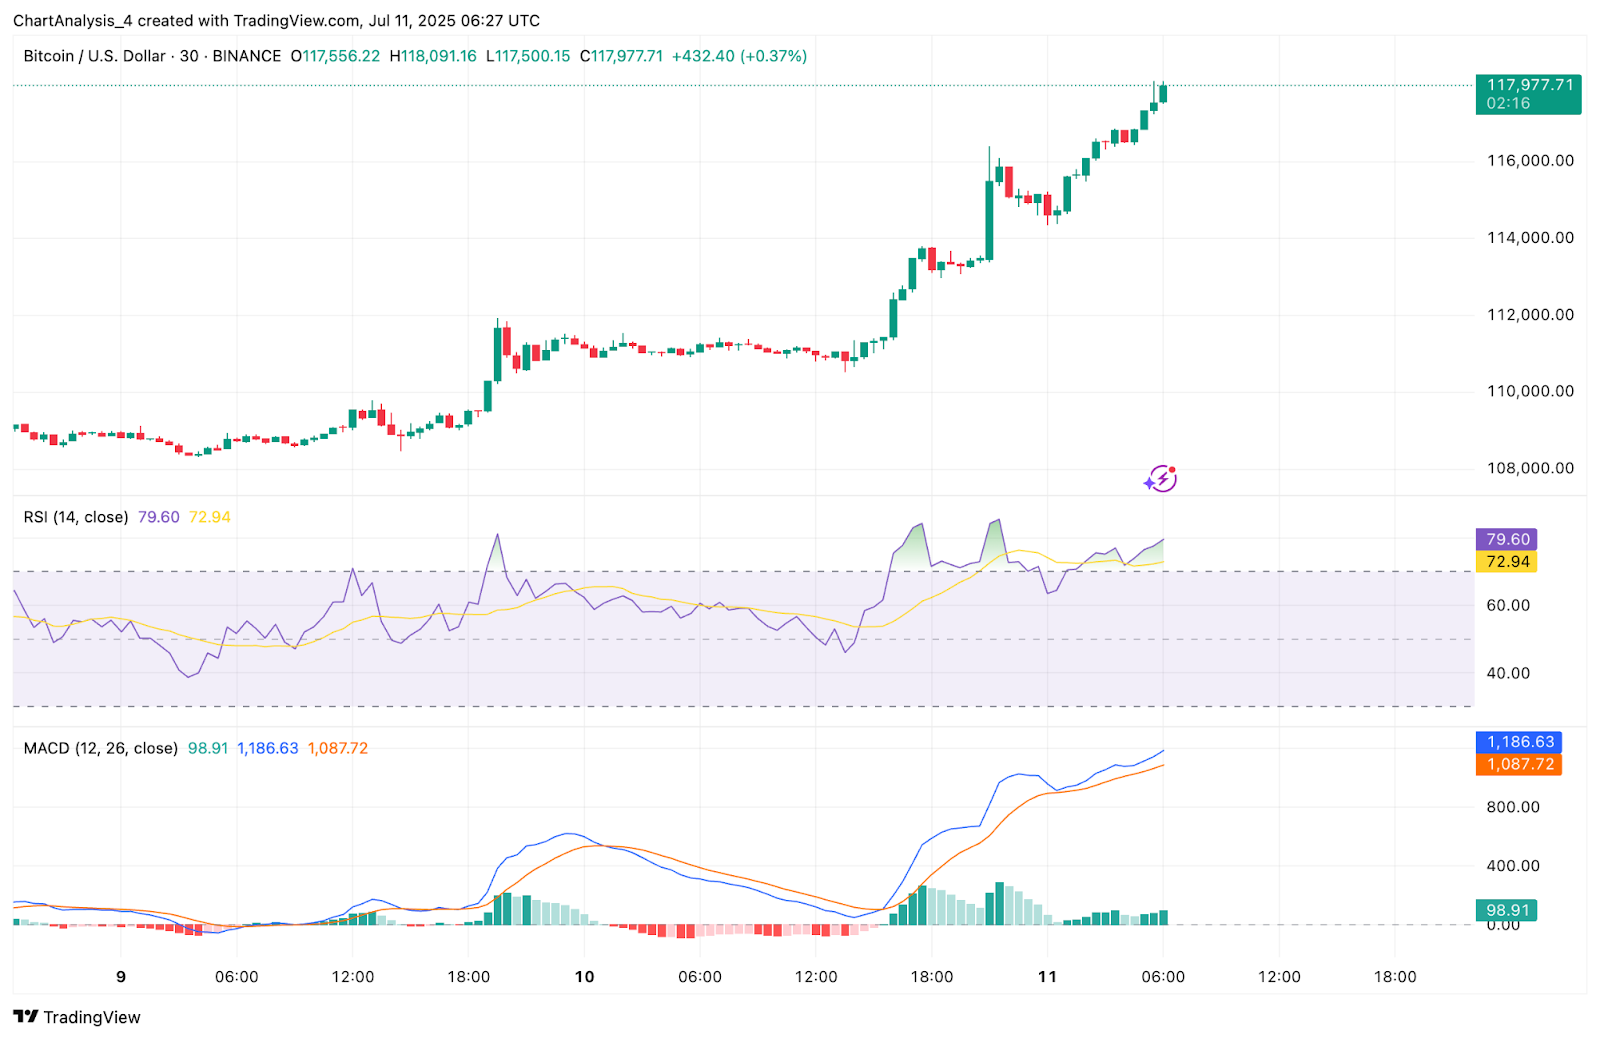
On the 30-minute chart, RSI has surged to 79.6, indicating overbought conditions but also confirming strong upside momentum. MACD is deeply bullish, with the signal line expanding positively and the histogram printing strong green bars. There are currently no divergence signals, meaning momentum remains intact.
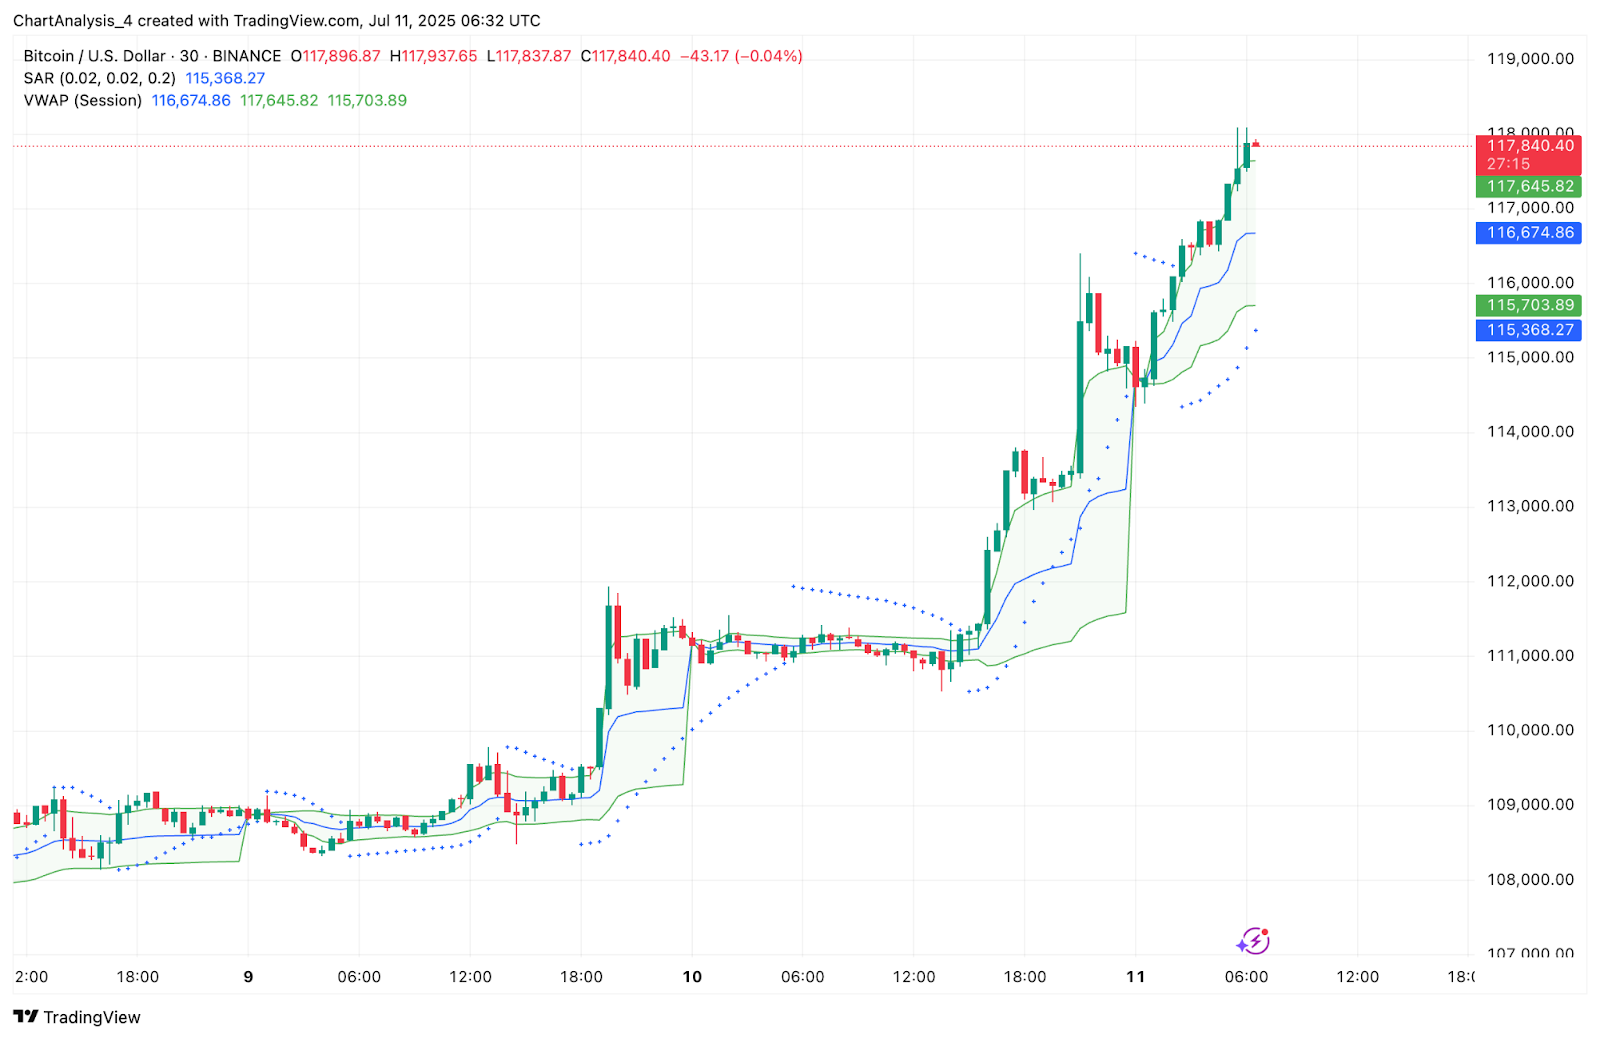
Meanwhile, the VWAP on lower timeframes has been reclaimed and maintained, confirming buyer control above $116,500. Parabolic SAR and Supertrend indicators have flipped fully bullish, with price holding well above both bands and dots, respectively.
BTC Price Prediction: Short-Term Outlook (24H)
As long as Bitcoin price remains above $116,000–$116,500, the bias remains to the upside. The immediate target sits at $120,000, where psychological resistance may create intraday volatility. A decisive breakout above this threshold could open the path toward $122,800 and $125,000, aligning with weekly liquidity extensions.
On the downside, support rests at the previous range high of $111,000, followed by the EMA confluence zone between $109,000 and $108,000. Any breakdown below this zone would invalidate the breakout and suggest a deeper retest.
Given the current volume profile, trending indicator alignment, and strong institutional backing, BTC appears poised to hold its breakout zone in the short term, though intraday pullbacks toward support should be monitored for trap wicks or re-entry zones.
Bitcoin Price Forecast Table: July 12, 2025
| Indicator/Zone | Level / Signal |
| Bitcoin price today | $117,997 |
| Resistance 1 | $120,000 |
| Resistance 2 | $122,800 |
| Support 1 | $116,000 |
| Support 2 | $111,000 |
| RSI (30-min) | 79.6 (Overbought) |
| MACD (30-min) | Strong bullish expansion |
| Supertrend (4H) | Bullish flip at $113,008 |
| EMA Cluster (20/50/100/200, 4H) | Bullish stack, support at $111,870 |
| Bollinger Bands (4H) | Expanded, upper band breached |
| VWAP (30-min) | Holding above $116,500 |
| Derivatives Volume | +62.43%, long-heavy bias |
| Smart Money BOS | Confirmed, above prior high |
Disclaimer: The information presented in this article is for informational and educational purposes only. The article does not constitute financial advice or advice of any kind. Coin Edition is not responsible for any losses incurred as a result of the utilization of content, products, or services mentioned. Readers are advised to exercise caution before taking any action related to the company.


