 Price Prediction for July 16 2025")
After breaking above $122,000 earlier this week, Bitcoin price faced rejection near the upper boundary of a major volume resistance zone. The move follows President Donald Trump’s 30% tariff announcement on EU and Mexican imports, triggering mixed reactions across risk assets. As of writing, Bitcoin price today is trading around $117,200, down over 4.8% from its recent highs.
Bitcoin Price Forecast Table: July 16, 2025
| Indicator/Zone | Level / Signal |
| Bitcoin Price Today | $117,200 |
| Resistance 1 | $119,000 |
| Resistance 2 | $122,000 |
| Support 1 | $115,400 |
| Support 2 | $112,400 |
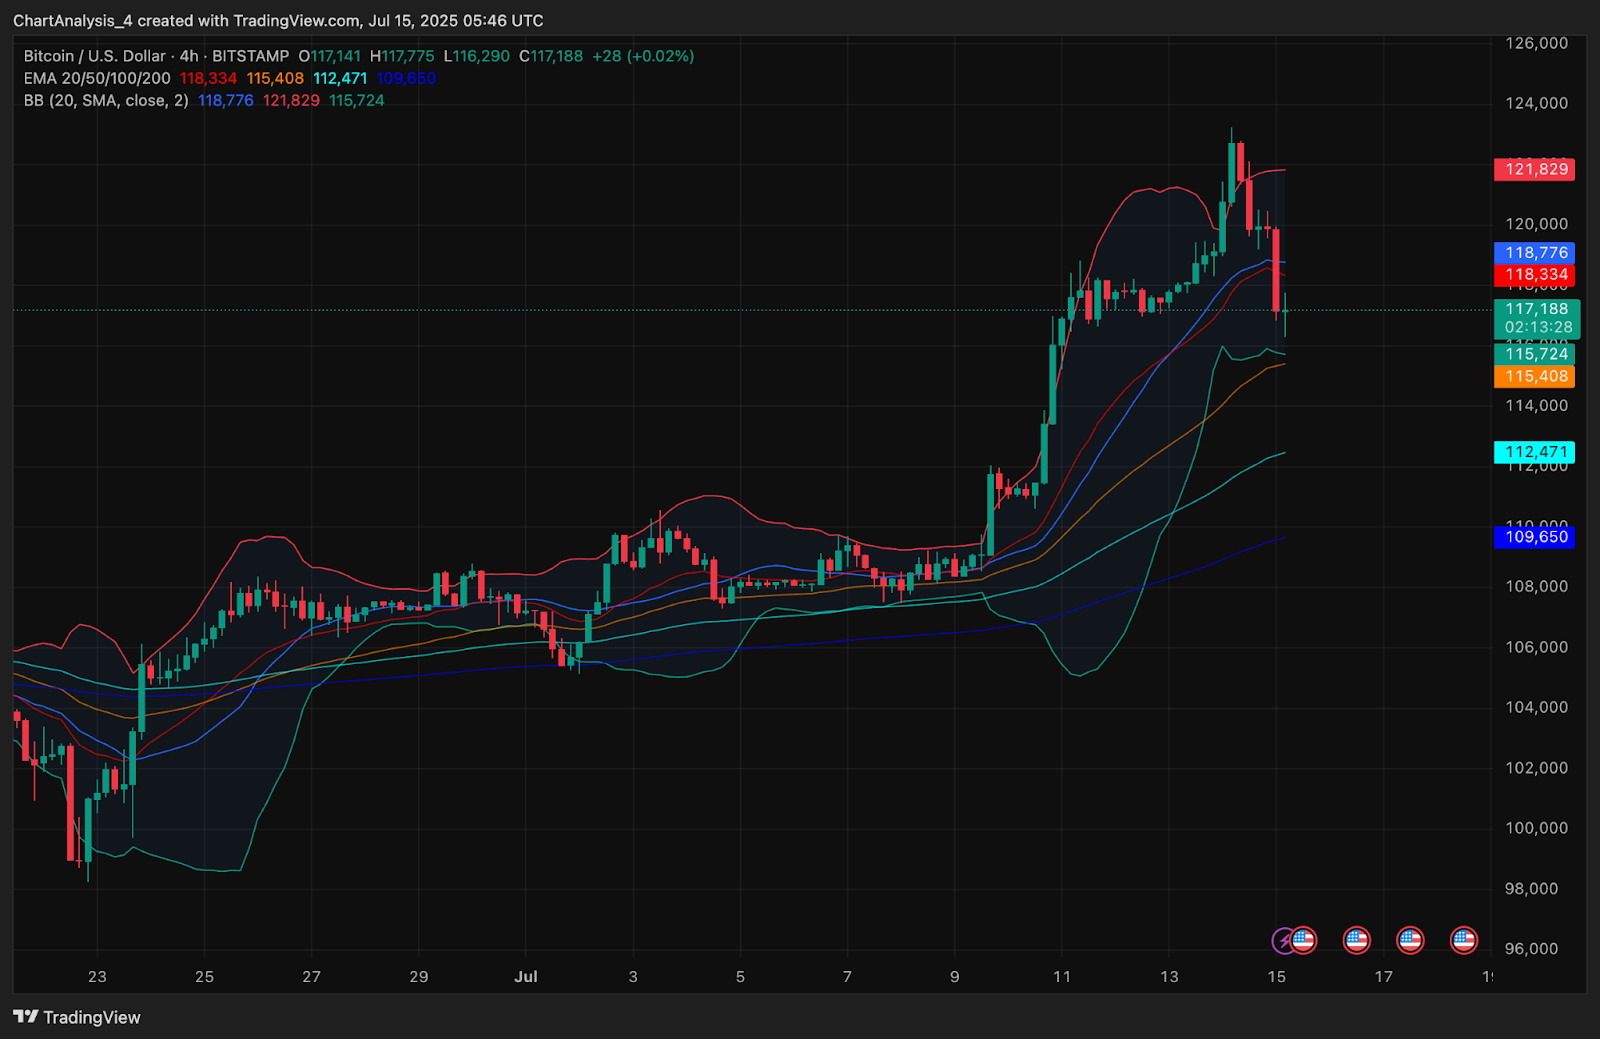
| Bollinger Bands (4H) | Mean at $117,300, Lower Band near $115,700 |
| Supertrend (4H) | Bearish Flip at $121,563 |
| RSI (4H) | 48.5 (Neutral-Bearish) |
| MACD (4H) | Bearish Crossover |
| DMI (4H) | -DI > +DI, ADX at 27.27 (Bearish Strength) |
| Spot Netflow (July 15) | -$477.9M (Negative Liquidity) |
| Open Interest | $86.11B (-1.81%) |
| Derivatives Volume | $147.18B (+31.78%) |
What’s Happening With Bitcoin’s Price?
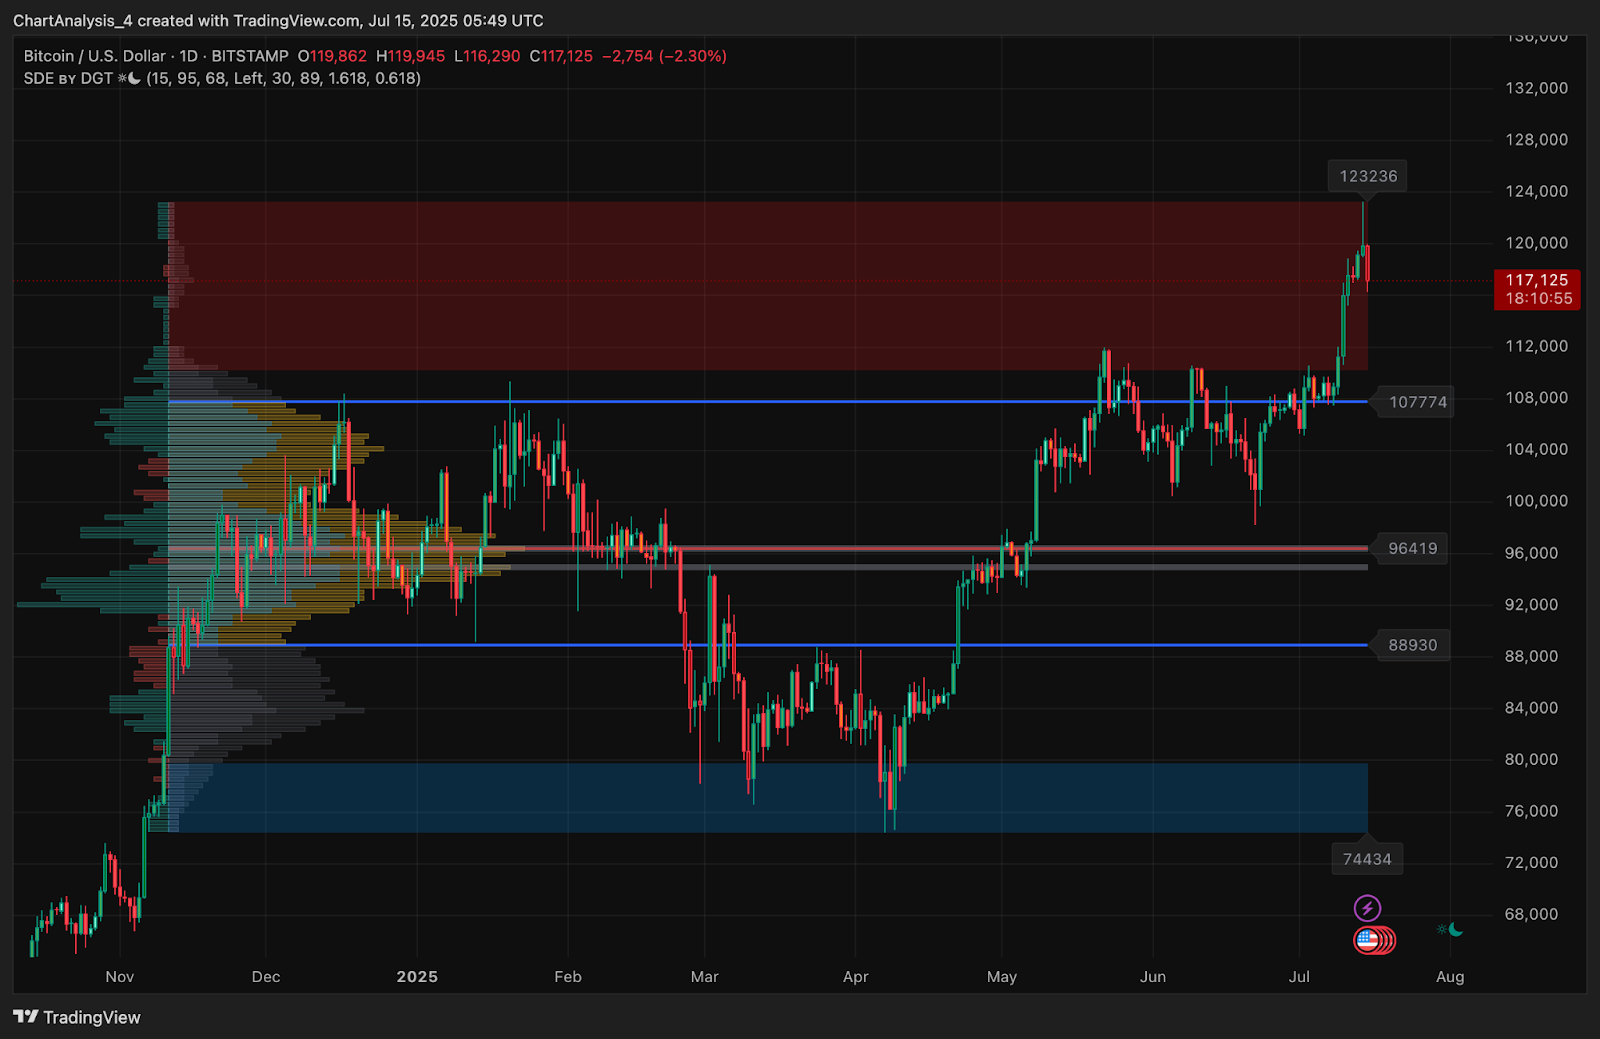
Bitcoin broke out of its range on July 11, rallying over $15,000 to test $123,236 which is a key supply zone marked by a red order block on the daily volume profile. However, price failed to hold above $122,000 and quickly reversed below $118,000 on the 4-hour chart.
The breakdown occurred after a clean rejection from the upper Bollinger Band and a flip in the 4-hour Supertrend indicator at $121,563. At the same time, price has now returned to the Bollinger mean near $117,300, with support sitting just below around $115,700 (Bollinger base and EMA100 zone).
The Bitcoin price action now sits in a high-consolidation range where buyers must defend $115,000–$117,000 to avoid cascading lower.
Why Is The Bitcoin Price Going Down Today?
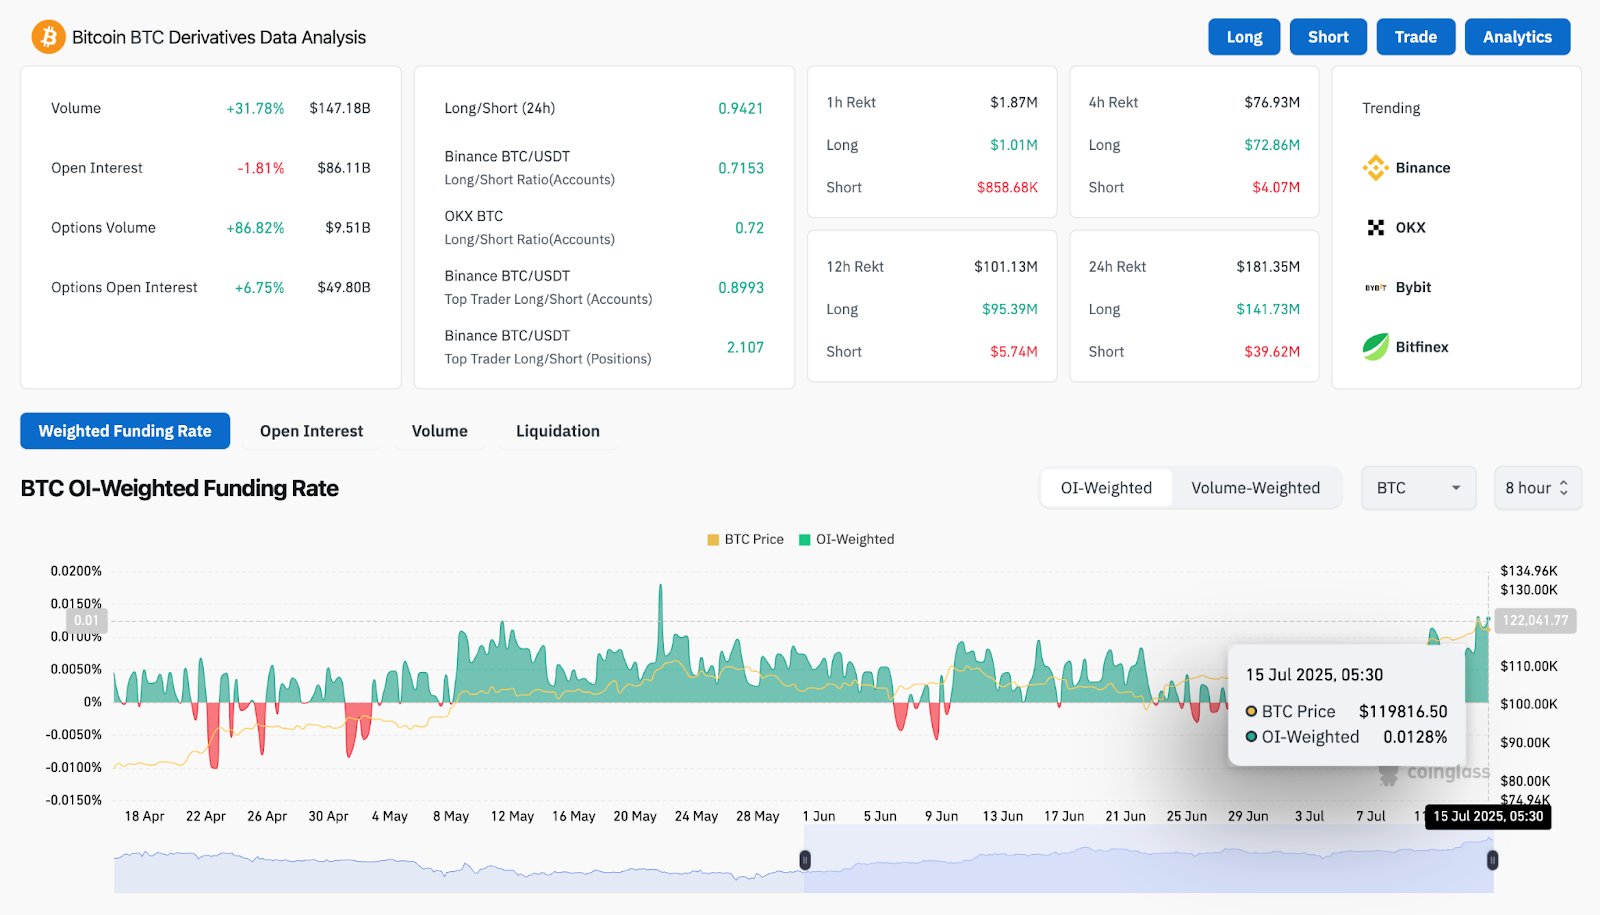
The question of why Bitcoin price going down today is closely tied to a confluence of technical exhaustion and weakening derivatives positioning. Despite derivatives volume rising over 31% to $147.18B, open interest fell 1.81% to $86.11B — a clear sign of long liquidations.
Coinglass data shows that nearly $181M in positions were wiped in 24 hours, with $39.6M of that being shorts and $141.7M from longs i.e. a strong indication of overleveraged buyers being flushed.
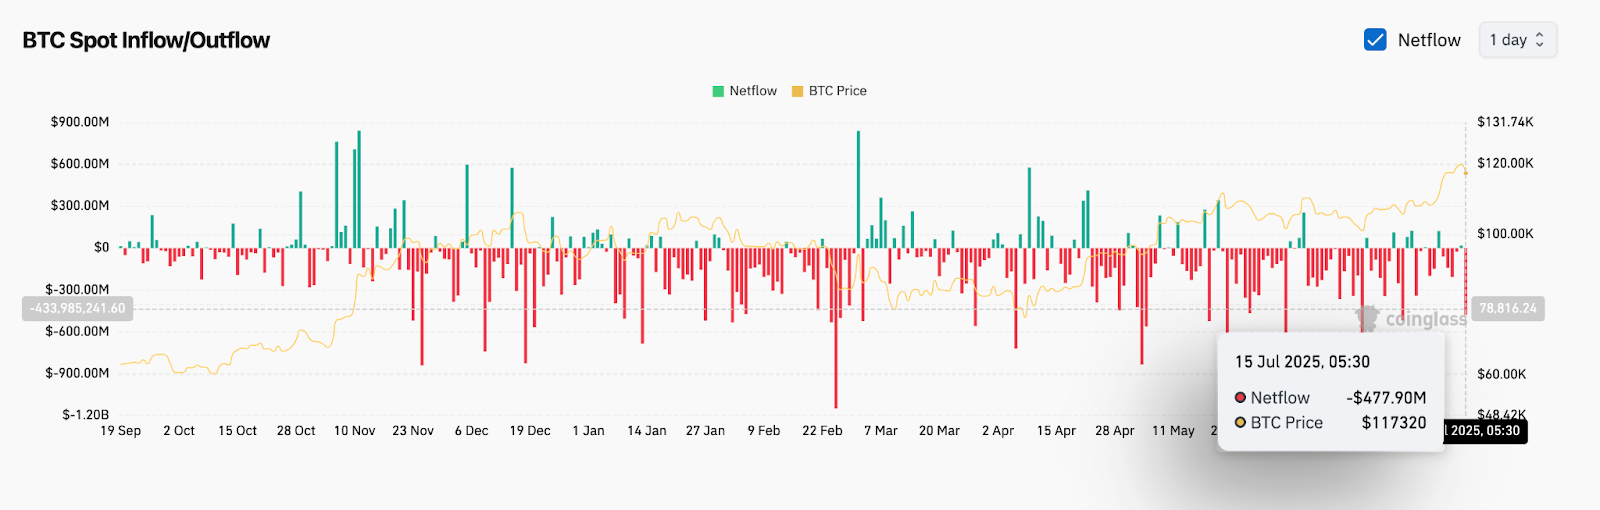
Adding to bearish pressure is the continued outflow from spot markets. According to the BTC spot inflow/outflow chart, July 15 saw a net outflow of $477.9 million, suggesting large holders are taking profit or de-risking. This outflow trend has persisted even during the rally, indicating a structural imbalance in real demand.
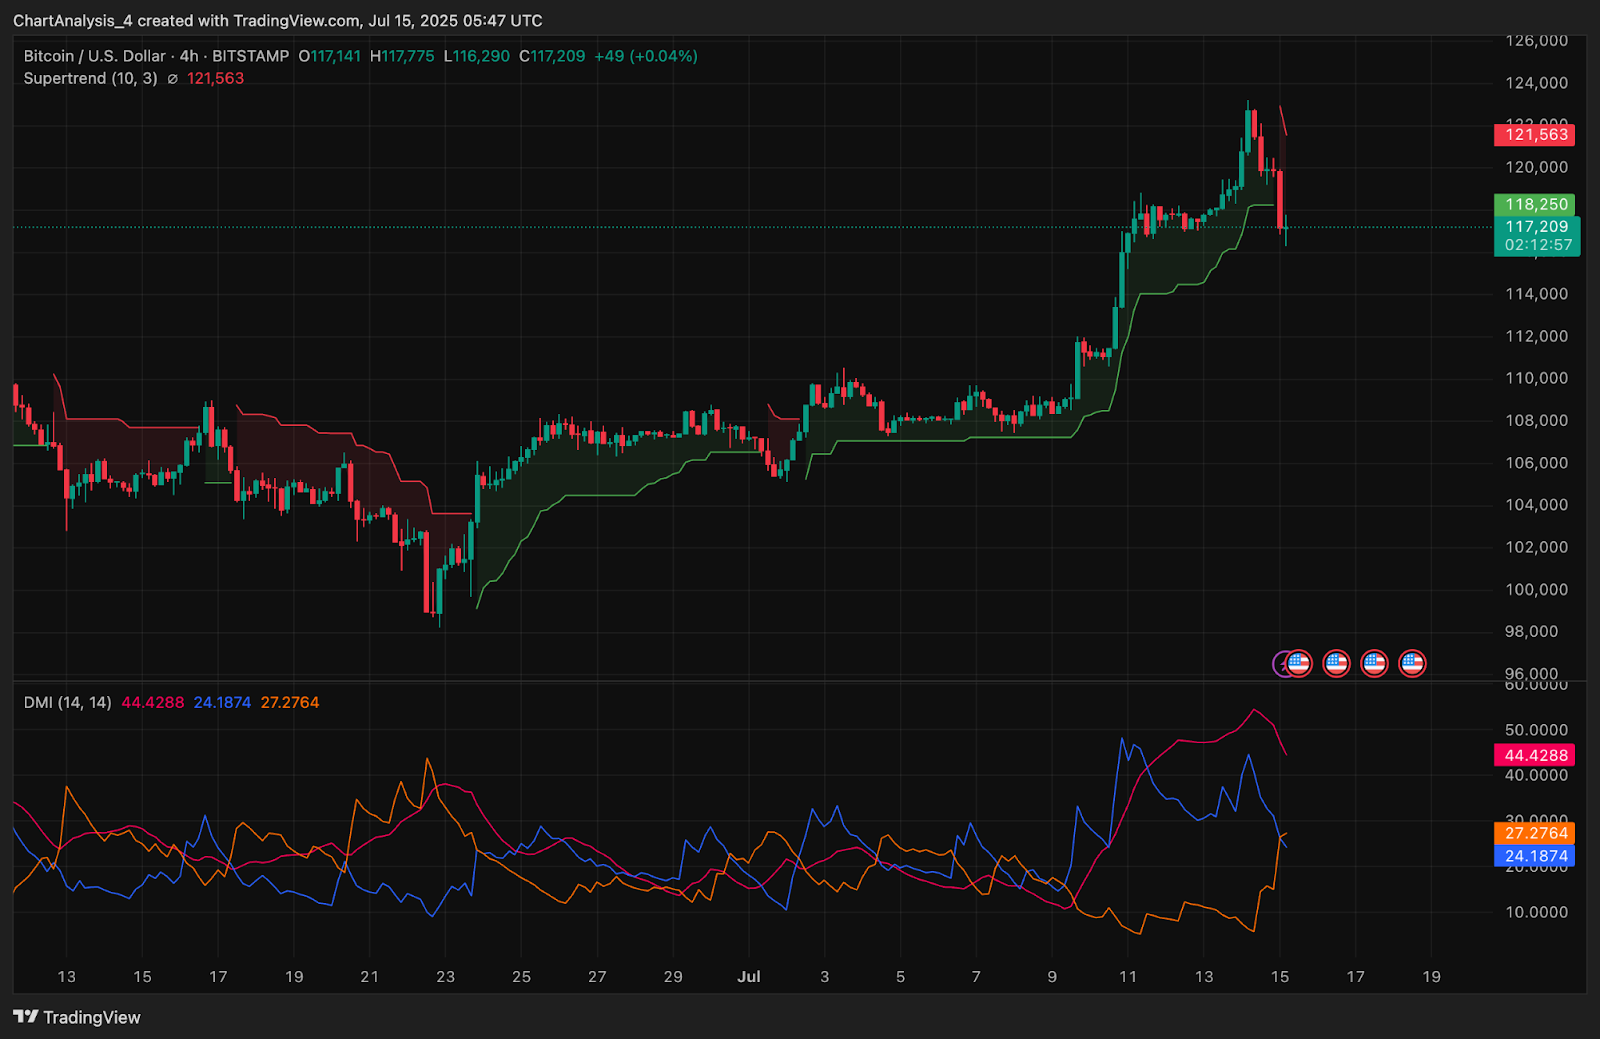
The Supertrend indicator turned bearish at $121,563 after holding bullish throughout the early July rally. This flip coincided with the first candle close below the previous swing high structure, adding to the bearish outlook.
Further, the DMI (Directional Movement Index) on the 4-hour chart shows -DI crossing above +DI, with ADX holding firm at 27.27. This setup confirms growing trend strength in favor of sellers.
Bollinger Bands And Supertrend Flip Signal Volatility Reversal
On the 4-hour chart, Bitcoin price volatility appears to have flipped direction. The Bollinger Bands, which had expanded on the breakout, are now beginning to contract again — often signaling a cooling phase or transition.
Additionally, the EMAs on the 4-hour chart show early signs of clustering. The 20 EMA is beginning to slope downward at $118,334, while the 50 and 100 EMAs at $115,408 and $112,471 respectively are likely to act as dynamic support if current levels fail.
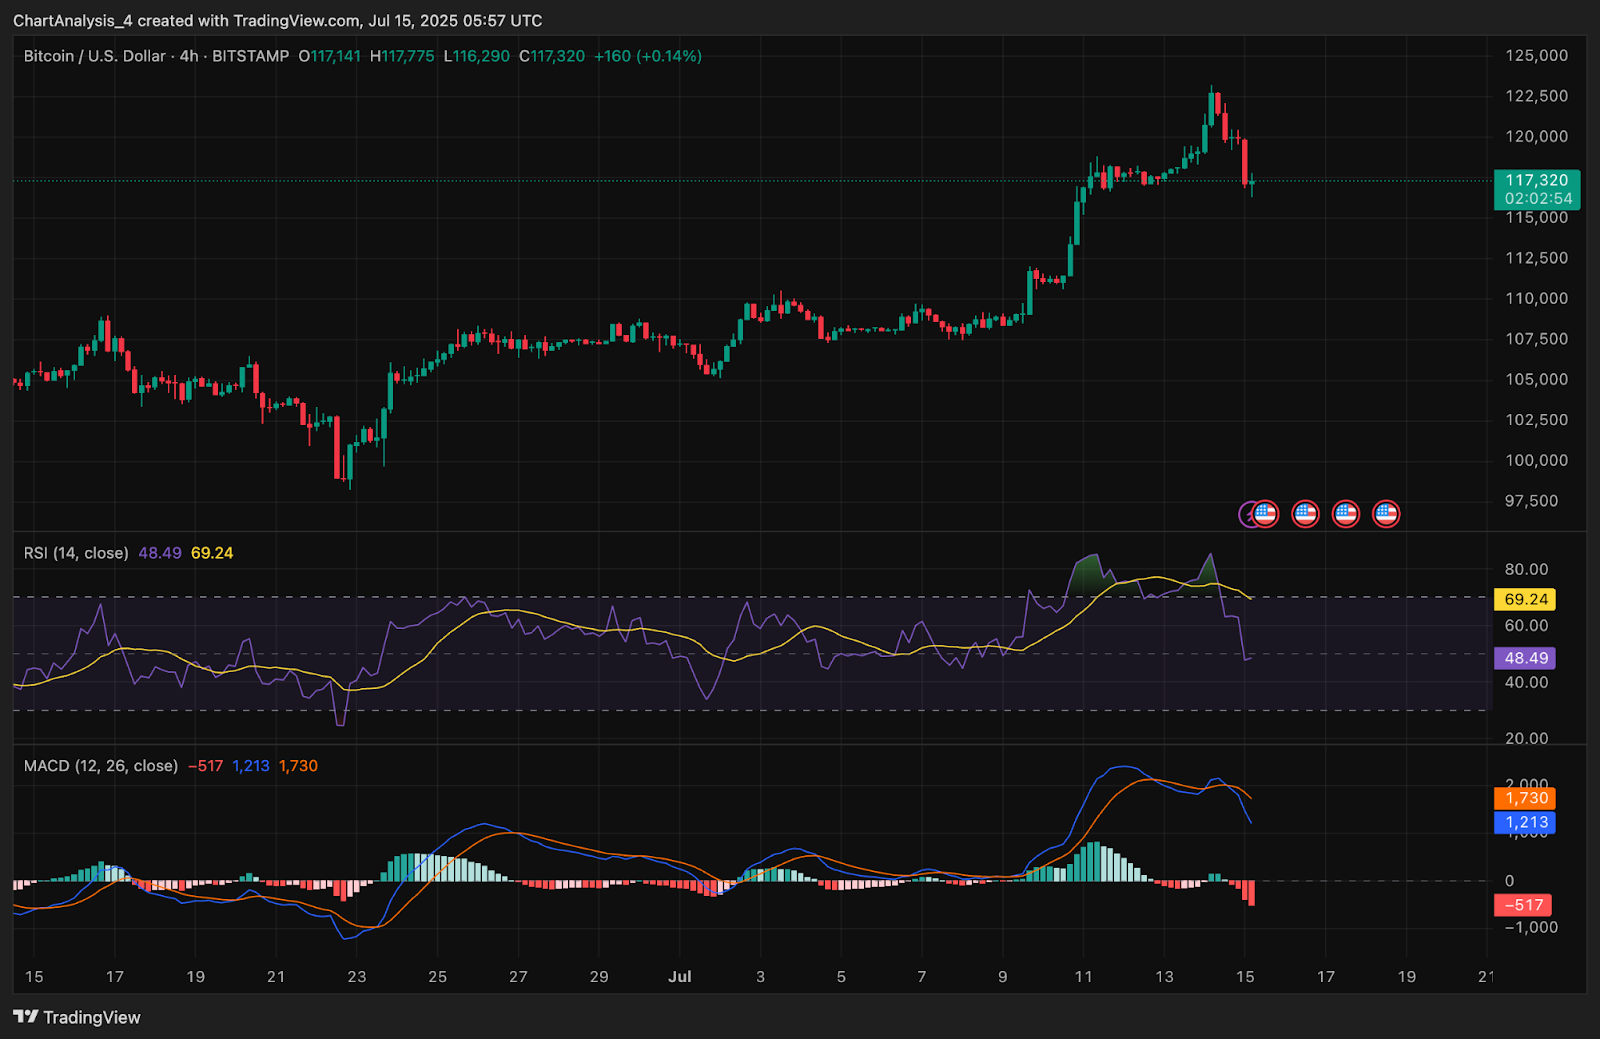
The RSI on the 30-minute chart remains below 50, and MACD continues to print red bars, suggesting near-term price weakness may persist unless bulls reclaim $119,000 decisively.
BTC Price Prediction: Short-Term Outlook (24H)
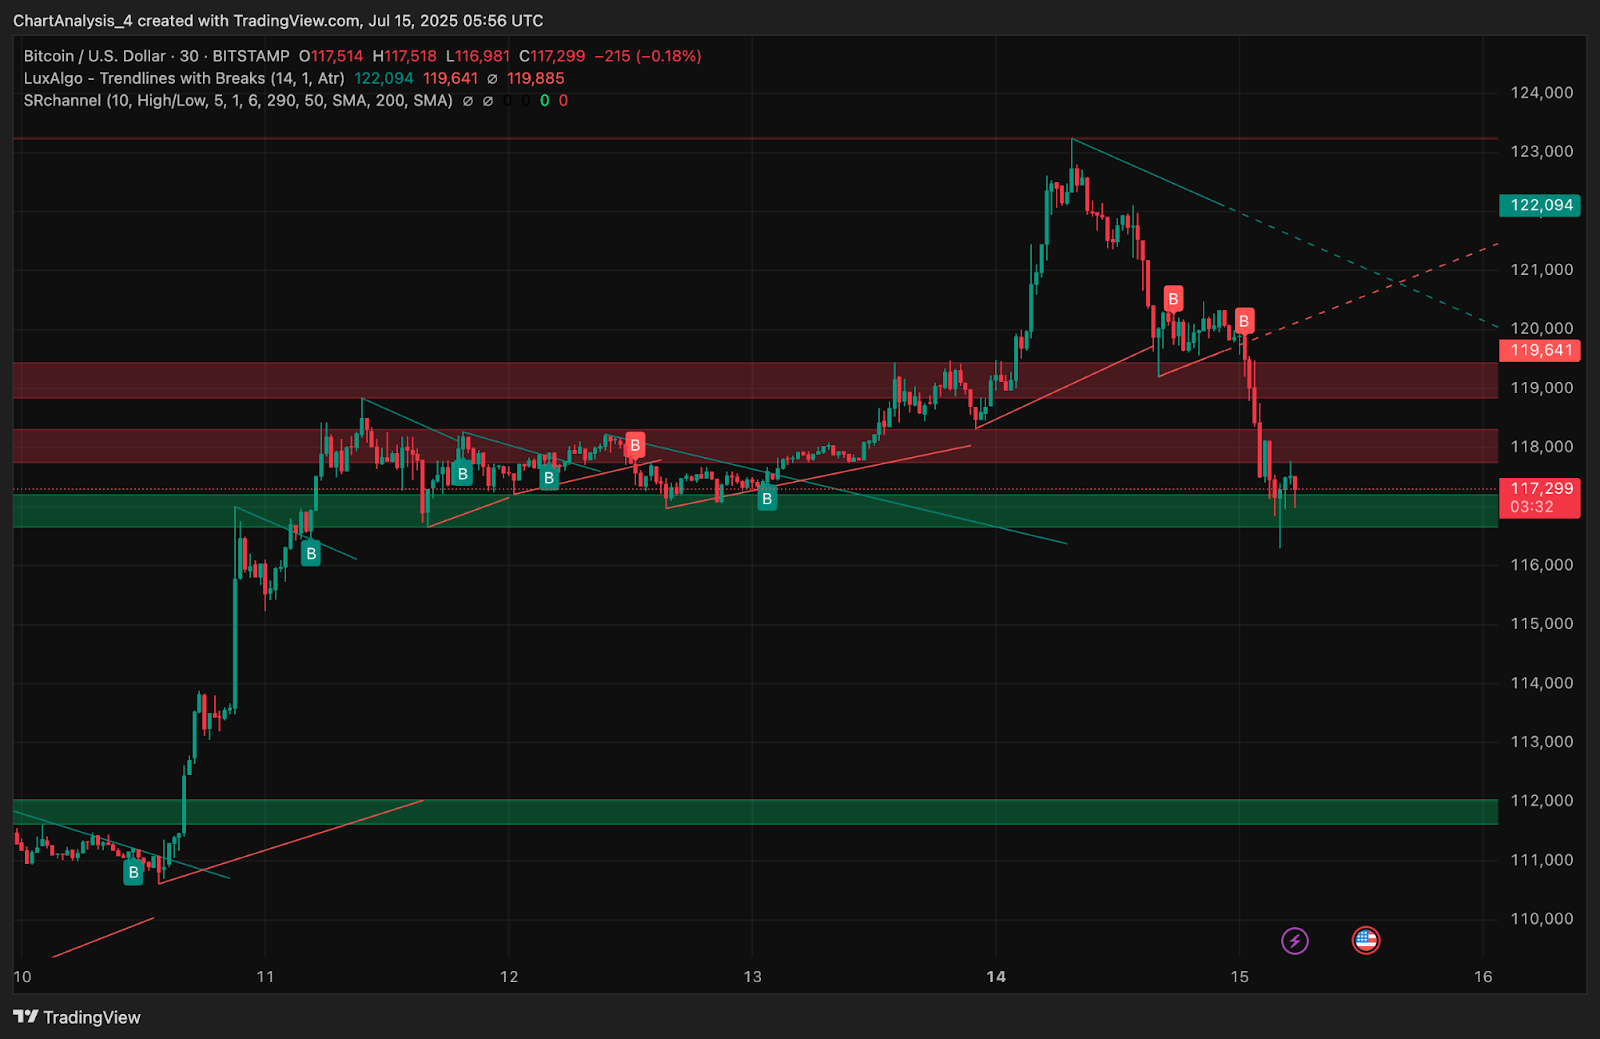
Bitcoin price today is trading just above the critical demand block between $115,500 and $117,000. If bulls hold this zone, a bounce toward $119,000–$120,000 remains possible, especially if funding rates stay positive and the funding-weighted OI stabilizes.
On the upside, a move back above $122,000 would invalidate the current breakdown structure and reopen the path toward $125,000. However, this scenario requires strong volume and derivatives reaccumulation, both of which are absent at the moment.
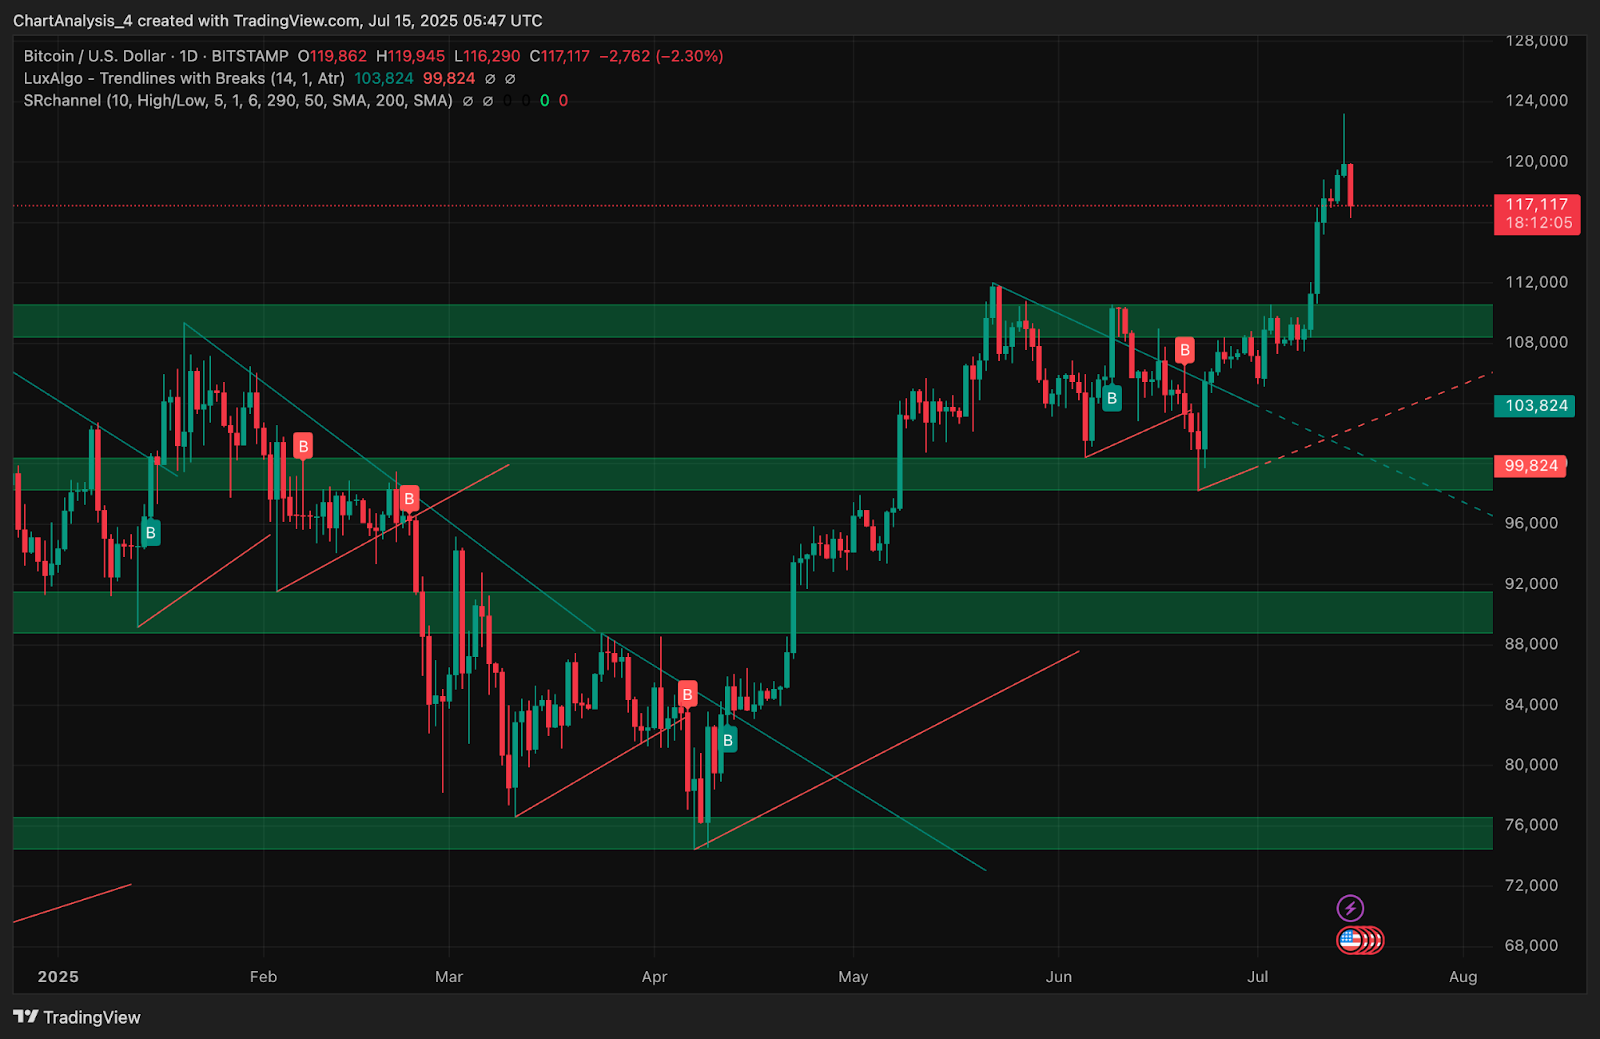
If sellers extend the rejection, the next major support lies at $112,400 (EMA100) followed by the structural breakout zone at $107,700. A breakdown below that region could trigger a deeper retest of $103,800 and even $99,800 based on daily trendlines.
With sentiment neutralizing and intraday indicators favoring sellers, traders should watch for volatility spikes near $117K–$118K and how Bitcoin reacts to the rising demand zone around $115,000.
Disclaimer: The information presented in this article is for informational and educational purposes only. The article does not constitute financial advice or advice of any kind. Coin Edition is not responsible for any losses incurred as a result of the utilization of content, products, or services mentioned. Readers are advised to exercise caution before taking any action related to the company.


