 Price Prediction for July 17, 2025")
After a sharp rally to a local high of $122,000 earlier this week, Bitcoin price has entered a consolidation phase, trading near $117,300 at the time of writing. While the broader trend remains bullish, several technical signals on the lower timeframes now point to exhaustion. Bulls must defend the $115,000–$116,000 zone to avoid a deeper retracement.
Bitcoin Price Forecast Table: July 17, 2025
| Indicator/Zone | Level / Signal |
| Bitcoin price today | $117,316 |
| Resistance 1 | $118,200 (Bollinger mid-band) |
| Resistance 2 | $120,500–$122,000 (supply + wedge) |
| Support 1 | $115,000 (EMA50 and local base) |
| Support 2 | $112,500 (trendline + liquidity) |
| RSI (4H) | 51.34 (neutral, cooling) |
| MACD (4H) | Bearish crossover |
| VWAP (30-min) | $117,297 (resistance) |
| SAR (30-min) | Above price (bearish) |
| Bollinger Bands (4H) | Tightening, volatility setup |
| EMA Cluster (20/50/100/200, 4H) | 20 EMA at $117,496 (pivot zone) |
| Derivatives Volume | -14.35%, cooling sentiment |
| Options Hot Zone (July 25) | $117,000–$118,000 (pin levels) |
What’s Happening With Bitcoin’s Price?
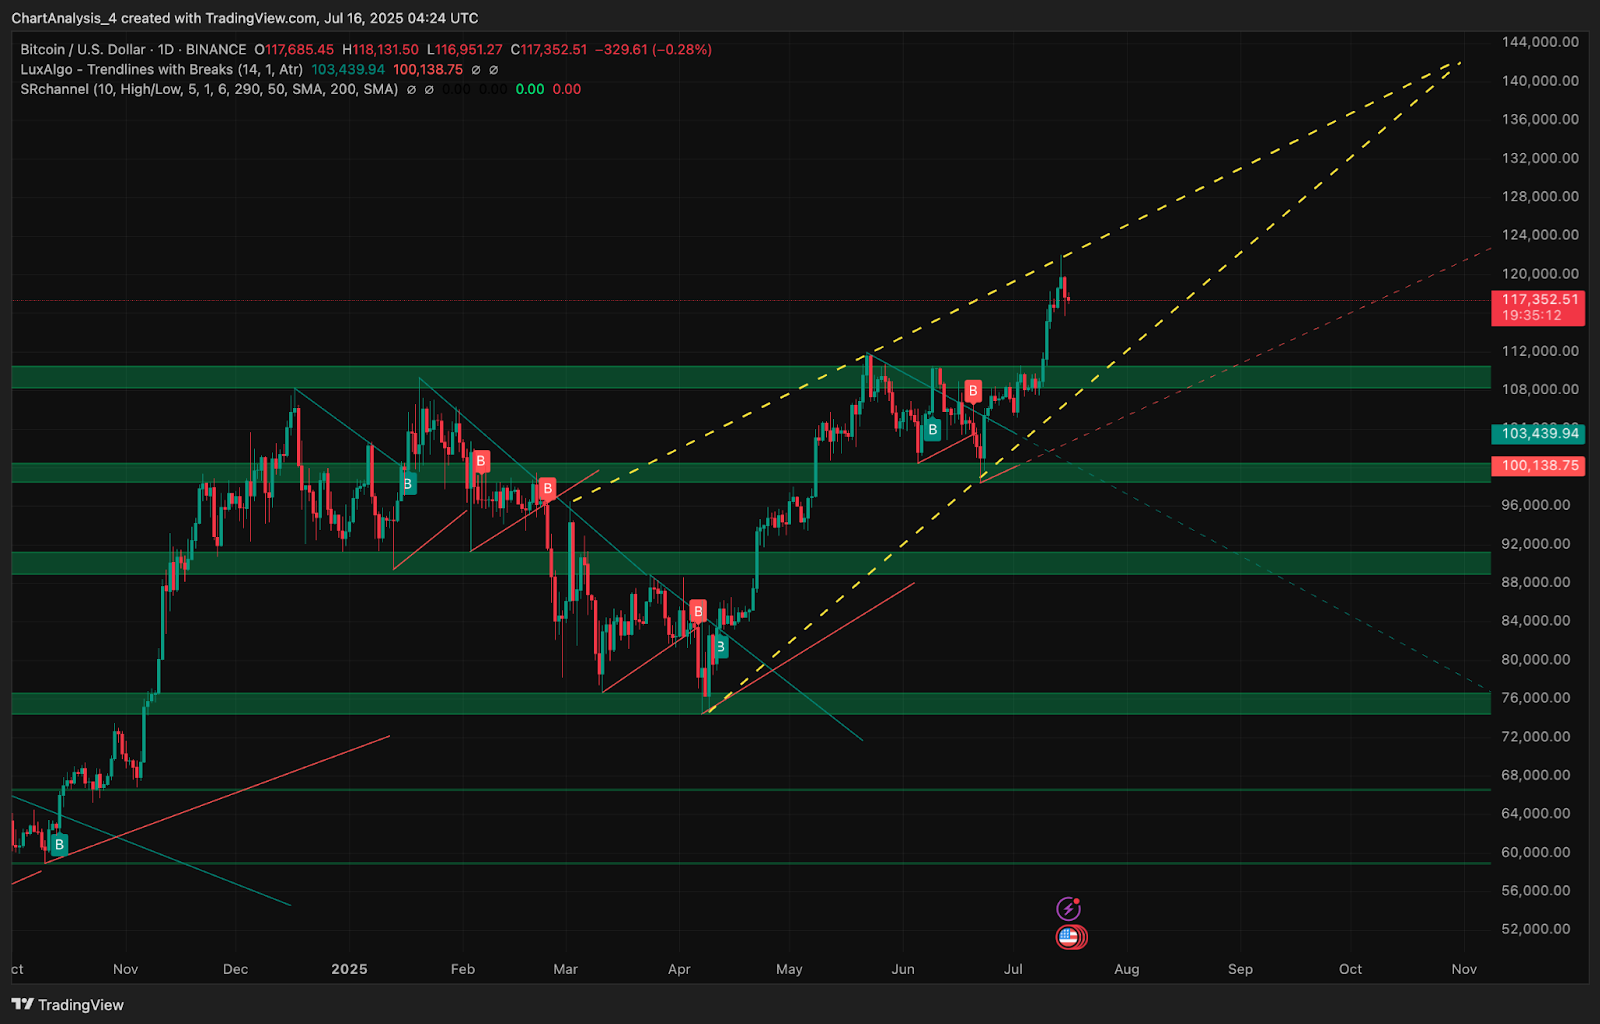
The daily chart shows BTC rejecting from the upper boundary of a long-term rising wedge, with the latest candle forming a potential top wick near $122,000. This zone coincides with the resistance formed by the wedge’s upper trendline and marks a third failed attempt to close above the $121,500–$122,500 band.
The 4-hour chart shows price now pulling back toward the EMA cluster support. The 20 and 50 EMAs are near $117,496 and $115,454 respectively. Candles are forming with lower highs and lower closes after the breakdown from the upper Bollinger Band, which is now flattening. Bitcoin price action has entered a typical volatility squeeze zone.
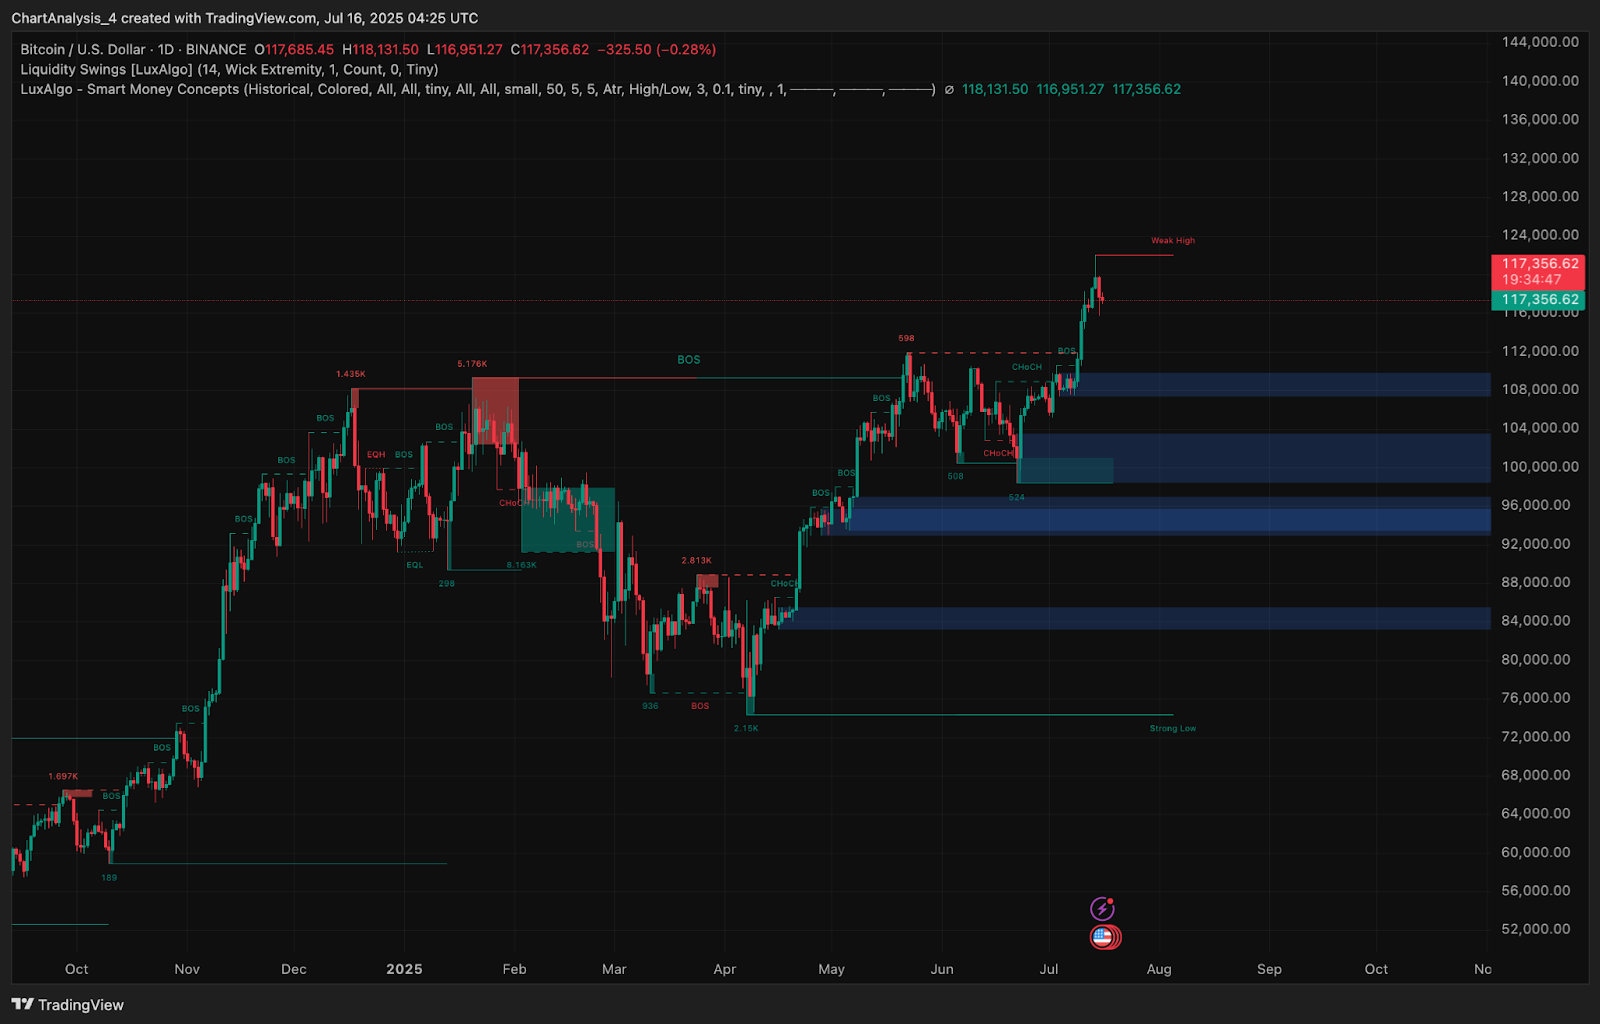
On the Smart Money Concepts chart, BTC has printed a new CHoCH (Change of Character) around $117K after breaking prior structure. This hints at a near-term shift in trend bias unless reclaimed swiftly.
Why Is The Bitcoin Price Going Down Today?
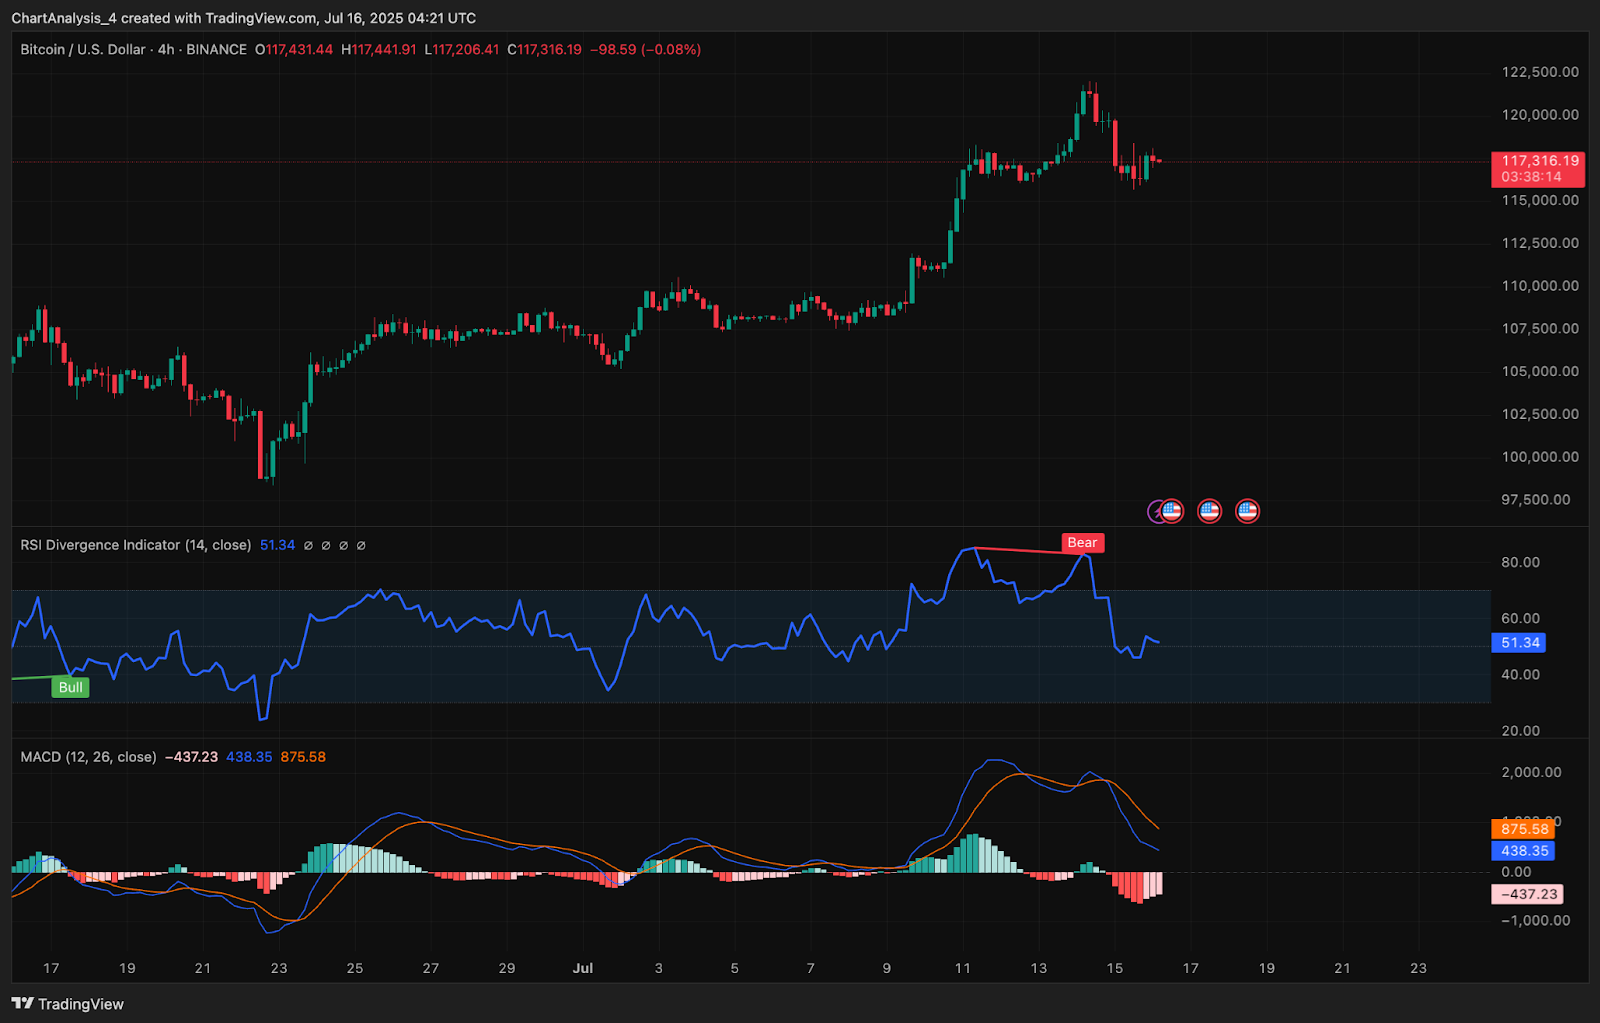
The short-term correction in Bitcoin price today is driven by both divergence and derivatives positioning. The RSI on the 4-hour chart flashed a bearish divergence at the $122K top, confirming a weakening in buying strength even as price hit a new high. RSI is now at 51.34, nearing neutral territory.
MACD has also flipped bearish, with histogram bars turning red and the MACD line crossing below the signal line. These confirm the short-term loss of bullish momentum.
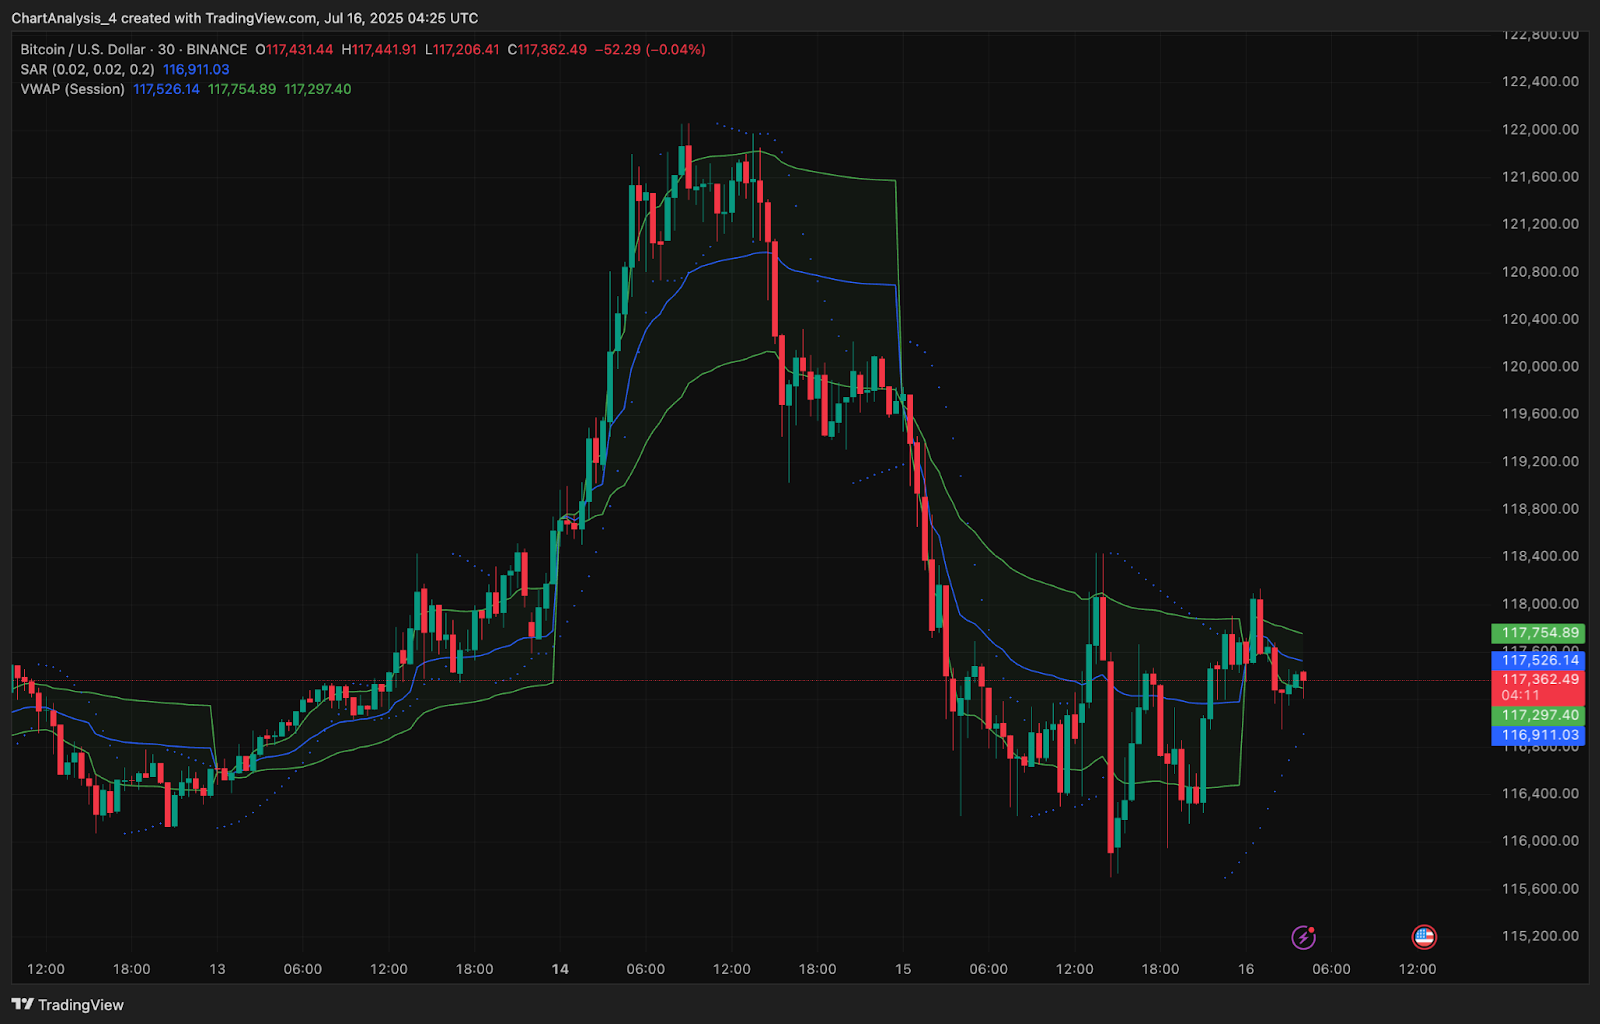
The Parabolic SAR and VWAP indicators on the 30-minute chart show BTC trading below the session VWAP ($117,297) and SAR resistance dots printing above candles, signaling intraday downward pressure. A sustained rejection from the $117,500 VWAP zone could open the door to further downside probing.
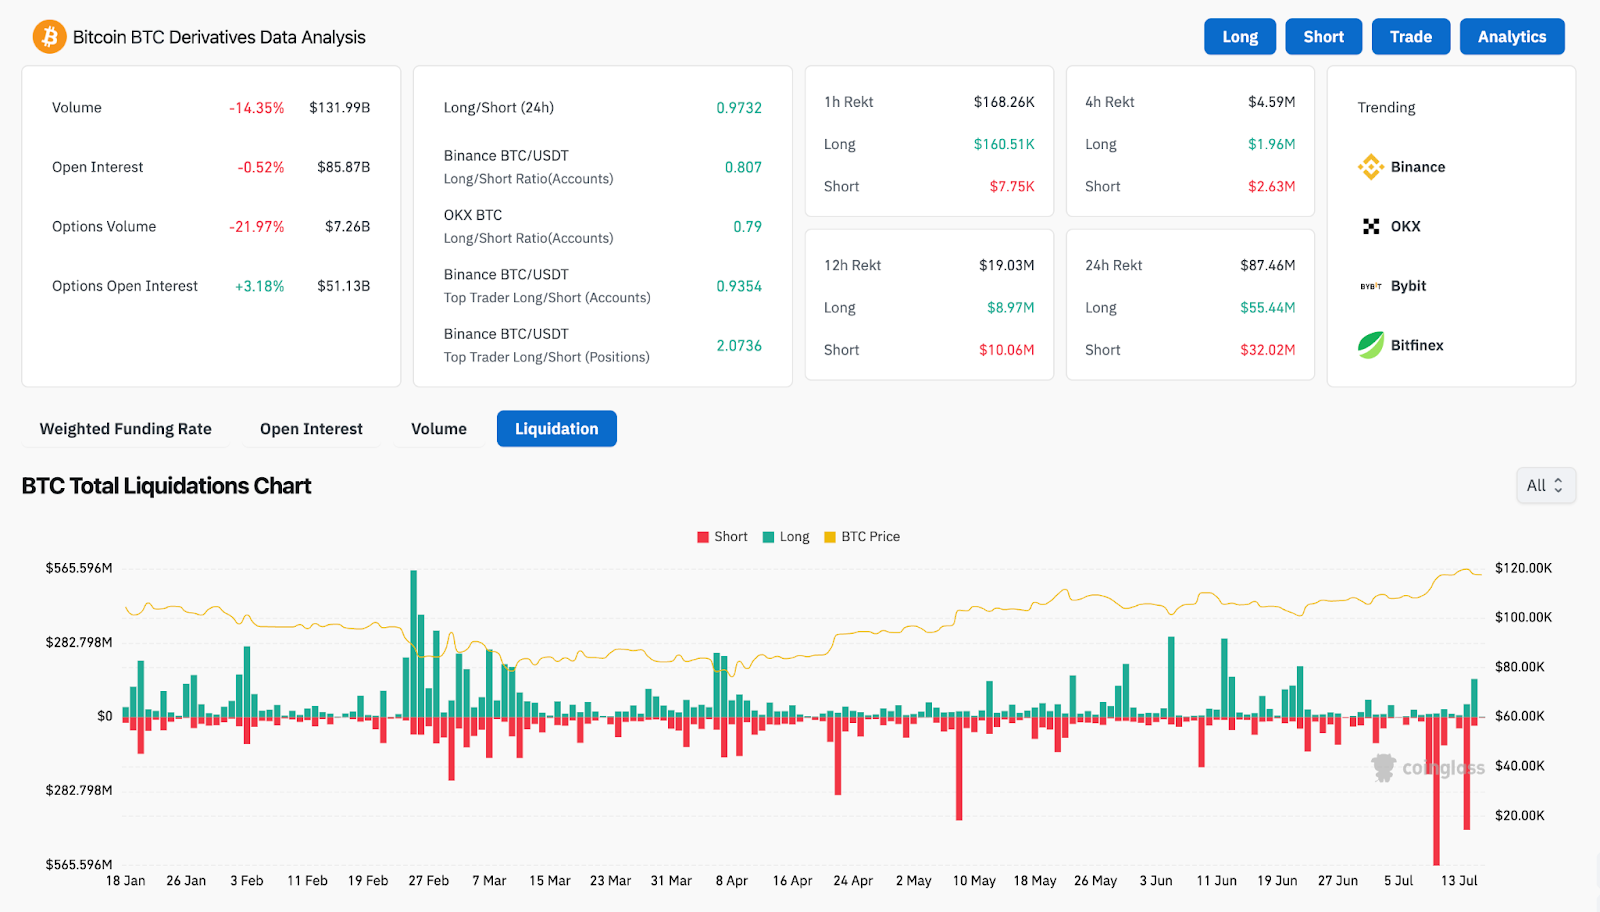
Meanwhile, derivatives data reveals cooling sentiment. According to CoinGlass, total BTC options volume dropped 21.97%, and open interest declined slightly by 0.52% over the past 24 hours. The long/short ratio across major platforms like Binance and OKX is skewed slightly in favor of longs, but the imbalance is shrinking.
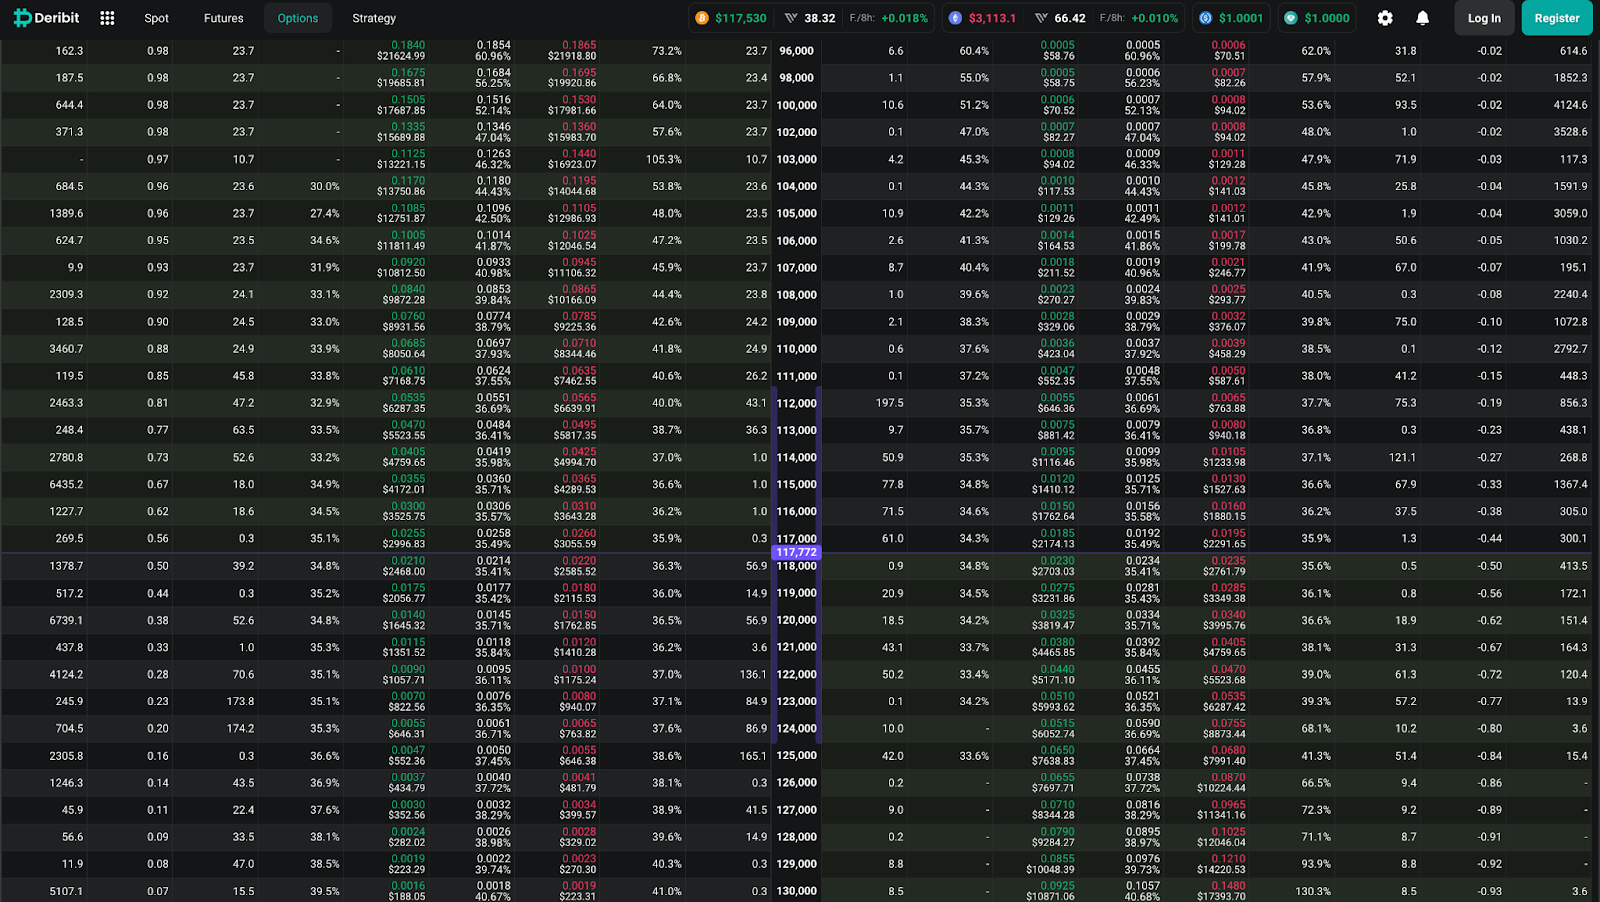
Options data for July 25 expiry shows large interest at the $117,000 and $118,000 strikes, suggesting potential magnet zones.
Price Indicators Show Squeeze Setup and EMA Retest
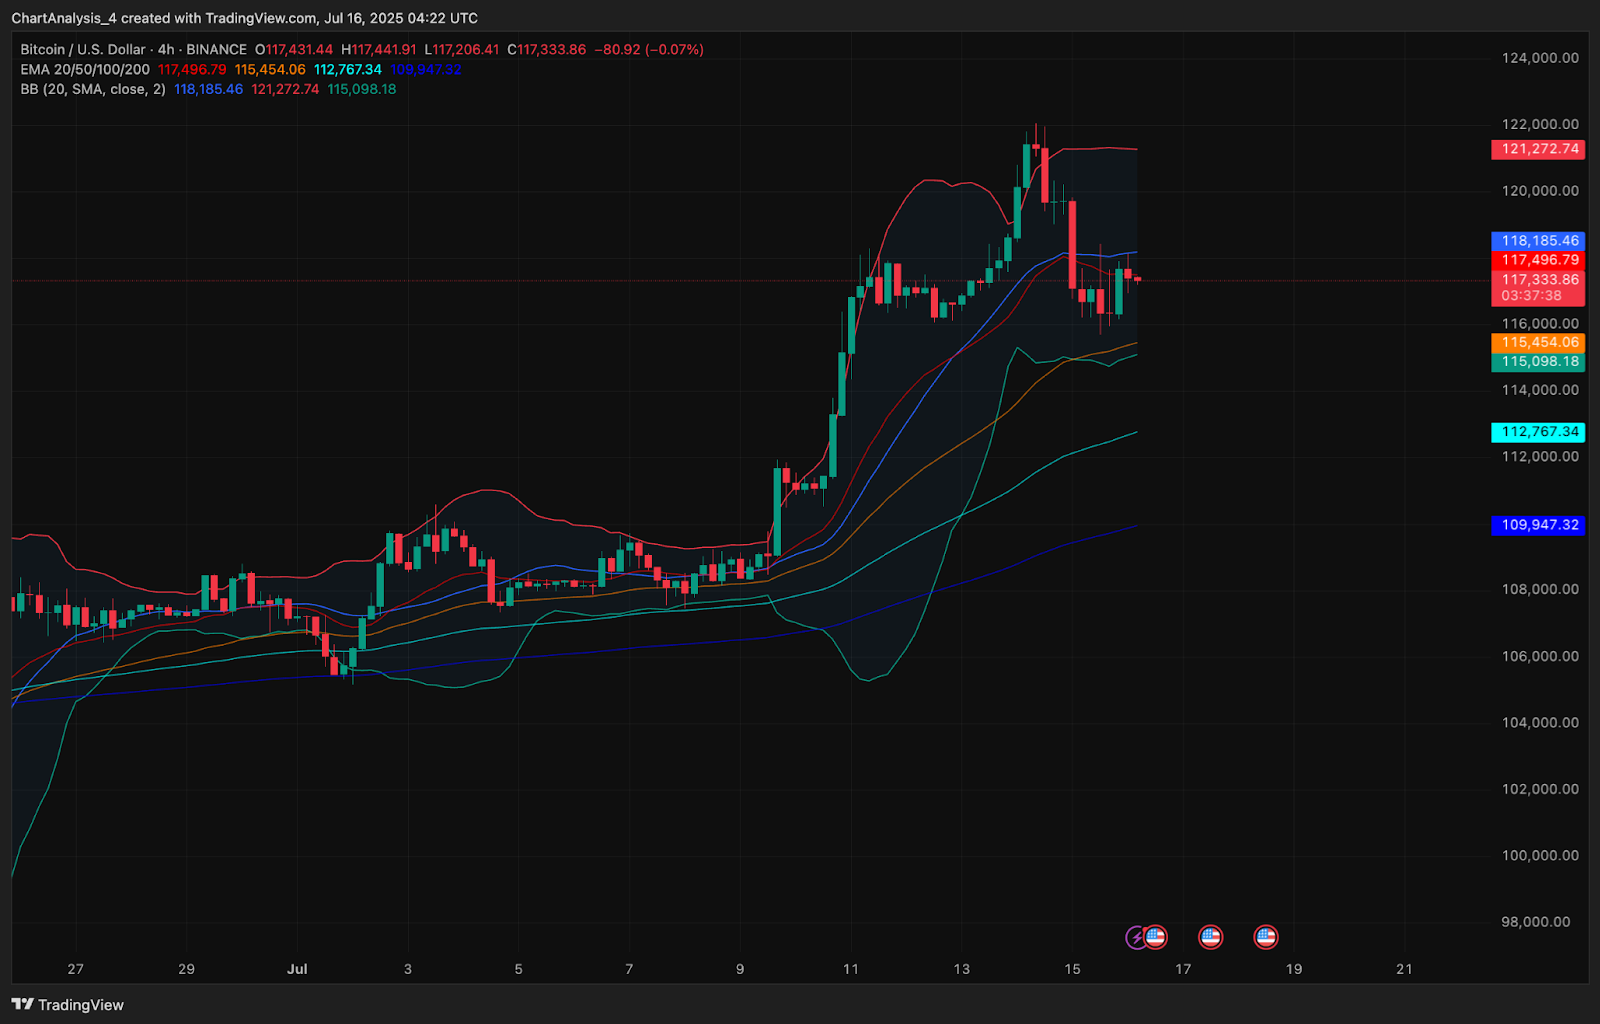
Bollinger Bands on the 4-hour chart have begun compressing after a breakout attempt failed. BTC is now caught between the mid-band ($118,185) and the lower band near $115,098. This narrowing setup increases the odds of a volatility expansion soon.
The EMAs (20/50/100/200) show an ongoing bullish alignment, with price still above the 100 EMA ($112,767) and 200 EMA ($109,947). However, candles are testing the 20 EMA from below, indicating a weakening trend. A failure to hold this area would expose the $114,000–$115,000 zone next.
From a structural perspective, the rising wedge remains intact, but a daily close below $115,000 would threaten the pattern and shift bias to neutral.
BTC Price Prediction: Short-Term Outlook (24H)
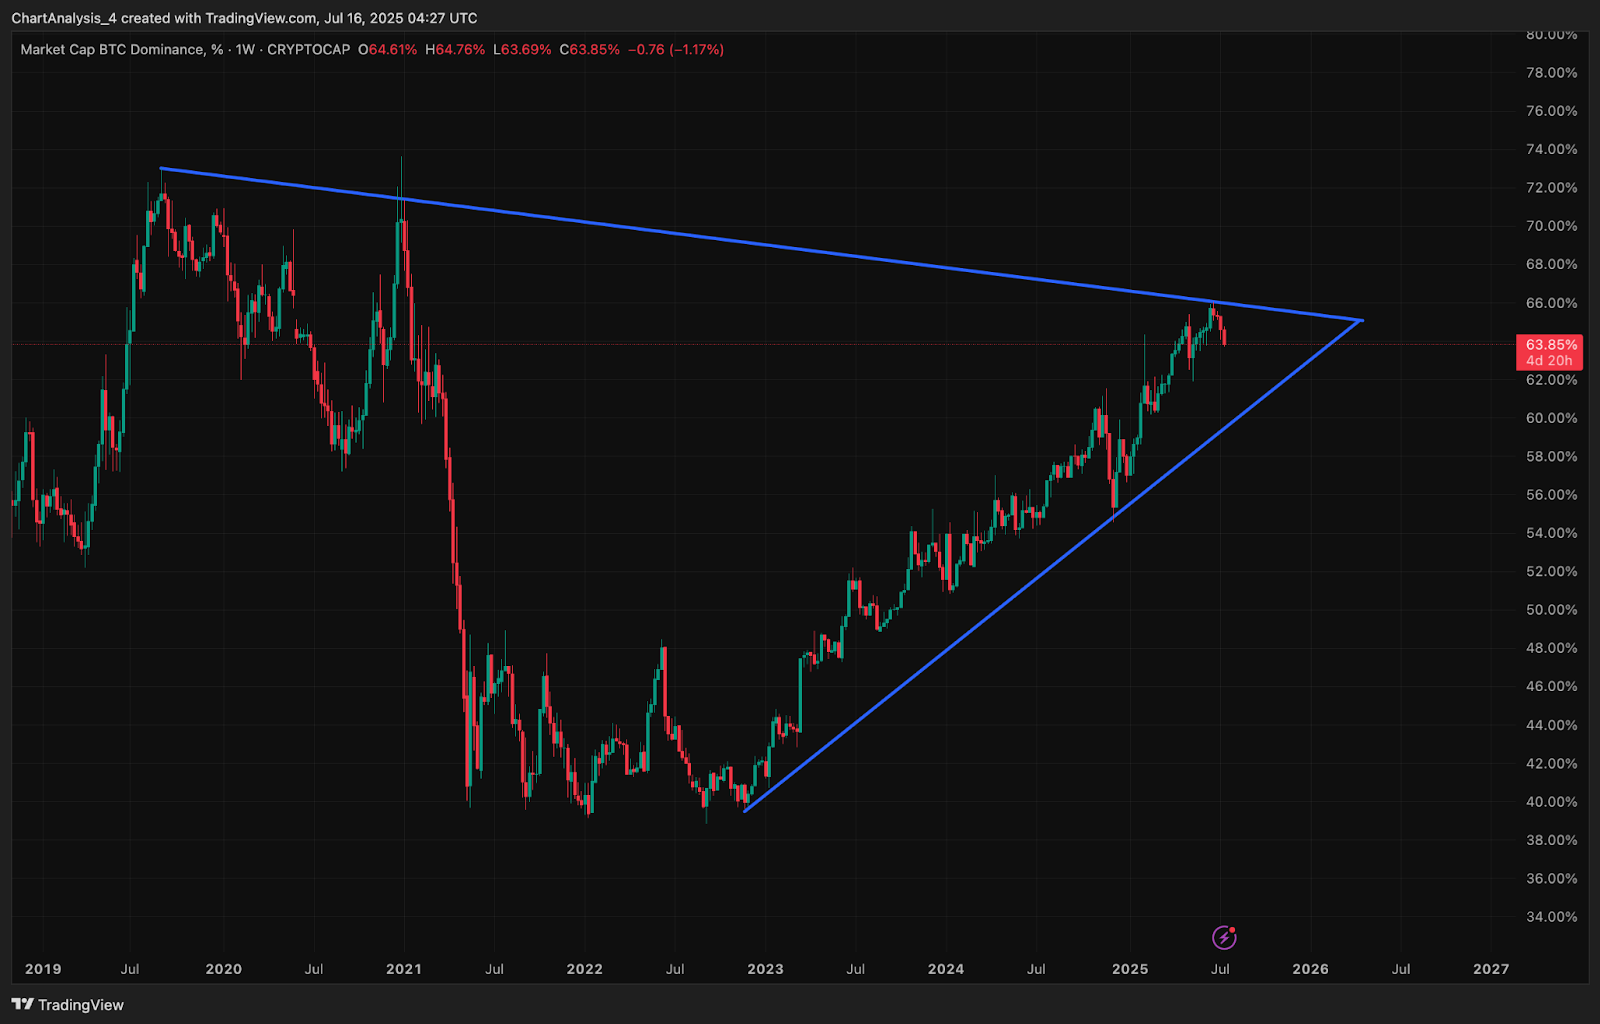
Bitcoin dominance is pulling back from 64% after tagging the apex of a multi-year triangle. The rejection suggests short-term capital rotation into altcoins. As long as dominance holds above 61.5%, BTC remains structurally strong. A breakout above 66.5% would confirm long-term Bitcoin market leadership.
For July 17, Bitcoin price is likely to remain range-bound between $115,000 and $118,500 unless a breakout or breakdown is confirmed with volume.
If BTC breaks back above the $118,200 Bollinger mid-band with confirmation, the next resistance lies at $120,500 followed by $122,000. However, failure to reclaim VWAP and 20 EMA could invite a retest of $114,800–$115,000. A breakdown from there risks triggering a drop toward $112,500 and even the $110,000–$109,000 demand block.
With MACD and RSI showing cooling bias, and options OI concentration forming near $117K, BTC remains in a volatile holding pattern. Traders should watch volume behavior around the $116,800–$117,500 zone for the next decisive move.
Disclaimer: The information presented in this article is for informational and educational purposes only. The article does not constitute financial advice or advice of any kind. Coin Edition is not responsible for any losses incurred as a result of the utilization of content, products, or services mentioned. Readers are advised to exercise caution before taking any action related to the company.


