 Price Prediction for July 22")
After consolidating in a narrowing structure for the past week, the Bitcoin price today is hovering near $118,400, attempting to break free from a multi-day compression zone. Price action remains pinned between ascending support and a descending trendline, keeping volatility tight but suggesting an imminent breakout. The short-term structure is coiled, with bulls trying to capitalize on the recent bid recovery from the $116,000 zone.
What’s Happening With Bitcoin’s Price?
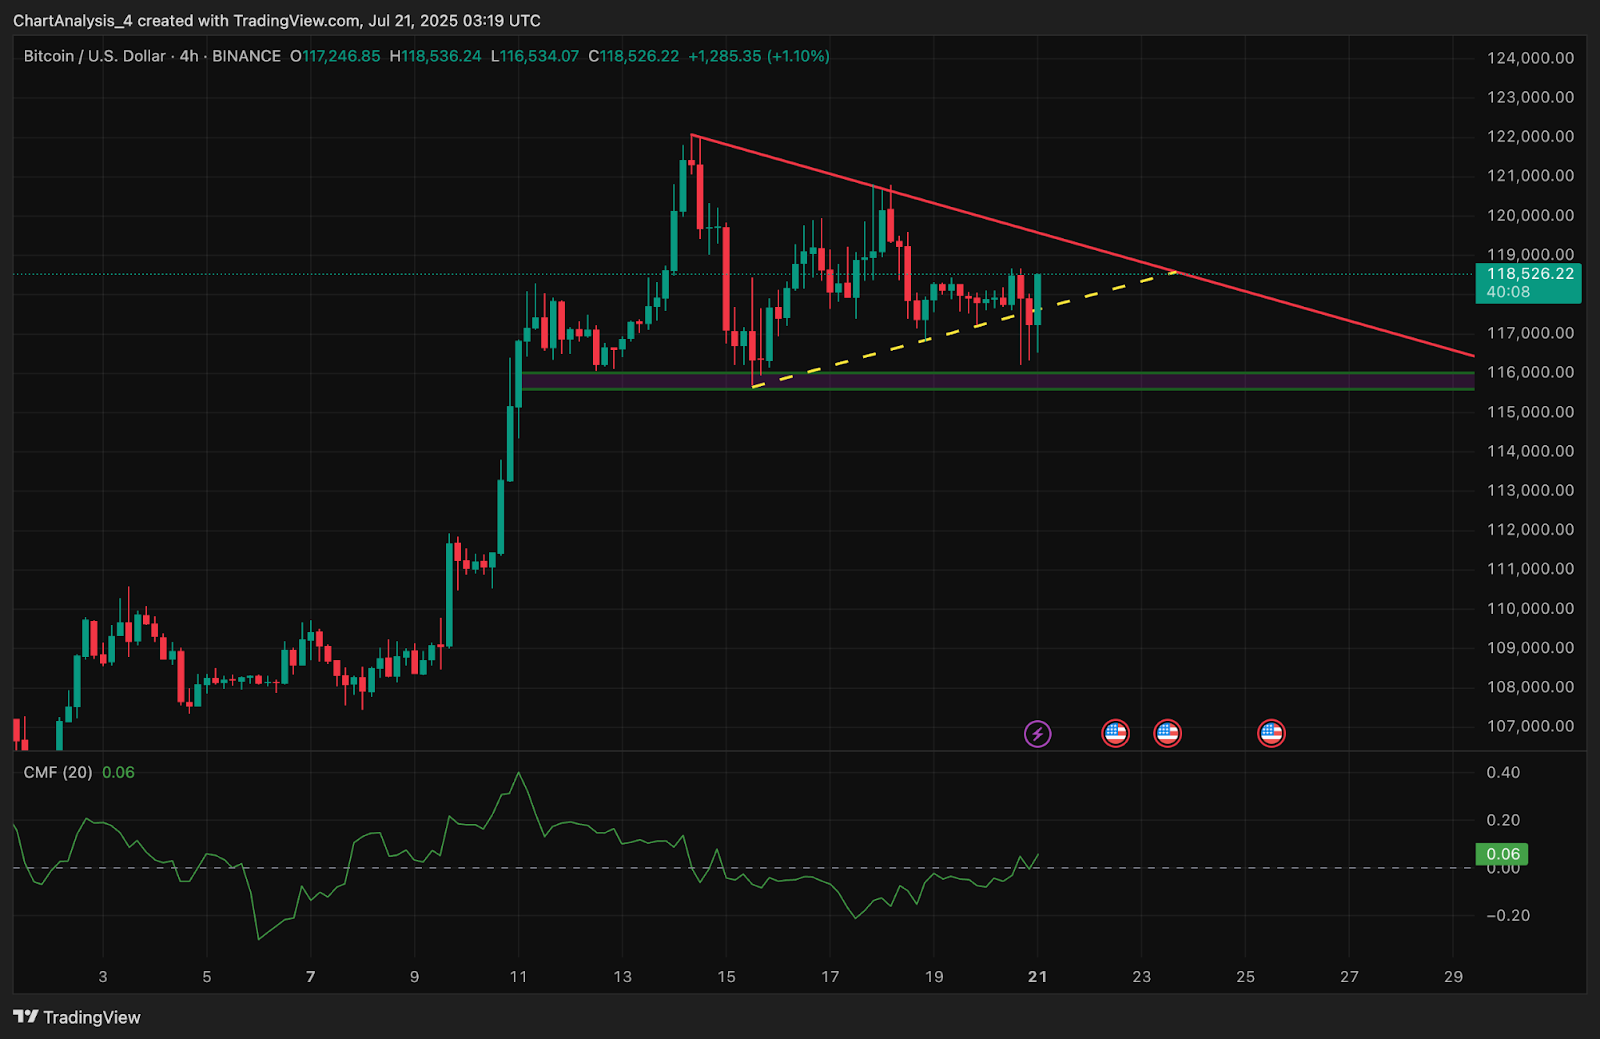
Bitcoin is currently locked inside a symmetrical triangle pattern on the 4-hour chart, with resistance at $119,000 and support around $116,000. The consolidation structure follows a vertical move that sent Bitcoin price soaring from $101,000 earlier this month. This wedge is compressing volatility further, indicating that a decisive move may unfold in the next 24–48 hours.
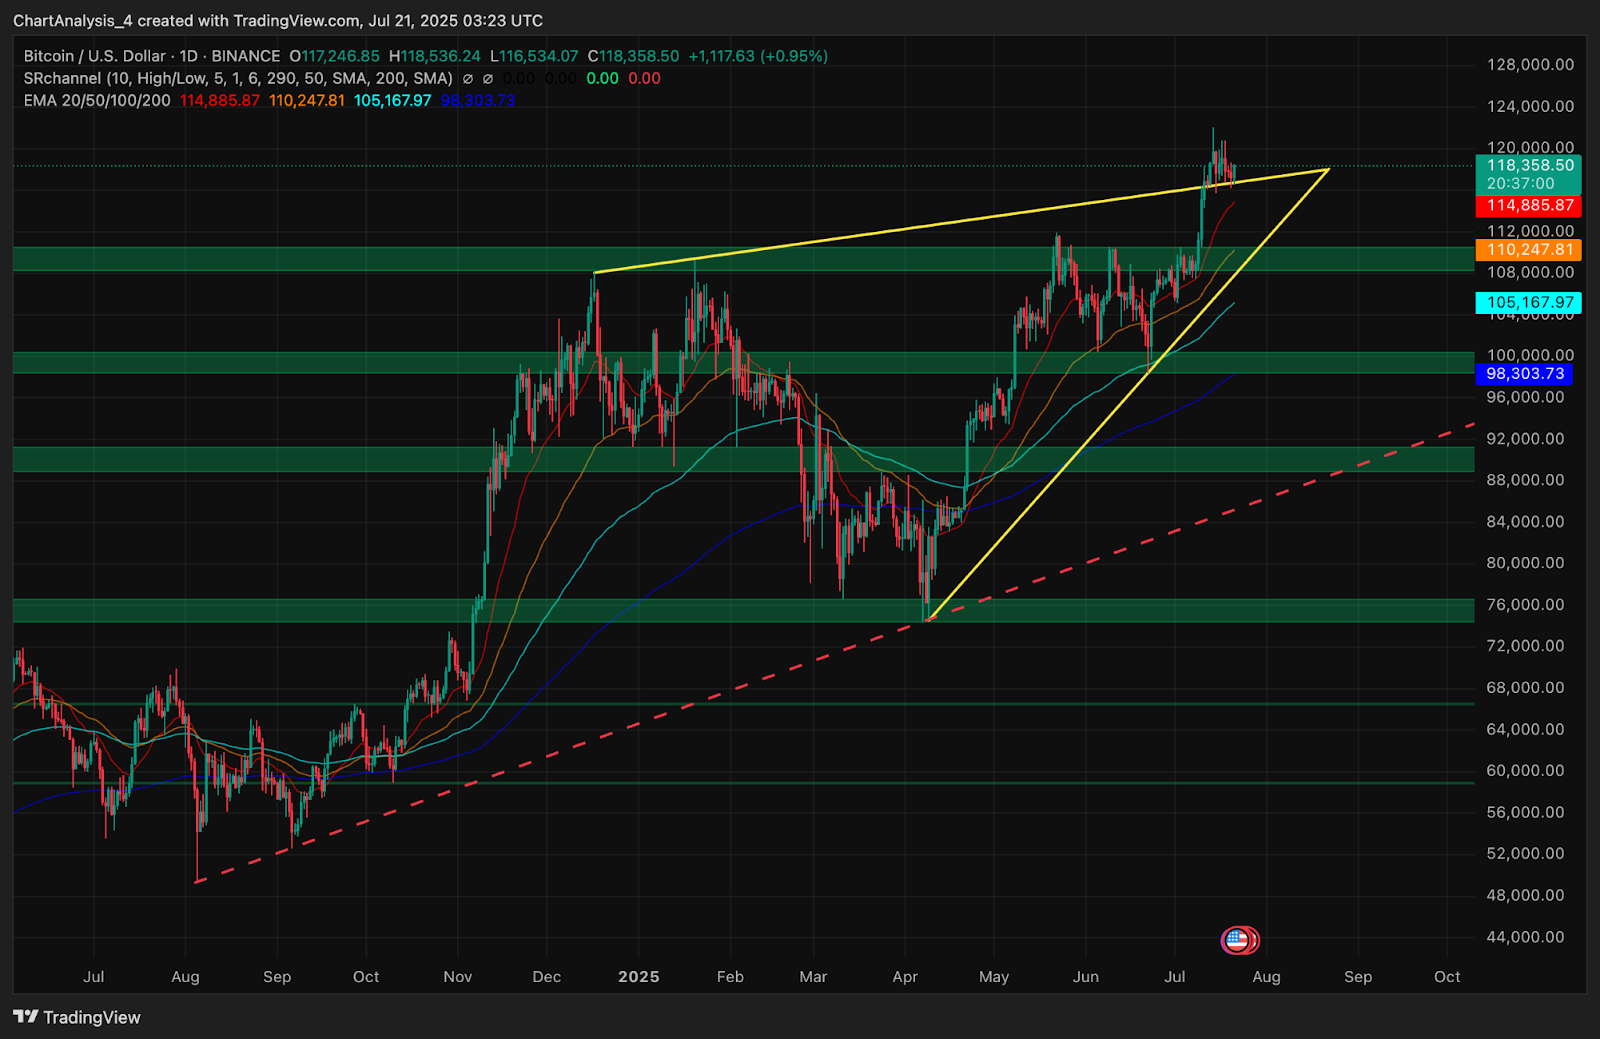
The daily chart shows price still hovering near the upper edge of a rising wedge formation that began forming in March. Despite a brief pullback, BTC has held above its EMA 50 and EMA 100, which currently sit near $110,200 and $105,100 respectively. The breakout structure remains intact as long as Bitcoin stays above $114,800.
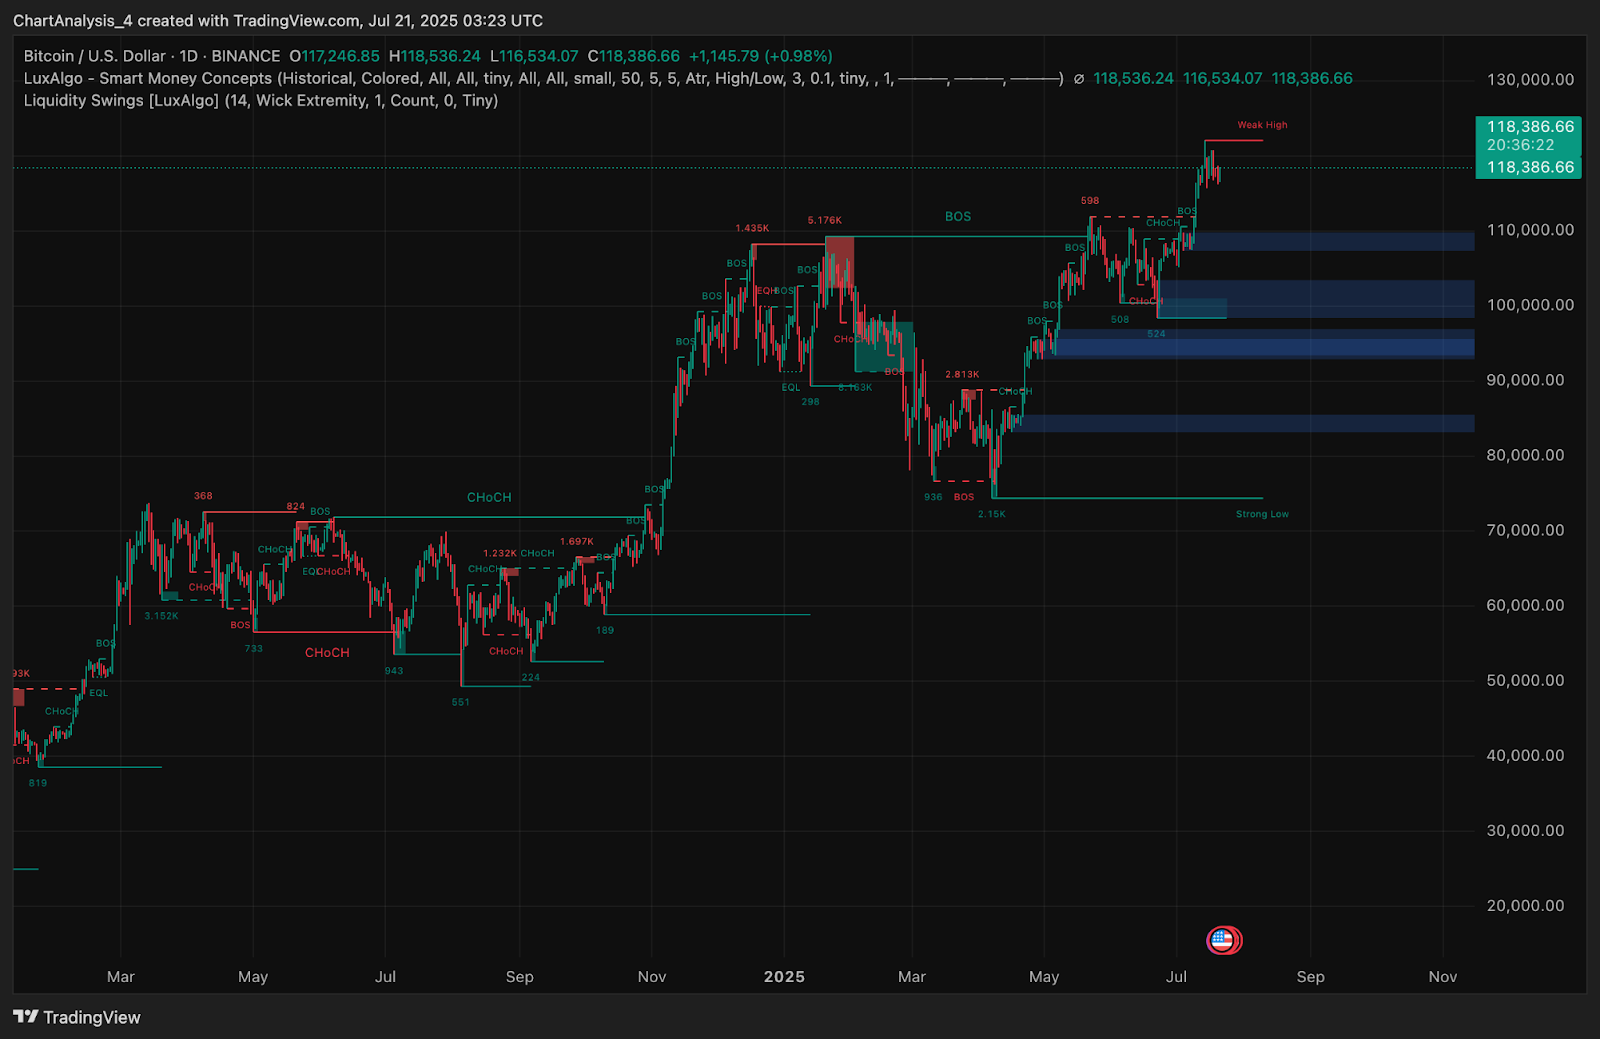
Smart Money Concepts (SMC) show that Bitcoin is trading just below a marked weak high at $119,000. A Break of Structure (BOS) to the upside earlier in July confirmed bullish intent, but price has since stalled under this key liquidity area. Until a new BOS occurs, price remains at risk of consolidation within the current zone.
Why Is The Bitcoin Price Going Up Today?
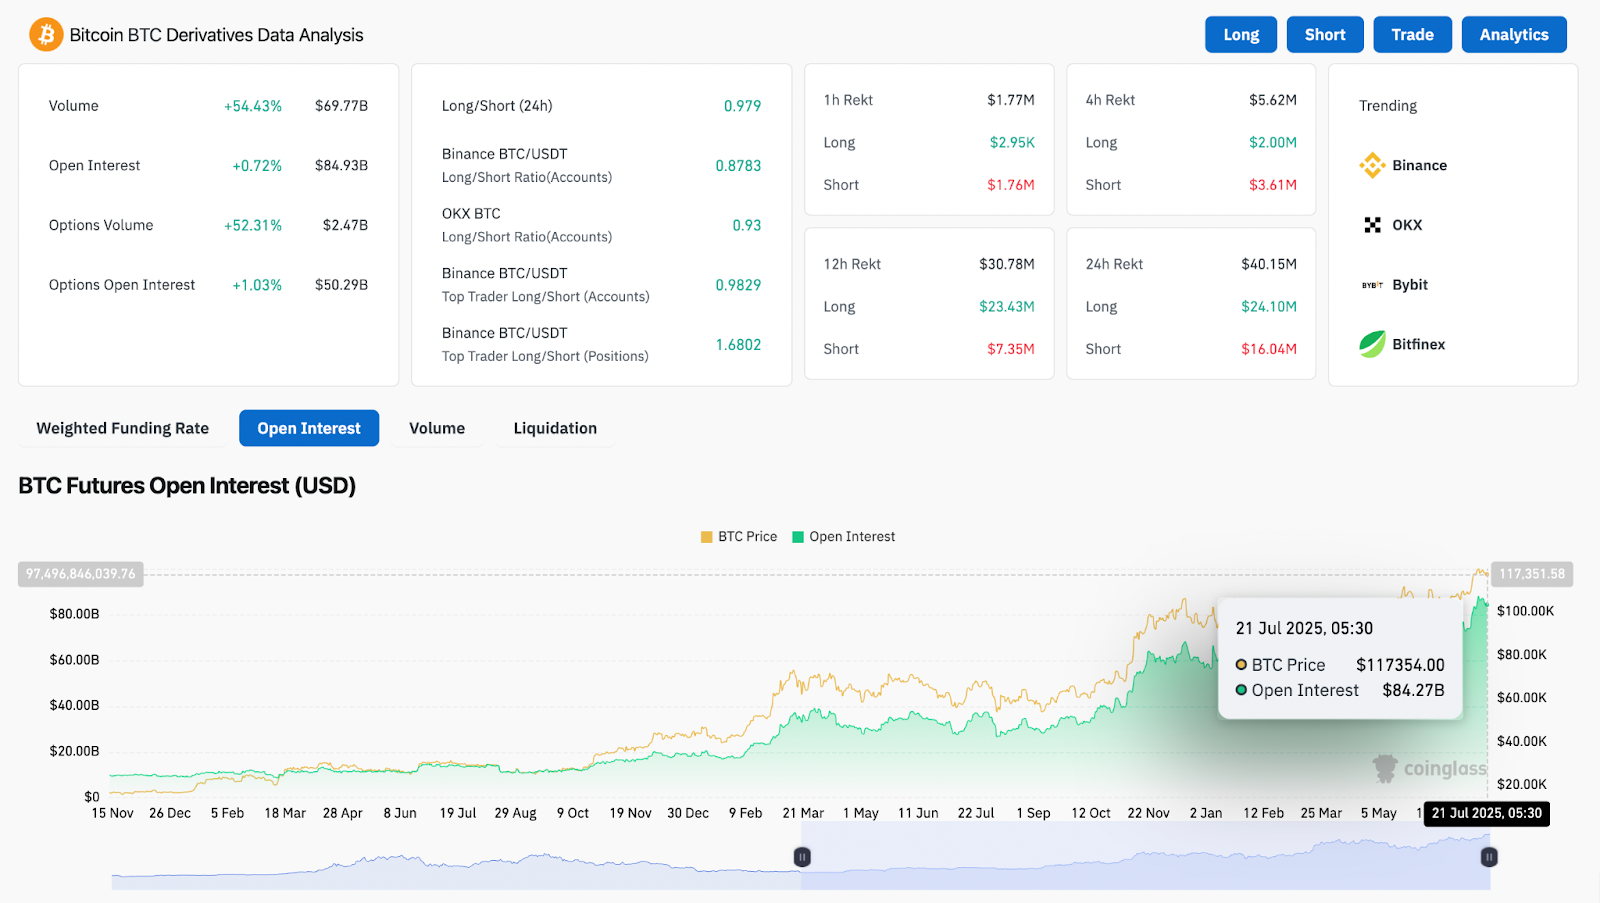
Why Bitcoin price going up today can be explained by renewed demand in the derivatives market and intraday liquidity reclamation. According to Coinglass, Bitcoin open interest has risen to $84.27B, while daily futures volume jumped 54.43% to $69.77B. The long/short ratio for top Binance traders sits at 1.68, showing a clear long-heavy bias.
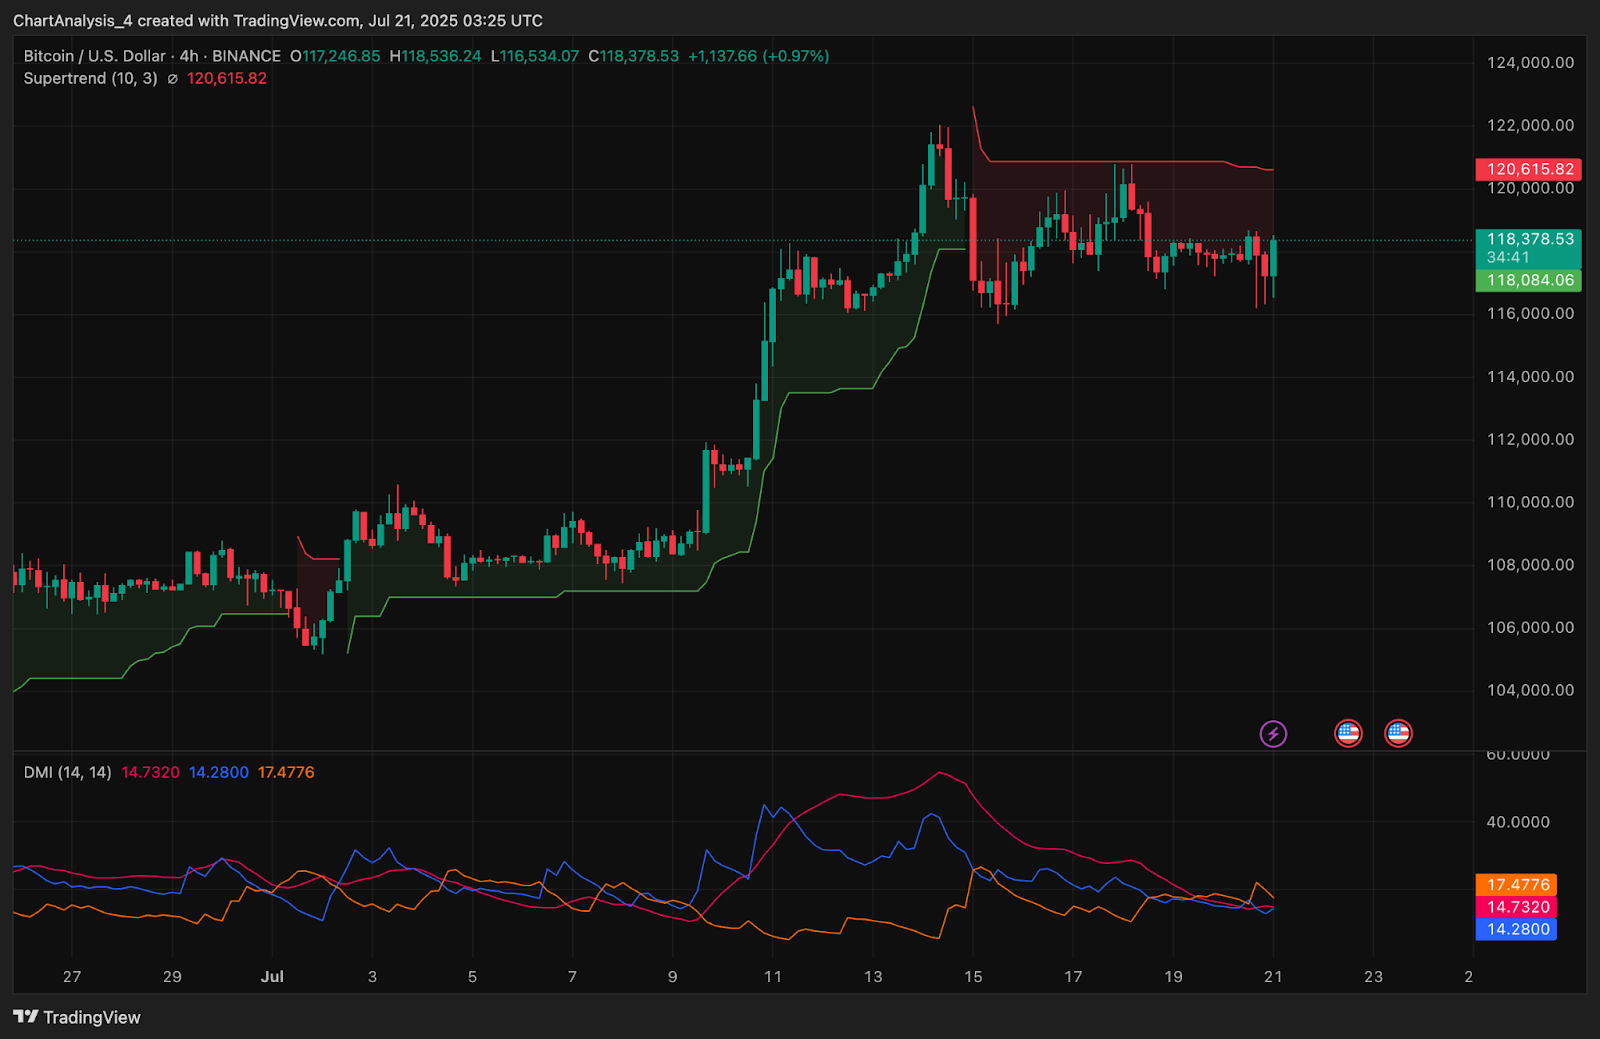
On-chain liquidity sweeps and derivatives sentiment are favoring the bulls. The Supertrend indicator on the 4-hour timeframe remains bullish above $118,000, and a potential flip above $120,600 could initiate a trend continuation. The 4-hour DMI shows a declining trend, but +DI and -DI remain near convergence, which is typical before trend expansion.
Compression Pattern and EMAs Signal Breakout Risk
The Bollinger Bands and EMAs show compression, which often precedes strong directional moves. On the daily chart, all four key exponential moving averages (20/50/100/200) are stacked below price, with the 200 EMA near $98,300 offering strong structural support.
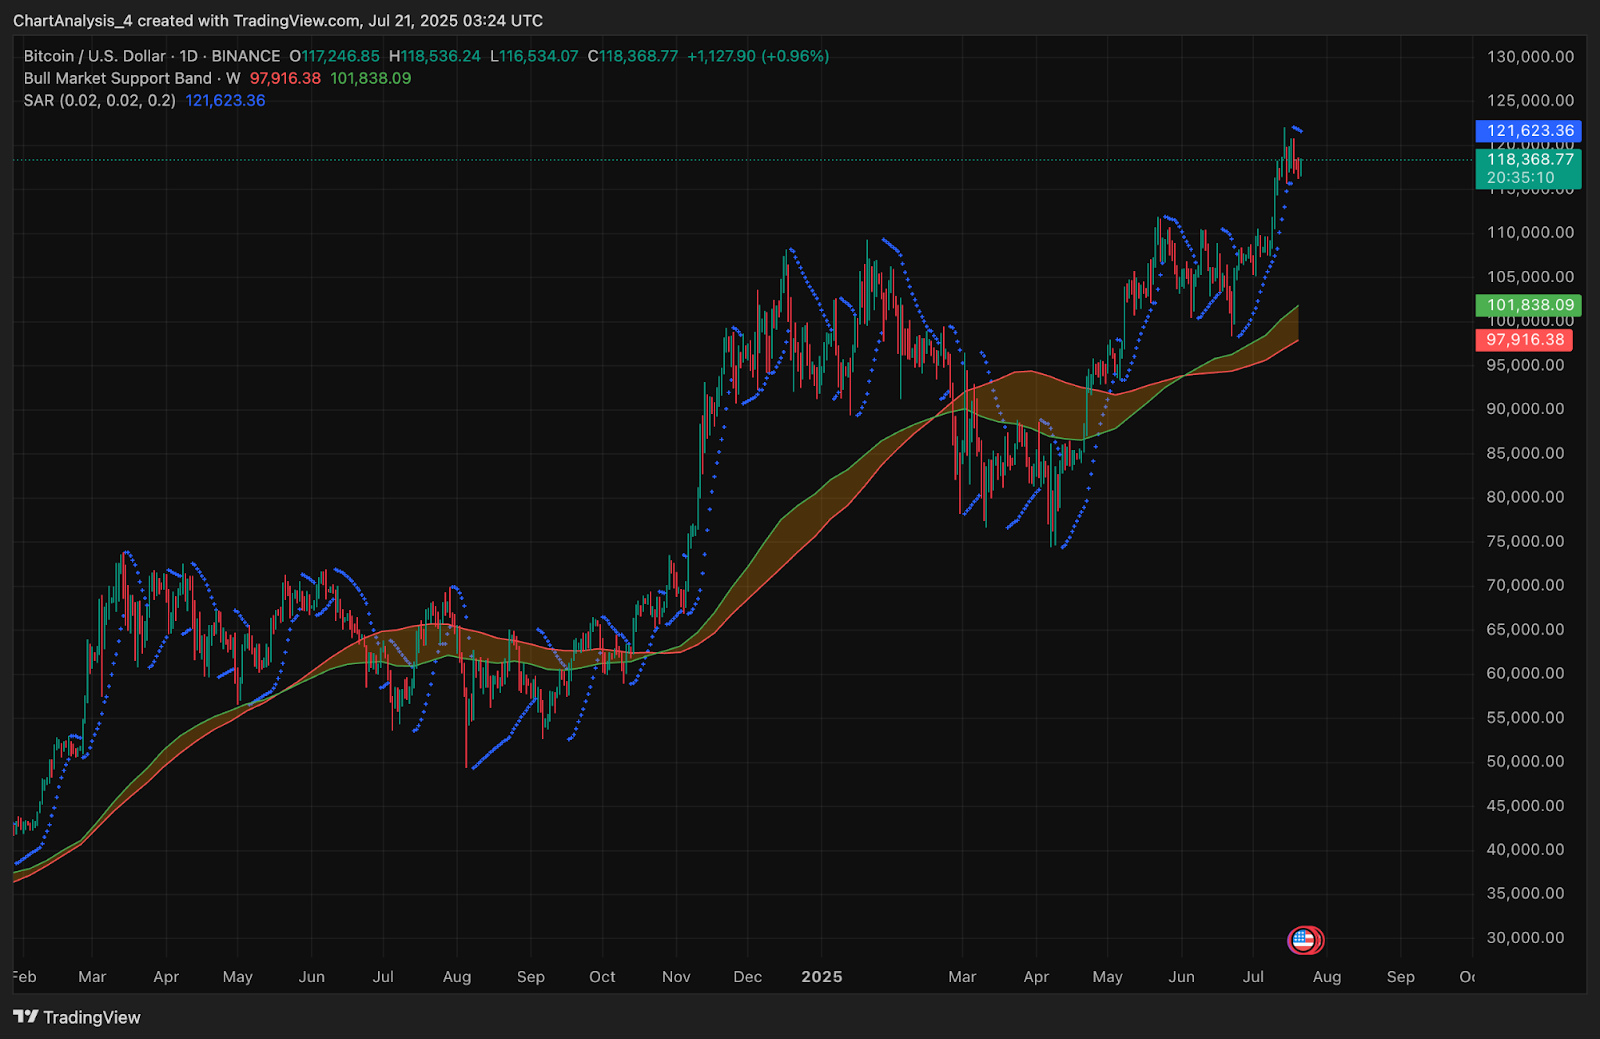
Meanwhile, Bitcoin continues to trade above the Bull Market Support Band on the weekly timeframe, which has now climbed toward the $100,000–$101,800 zone. The Parabolic SAR also sits below price on the daily chart, suggesting that the bullish momentum is still valid despite minor profit-taking.
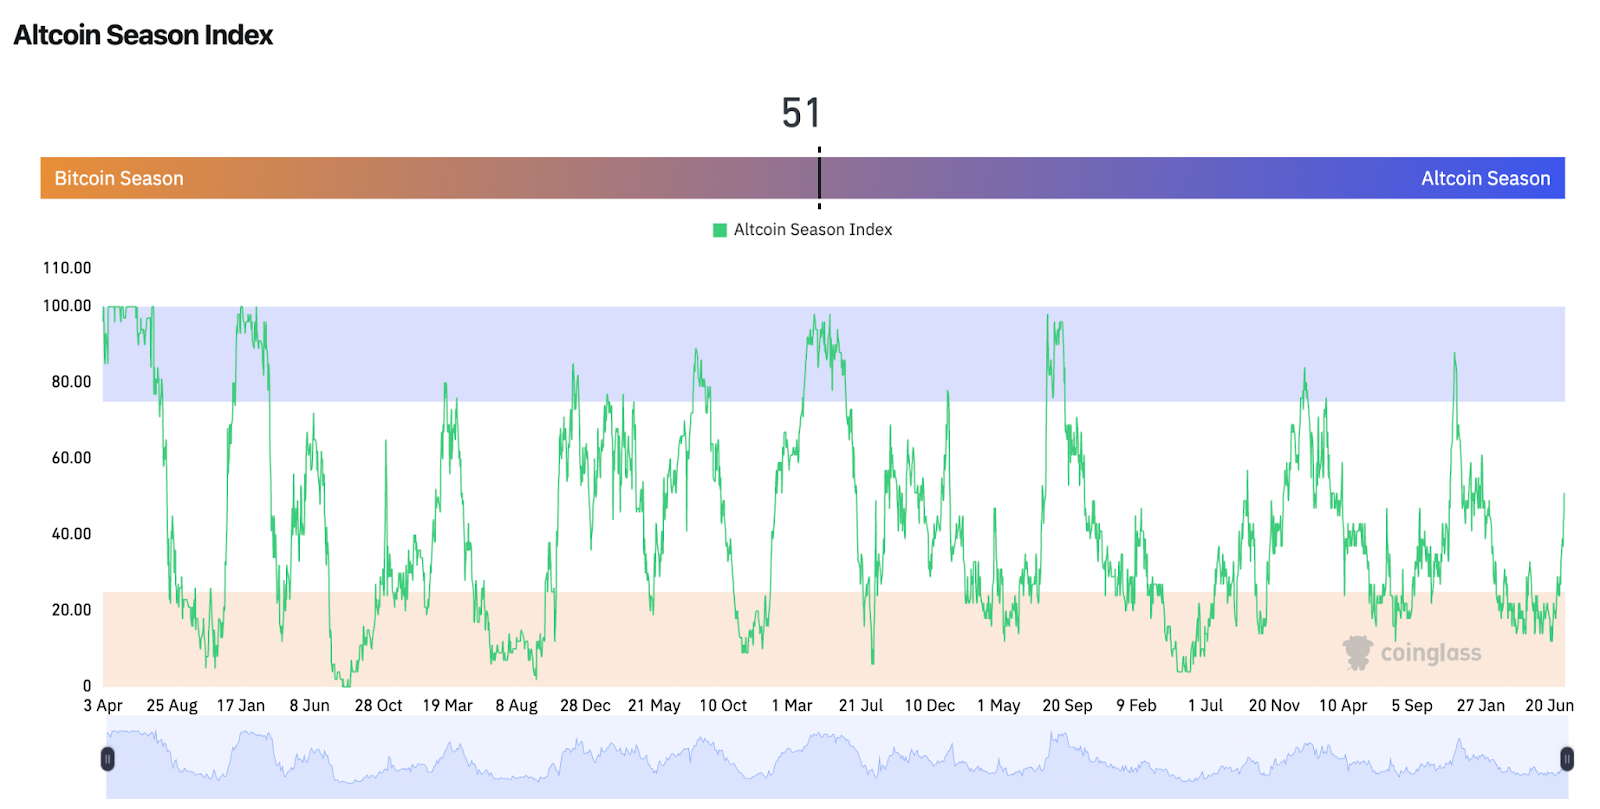
Altcoin Season Index reads 51, showing a near-equal rotation between BTC and altcoins which is a neutral condition that often precedes capital redistributions into leading assets. If Bitcoin breaks above the $119,000 zone with volume support, dominance could once again shift back in its favor.
BTC Price Prediction: Short-Term Outlook (24H)
The short-term outlook hinges on a clean break from the symmetrical triangle. If bulls reclaim the $119,000–$120,600 resistance zone with confirmation, price could rally toward $122,000 and $124,500 next. On the downside, if Bitcoin fails to sustain above $116,000, a deeper retest of $114,800 or even $112,000 remains likely, especially if volume thins out.
Given the tightening wedge, Supertrend support, and rising CMF, Bitcoin appears primed for volatility expansion. Traders should closely monitor price reaction at the $118,800–$119,000 band and volume flow on the breakout attempt.
Bitcoin Price Forecast Table: July 22, 2025
| Indicator/Zone | Level / Signal |
| Bitcoin price today | $118,400 |
| Resistance 1 | $119,000 (Wedge Breakout Level) |
| Resistance 2 | $122,000 |
| Support 1 | $116,000 |
| Support 2 | $114,800 |
| EMA Cluster (D1) | Bullishly stacked |
| CMF (4H) | +0.06 (Positive Inflow) |
| Supertrend (4H) | Bullish above $118,000 |
| Parabolic SAR (D1) | Below price, supporting trend |
| DMI (4H) | Flat, pre-breakout convergence |
| Open Interest (BTC Futures) | $84.27B (+0.72%) |
| Altcoin Season Index | 51 (Neutral, BTC/Alt rotation) |
Disclaimer: The information presented in this article is for informational and educational purposes only. The article does not constitute financial advice or advice of any kind. Coin Edition is not responsible for any losses incurred as a result of the utilization of content, products, or services mentioned. Readers are advised to exercise caution before taking any action related to the company.
 Price Prediction for April 2026: Will Chainlink Move Higher?")
 Price Prediction: Can Bulls Sustain the $0.045 Push?")


