 Price Prediction for July 23")
After an early-week bounce toward $118,000, Bitcoin price is back under pressure as sellers reclaim control near the upper bounds of a multi-week range. Bitcoin price today is trading around $116,900, down by 0.5% on the day, struggling to hold higher within a visible descending channel on intraday charts. Traders are watching for signs of volatility expansion as price coils just above key demand.
What’s Happening With Bitcoin’s Price?
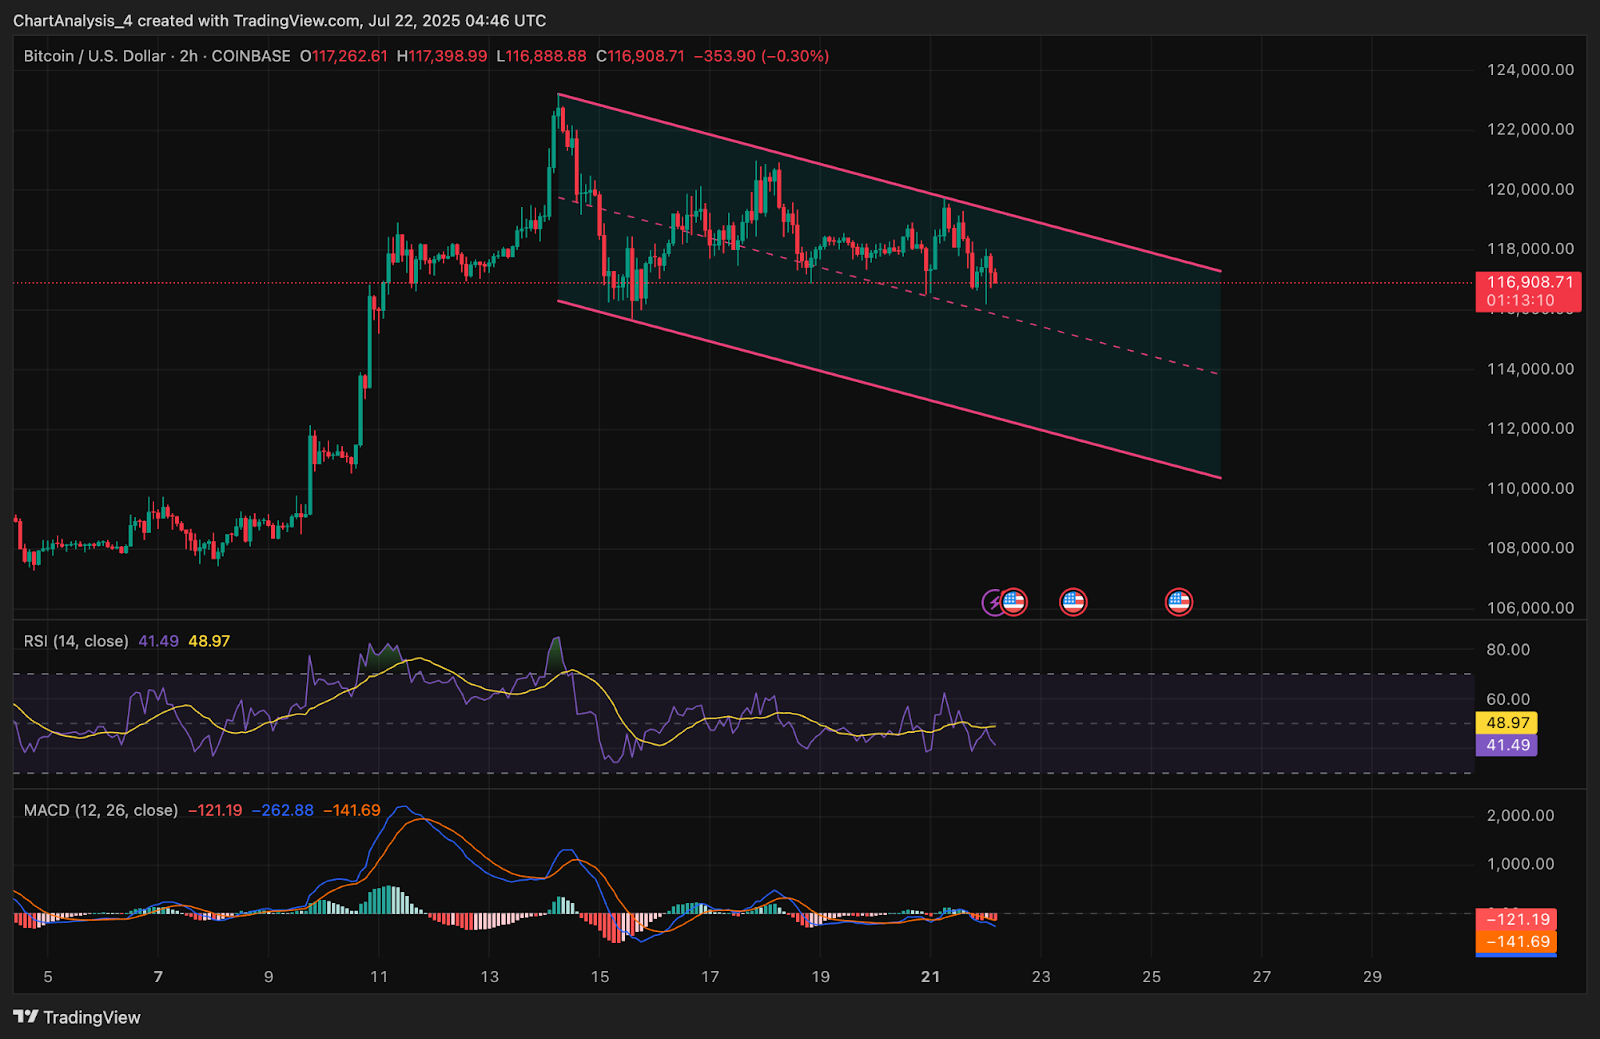
BTC price continues to respect the bounds of a descending parallel channel visible on the 2-hour chart, with clear lower highs and lower lows since the $123,000 rejection earlier in July. This structure is compressing price into a narrowing band, with support near $115,500 and resistance stacked around $118,000.
RSI on the 2-hour chart is sitting at 41.49, reflecting fading bullish momentum. The MACD histogram remains flat with a minor bearish crossover, suggesting further indecision in the short term. Price remains trapped inside the midline of the descending channel, highlighting a lack of aggressive trend follow-through by bulls.
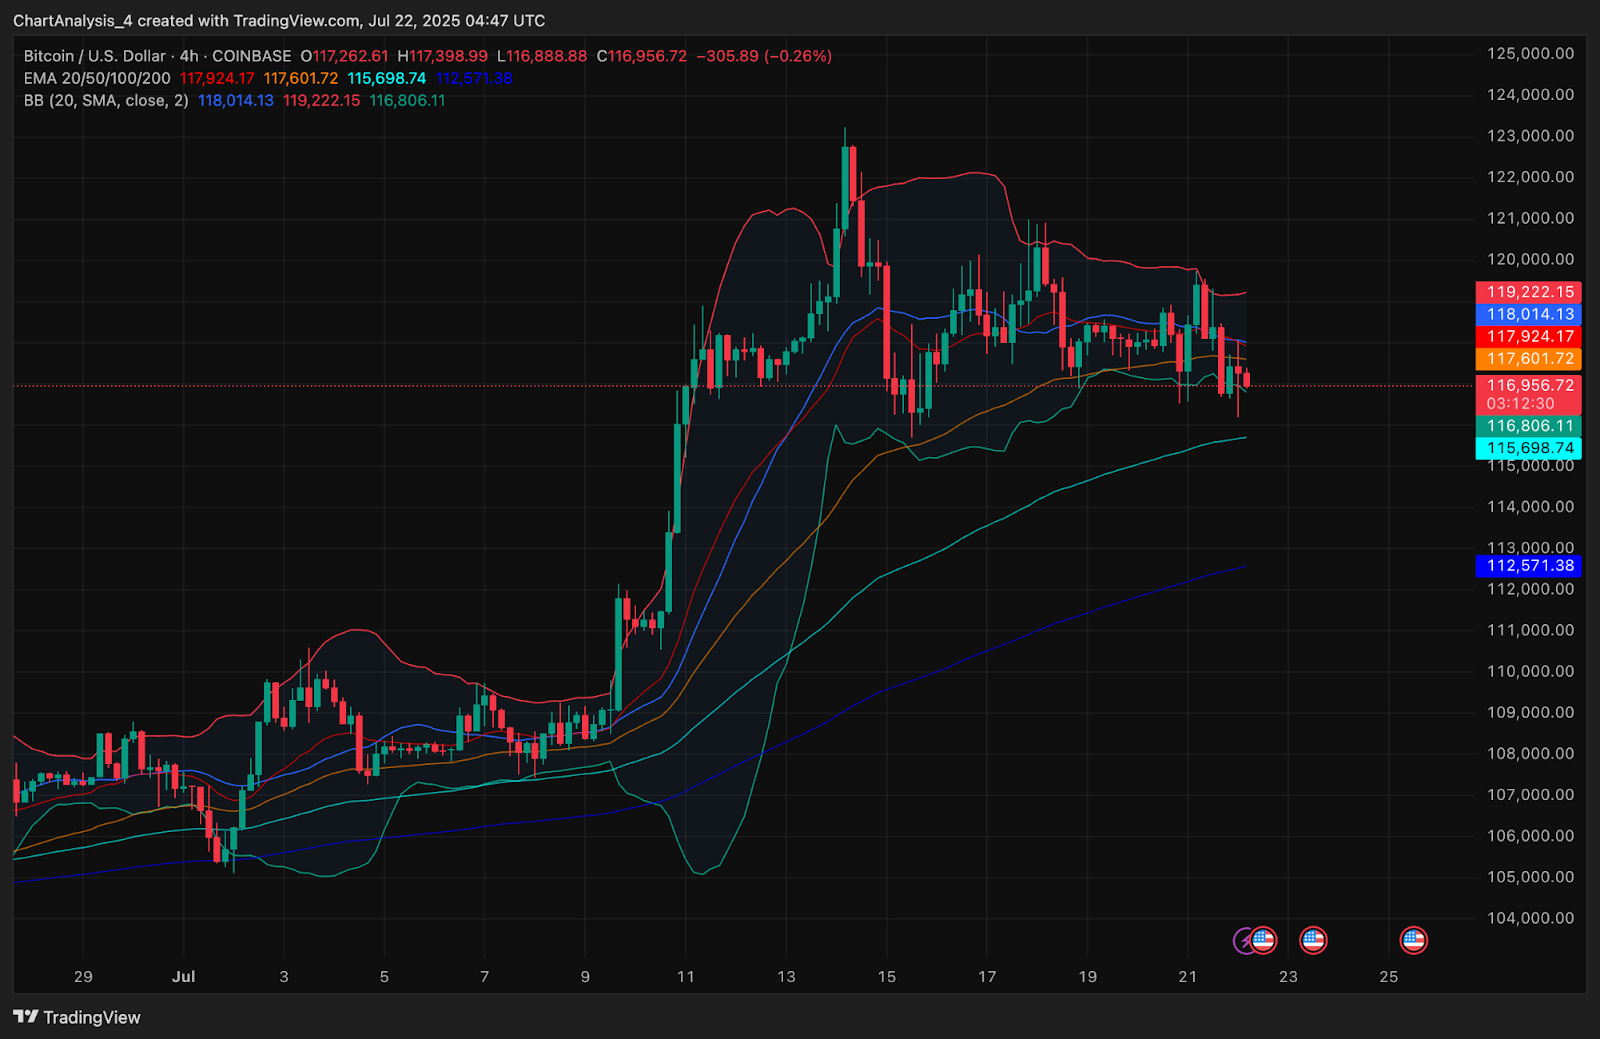
The 4-hour chart reinforces this outlook. BTC price has closed below the 20 EMA ($117,924) and 50 EMA ($117,601), while the 100 EMA ($115,698) is currently acting as near-term support. Bollinger Bands are starting to squeeze, indicating reduced volatility ahead of a possible breakout attempt. The lower band near $116,800 is being tested, and a breach could trigger further downside toward the 200 EMA at $112,571.
The Bollinger Band setup on the 4-hour chart has tightened noticeably, with price hugging the lower band. Historically, this setup precedes breakout volatility. However, with momentum leaning slightly bearish, a further drop below $116,800 could push price toward the lower channel support near $114,800.
Why Is The Bitcoin Price Going Down Today?
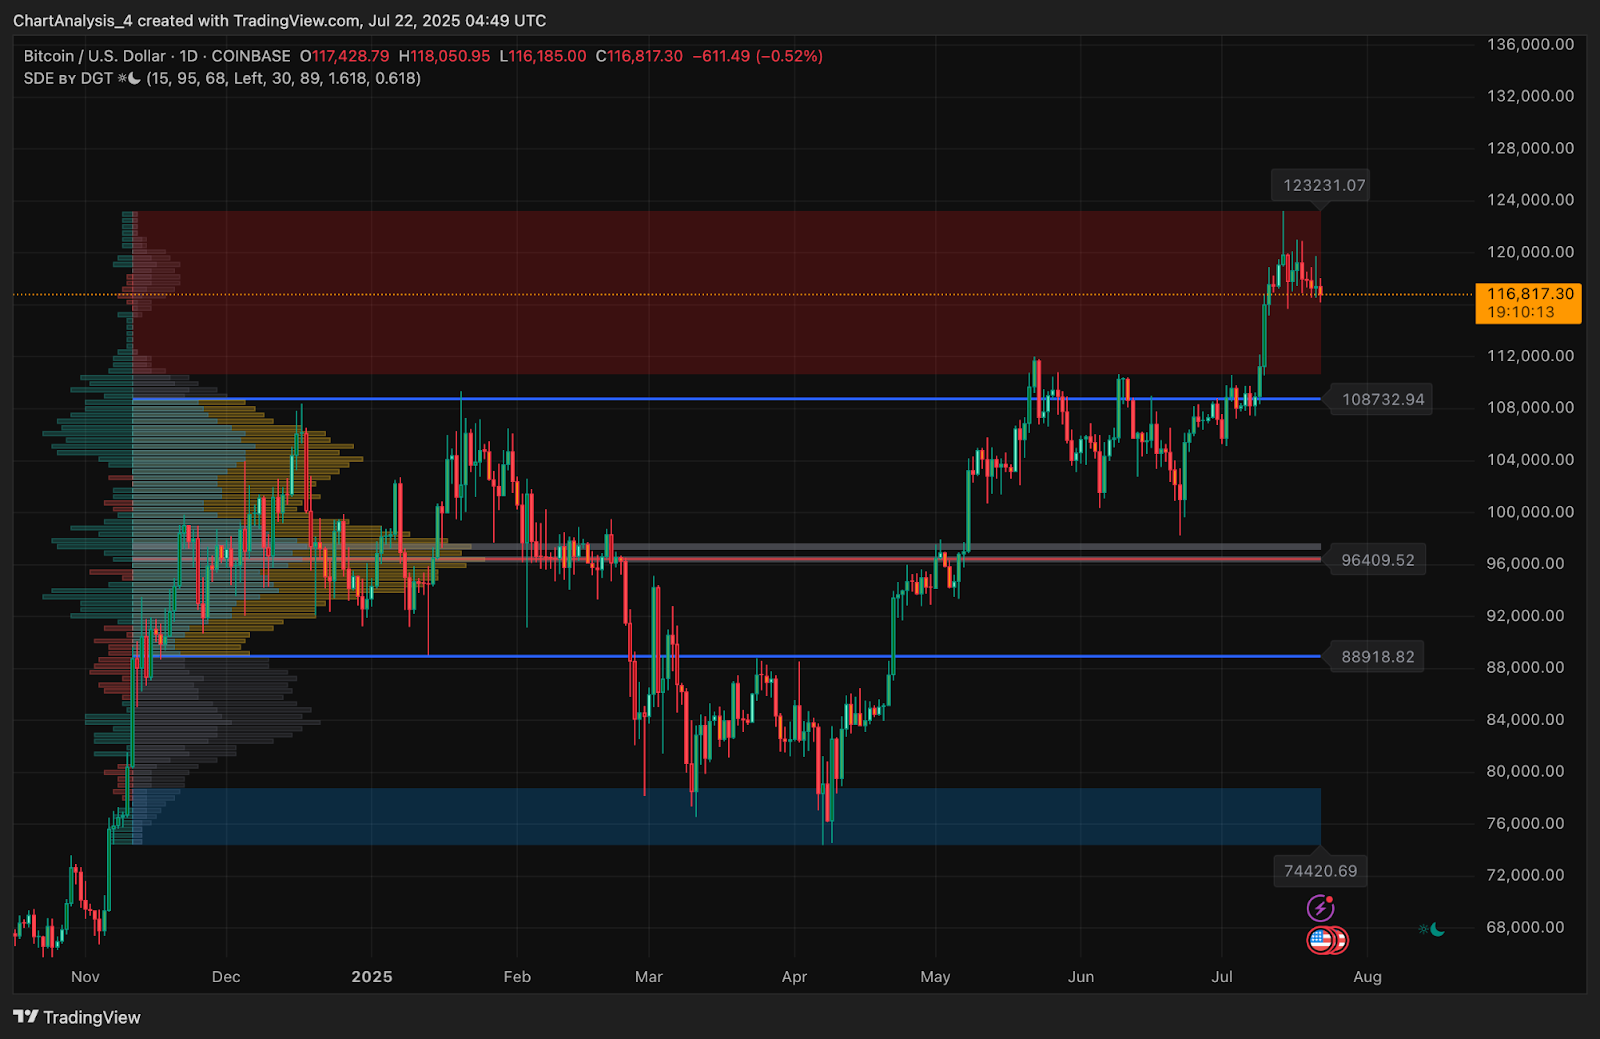
Why Bitcoin price going down today can be traced to structural exhaustion just beneath the major red supply wall seen on the daily chart. After multiple failed attempts to sustain above $120,000, the market is seeing steady distribution. The current BTC price action confirms a strong reaction from the $118,500–$123,200 supply block, which continues to cap upward momentum. Volume Profile data shows heavy resistance at the Point of Control near $118,500, while derivatives flows also reflect mixed sentiment.
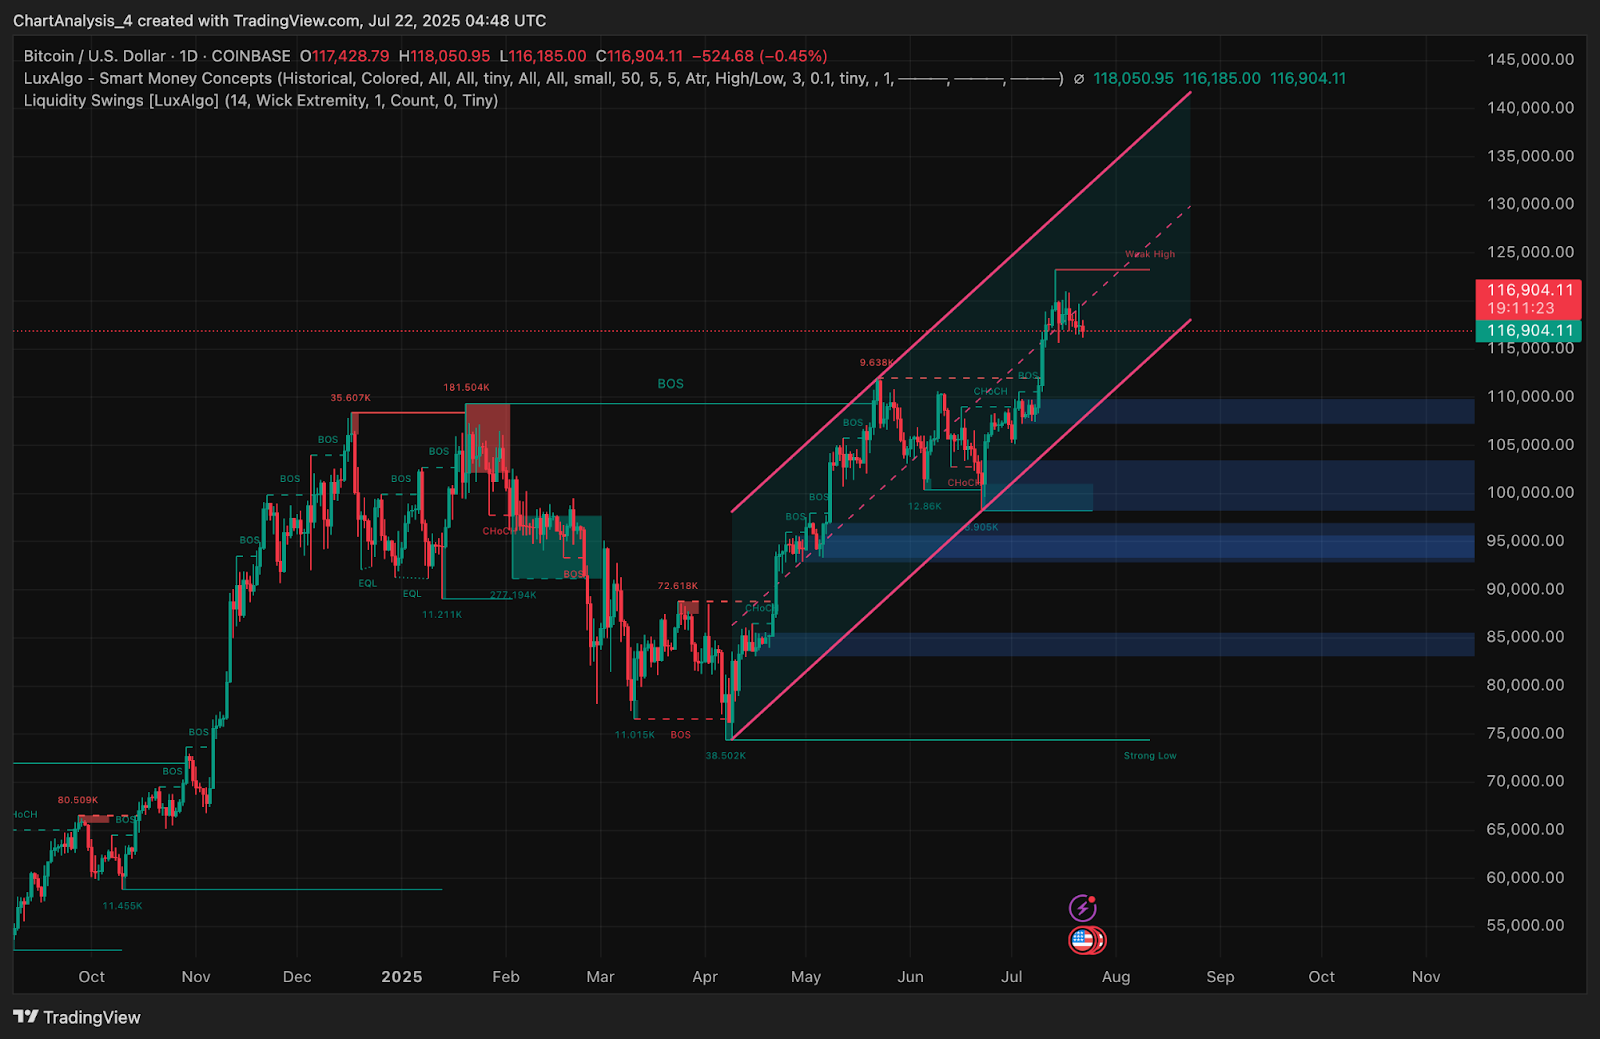
From a Smart Money Concepts (SMC) perspective, BTC price recently formed a bearish CHoCH on the daily structure, losing grip of short-term bullish flow. The latest break in market structure around $117,800 adds to bearish weight, with the current pullback possibly targeting the $115,500–$114,200 demand zone.
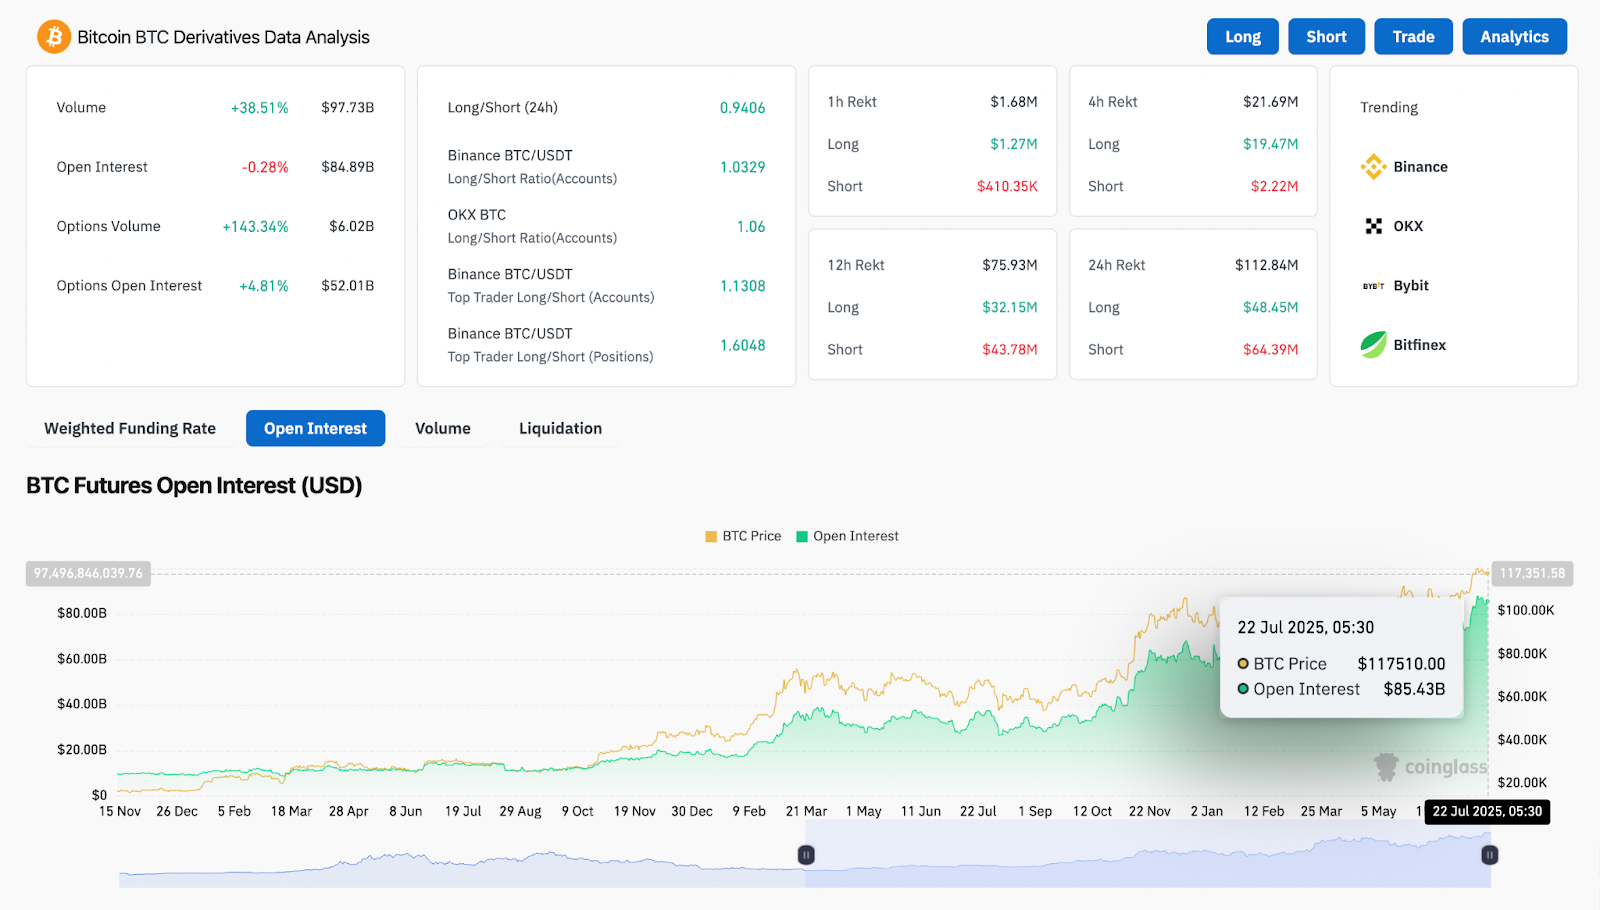
Coinglass data shows a slight dip in open interest (-0.28%) to $84.89B, even as 24-hour volume jumped 38.5% to $97.7B. Meanwhile, Binance top trader long/short ratio is at 1.60, showing aggressive long bias even as price compresses, suggesting risk of liquidation spikes if BTC drops under support.
Compression Bands, Supertrend, and Liquidity Zones in Focus
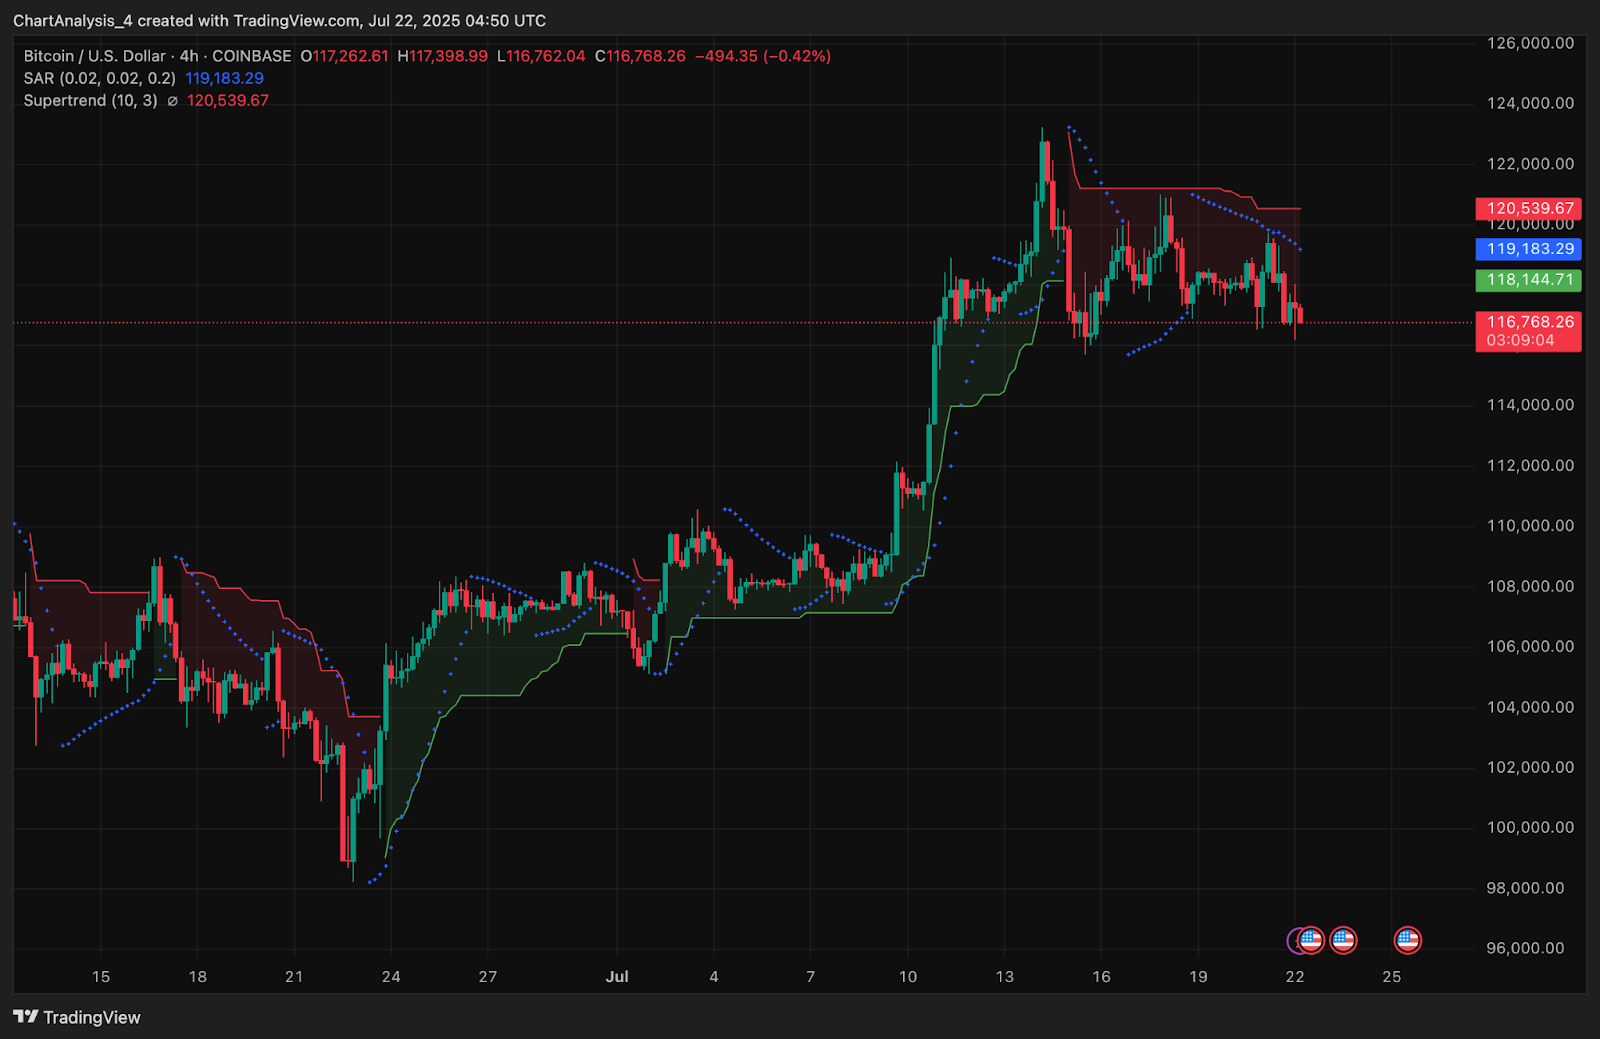
Supertrend and SAR indicators are also flashing warning signals. Bitcoin price has flipped bearish on the 4-hour Supertrend since failing to reclaim $120,500, while Parabolic SAR dots remain above price, reinforcing the downside bias. Until bulls reclaim $119,000 with a strong candle close, these dynamic indicators will continue to lean bearish.
The daily trendline channel from May remains intact, but price is now testing the lower bounds of this channel, aligned closely with a visible volume gap between $114,500 and $112,000. If sellers gain momentum, price may attempt to fill this inefficiency.
BTC Price Prediction: Short-Term Outlook (24H)
In the short term, BTC price today appears vulnerable to further downside unless bulls step in decisively above the $117,600–$118,000 resistance shelf. A breakout above this level would re-open a path toward $120,000 and potentially $123,200. However, failure to break above the descending channel top could invite a move toward $115,500 followed by $113,200, where EMA support and previous liquidity rests.
With MACD softening, RSI below 50, and derivatives still leaning long despite low conviction, traders should remain cautious. Any hourly close below $116,500 could trigger stop-hunts and accelerate a drop toward the next major demand zone.
Bitcoin Price Forecast Table: July 23, 2025
| Indicator/Zone | Level / Signal |
| Bitcoin price today | $116,900 |
| Resistance 1 | $118,000 |
| Resistance 2 | $120,000 |
| Support 1 | $115,500 |
| Support 2 | $113,200 |
| RSI (2H) | 41.49 (bearish leaning) |
| MACD (2H) | Flat, minor bearish crossover |
| EMA Cluster (4H) | Price below 20/50/100 EMA |
| Bollinger Bands (4H) | Squeezing, lower band tested |
| Supertrend (4H) | Bearish flip below $120,500 |
| Parabolic SAR (4H) | Bearish, dots above price |
| Volume Profile Resistance | $118,500–$120,000 zone |
| Open Interest (Coinglass) | $84.89B (-0.28%), long-heavy positioning |
| Binance Top Trader Ratio | 1.6048 (long bias, risk of liquidation) |
Disclaimer: The information presented in this article is for informational and educational purposes only. The article does not constitute financial advice or advice of any kind. Coin Edition is not responsible for any losses incurred as a result of the utilization of content, products, or services mentioned. Readers are advised to exercise caution before taking any action related to the company.


