 Price Prediction for July 24")
Bitcoin is trading around $118,700 as of July 23, consolidating after breaking out of a textbook inverse head and shoulders pattern visible on the daily chart. The neckline break above $112,000 was confirmed last week, and price has since pushed to a local high of $120,180 before stalling. Traders are now assessing whether BTC can maintain its bullish structure amid tightening intraday price action.
What’s Happening With Bitcoin’s Price?
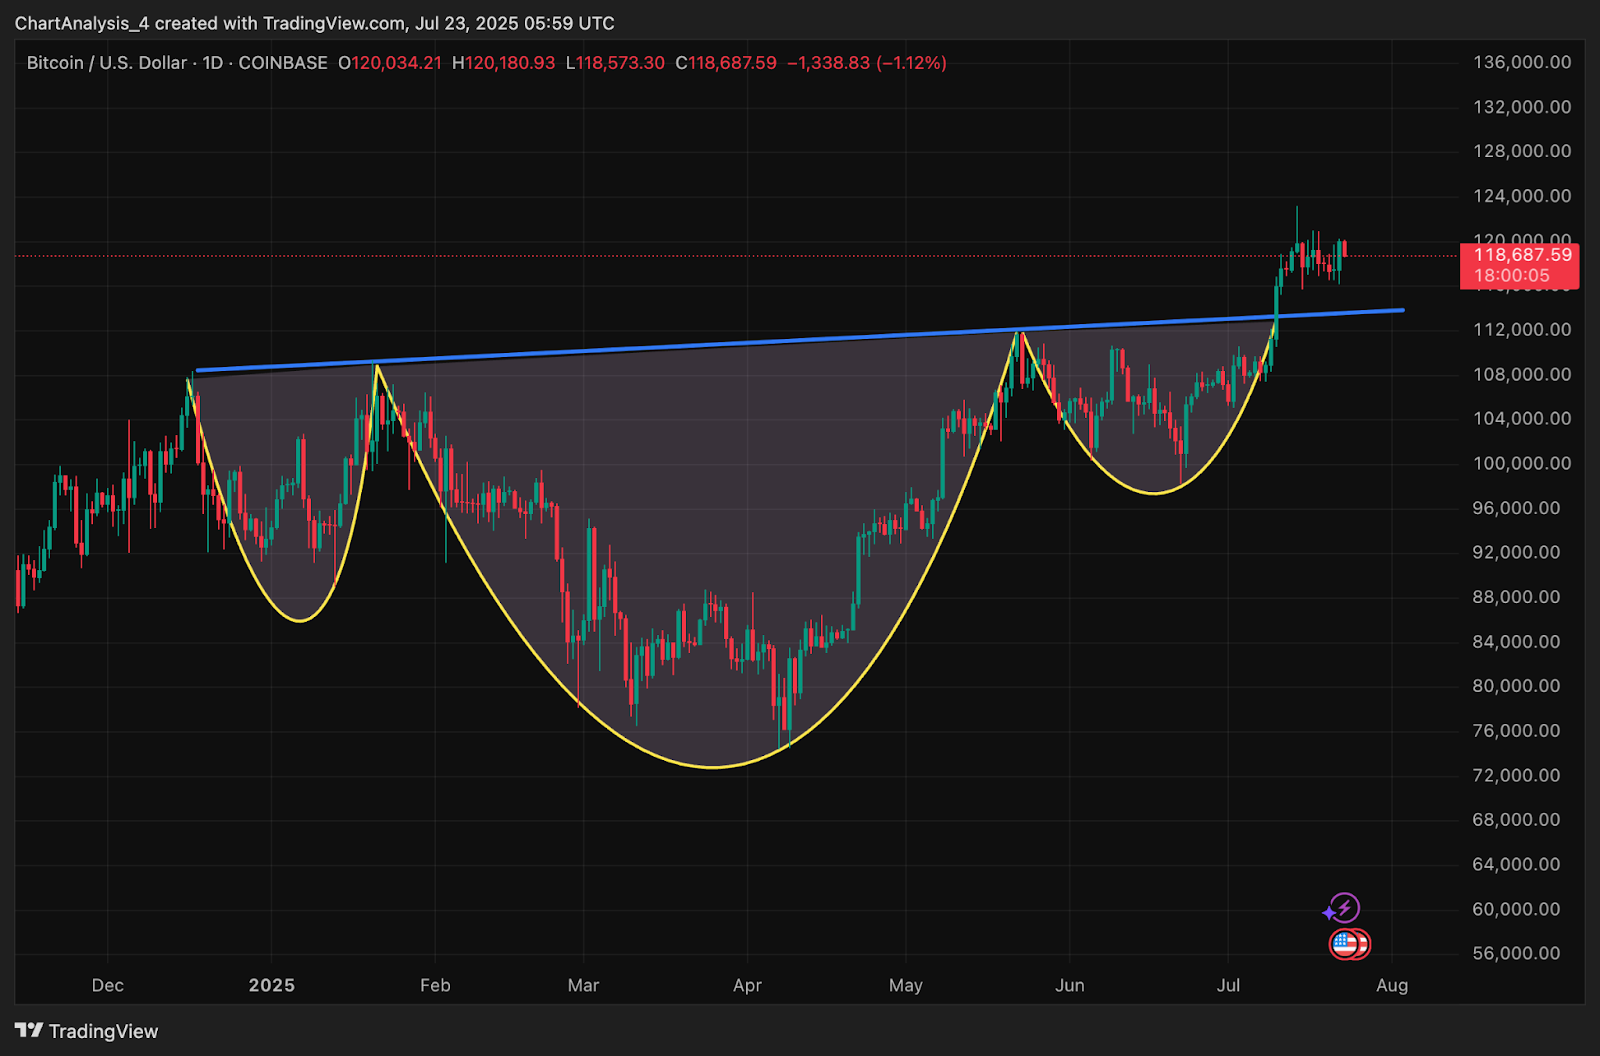
On the daily chart, Bitcoin price has completed a multi-month inverse head and shoulders reversal structure, with the neckline breakout occurring near $112,000. The clean push above this level marked a bullish shift in macro sentiment and opened the door for trend continuation. Price is currently consolidating above the neckline retest zone, suggesting healthy digestion of recent gains.
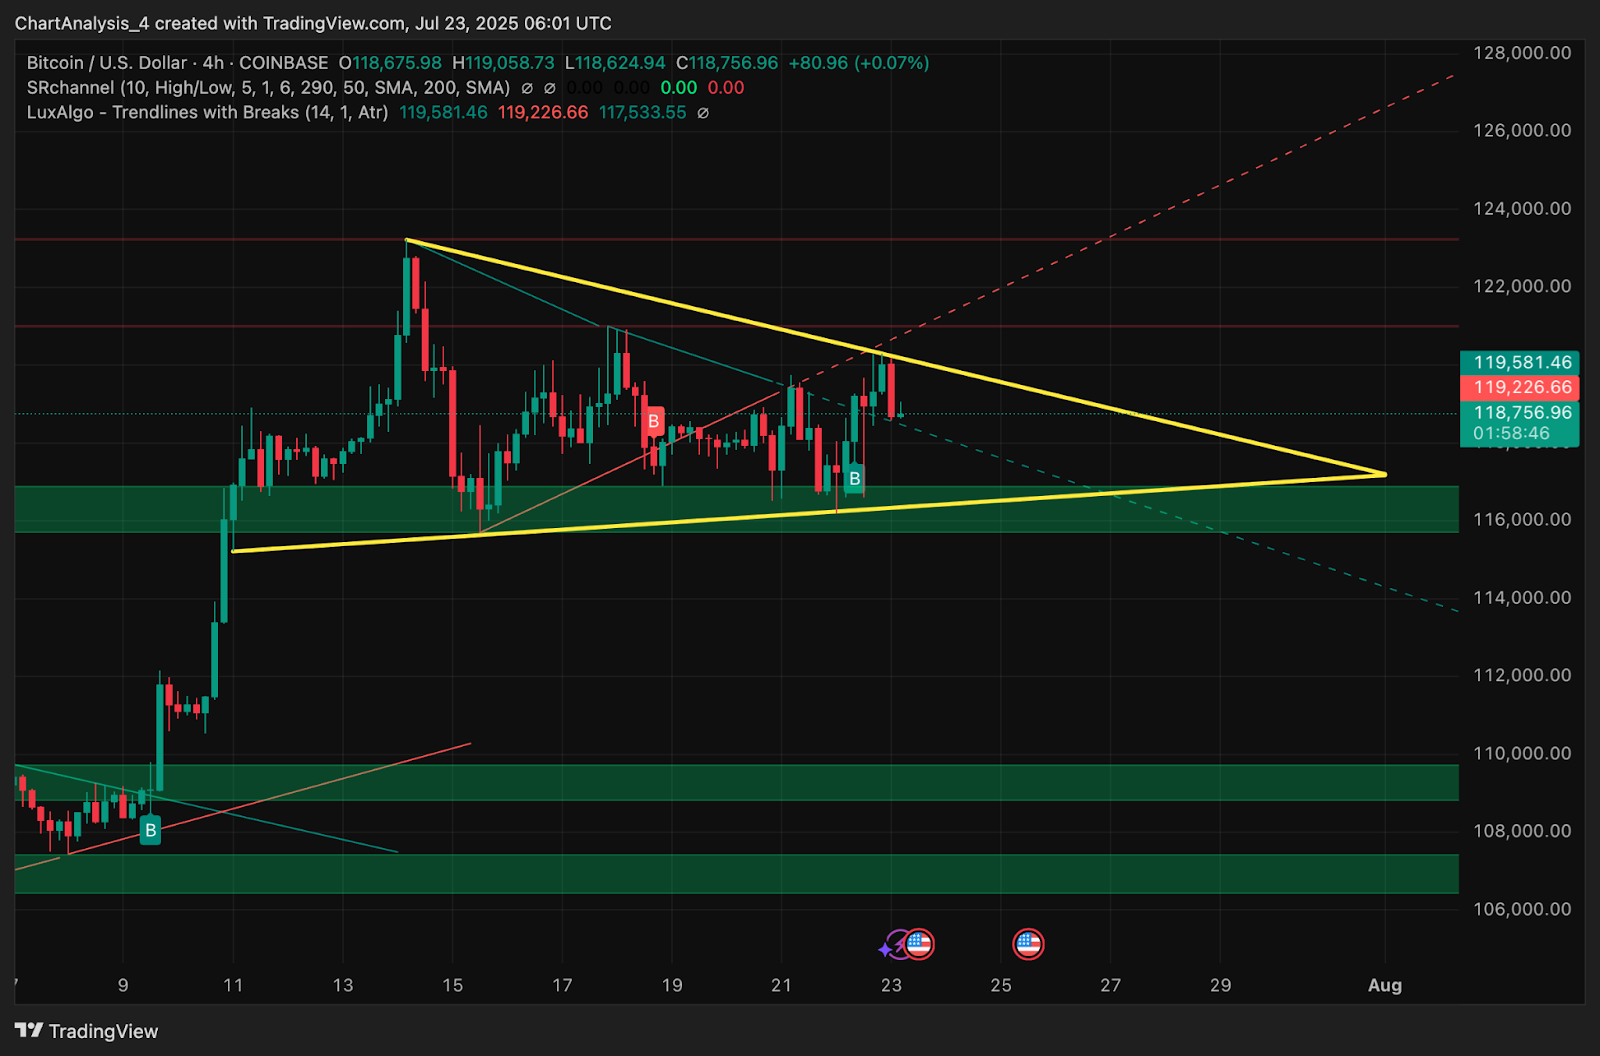
Meanwhile, the 4-hour chart shows Bitcoin compressing within a symmetrical triangle. The upper resistance trendline is capping upside near $119,200, while the support base extends to around $116,000. This narrowing structure signals an impending volatility event, where a breakout could extend gains toward $122,000 and above, while a breakdown risks revisiting the $114,000 liquidity pocket.
The current consolidation is also developing just above the key green demand block from earlier July, indicating buyers are defending this zone despite short-term resistance pressure.
Why Is The Bitcoin Price Going Down Today?
Why Bitcoin price going down today can be attributed to minor resistance rejection near the $119,500 triangle ceiling. On the 30-minute chart, Bitcoin price action shows a mild pullback after hitting this intraday high, with momentum indicators signaling temporary weakness.
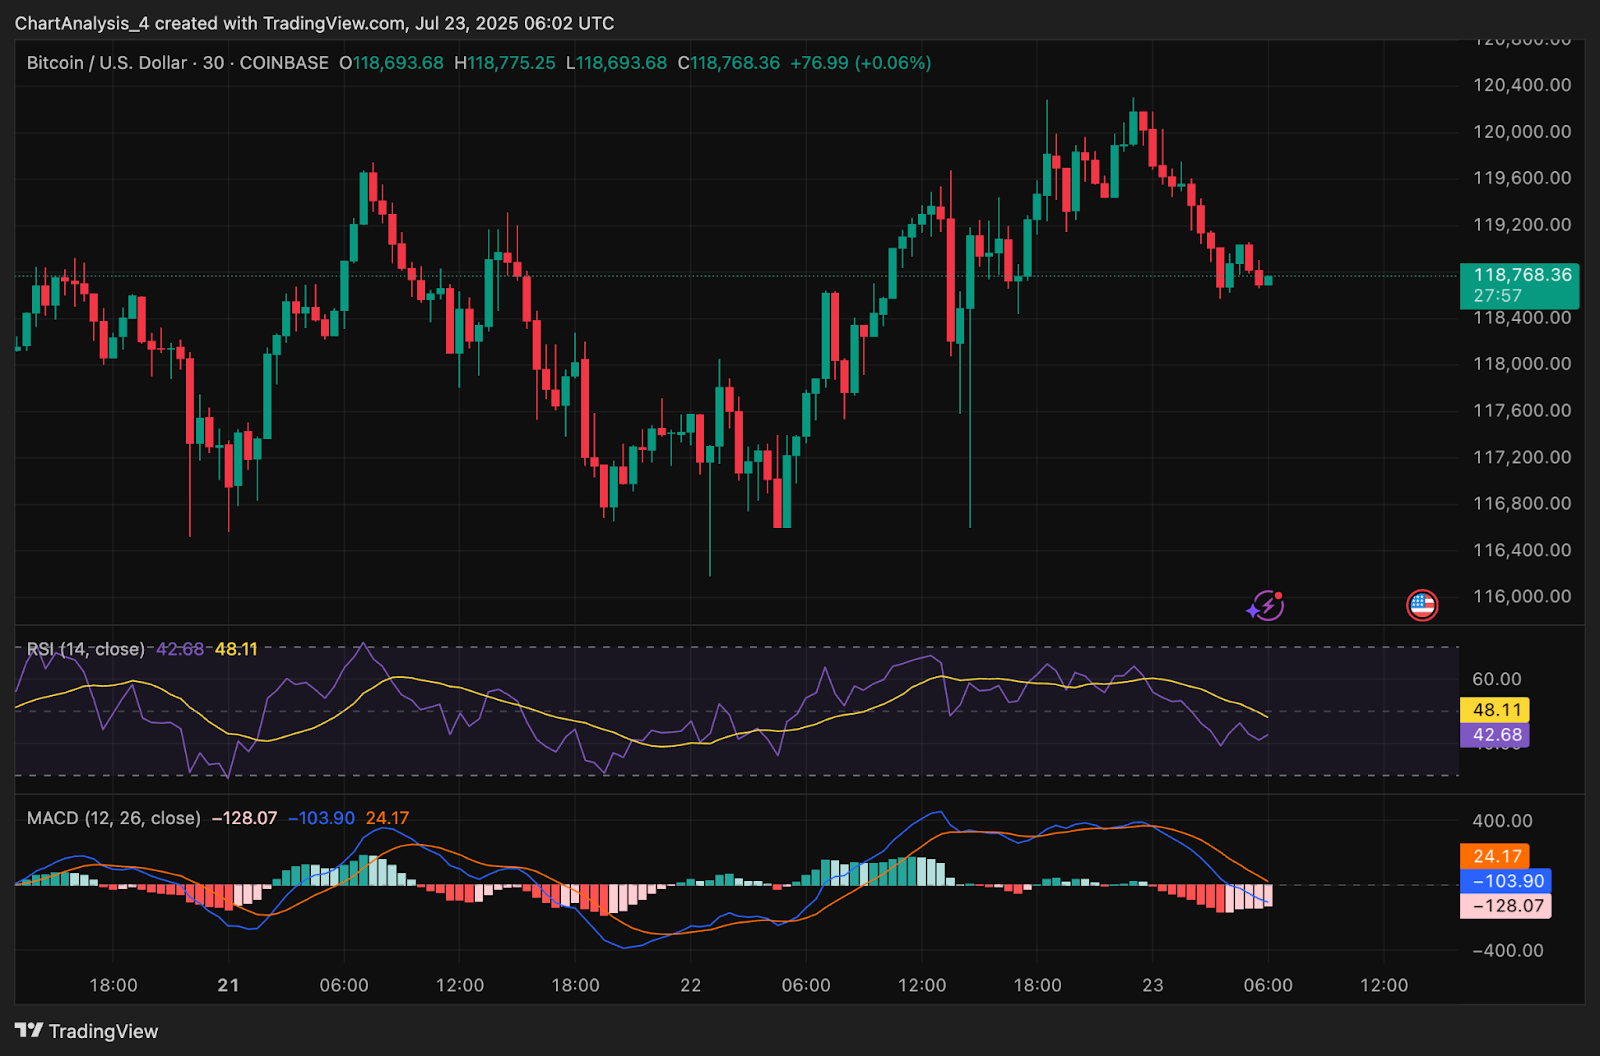
RSI has slipped to 42.6, falling below the 50 neutral mark and showing declining buying pressure. The MACD histogram has flipped negative, and the signal line remains well above the MACD line, confirming intraday bearish divergence. This suggests the rally has paused for consolidation, not reversal, as long as $116,000 remains intact.
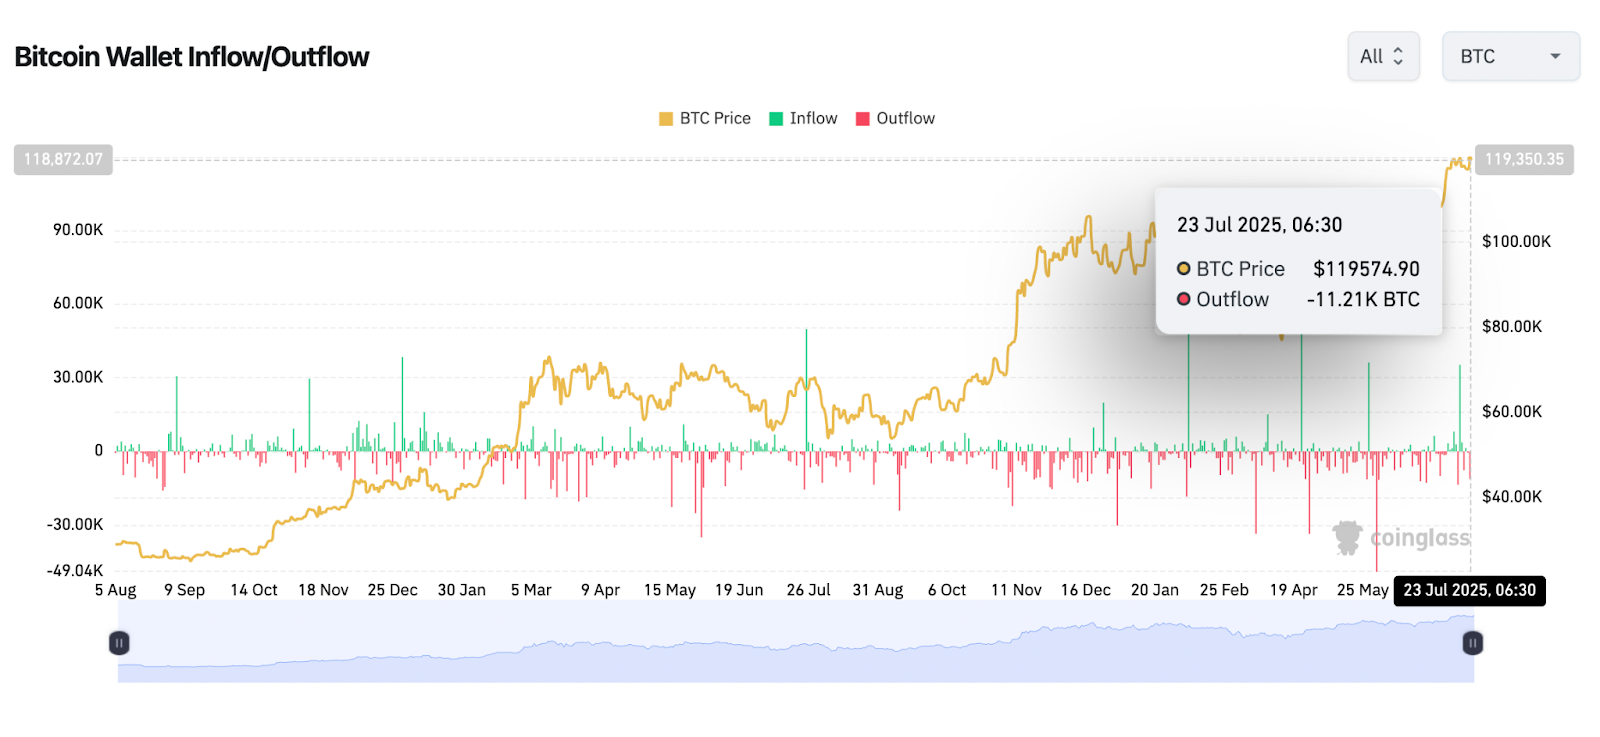
Adding to the context, Coinglass wallet data shows a short-term spike in Bitcoin outflows, with over 11.2K BTC leaving wallets in the last session, hinting at mild profit-taking.
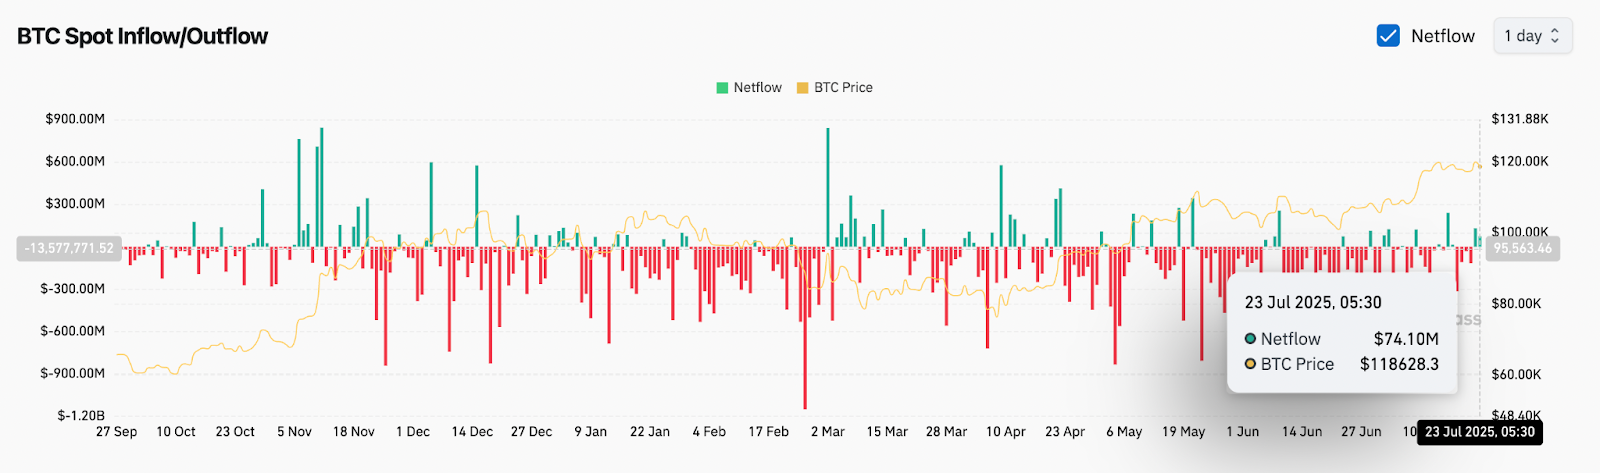
However, this is not extreme, and spot netflow remains positive at $74.10M, which is typically a bullish sign when aligned with rising price action.
EMAs and Bollinger Bands Suggest Supportive Trend Structure
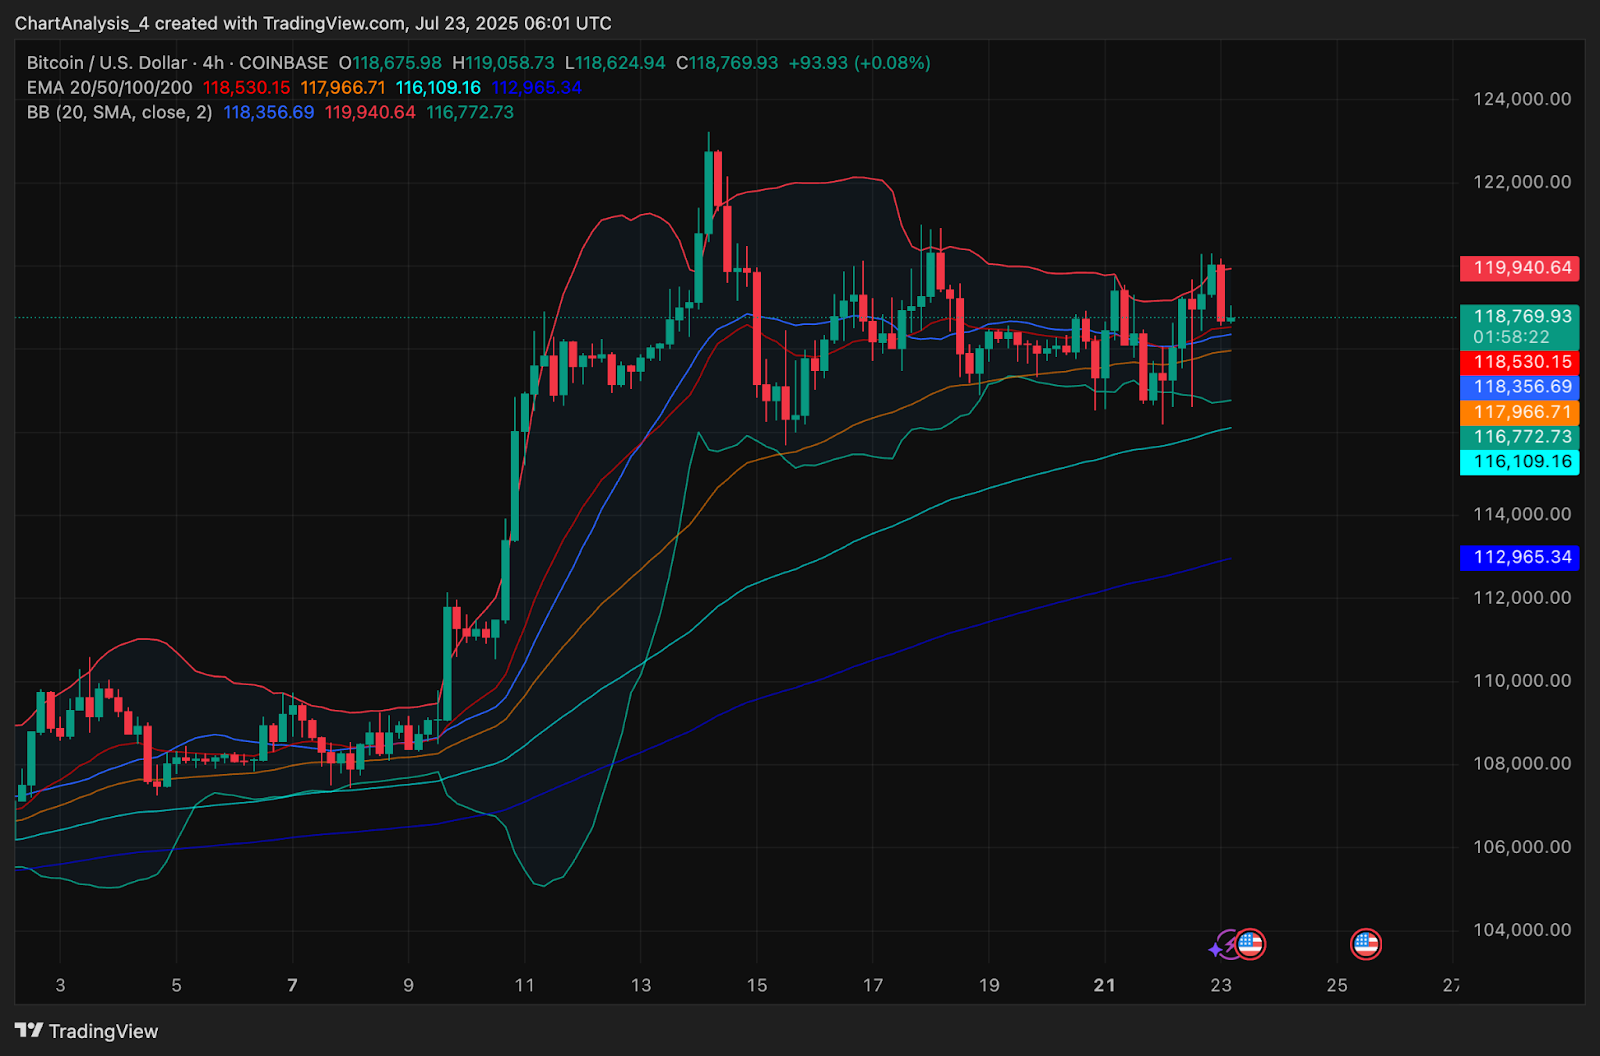
On the 4-hour chart, Bitcoin price today remains above all major exponential moving averages. The 20 EMA sits near $118,530 and is aligned closely with the 50 EMA at $117,966, forming a short-term support cluster. The 100 and 200 EMAs at $116,109 and $112,965 respectively are stacked bullishly beneath current price levels.
Bollinger Bands are moderately expanded, with the upper band near $119,940 and the lower band around $116,772. The squeeze seen earlier in July has already played out, and the current range signals that BTC is stabilizing before the next directional leg. As long as price holds above the EMA20 and remains inside the upper half of the Bollinger Band channel, the bullish structure stays intact.
Additionally, the recent price compression inside the triangle, combined with flat SAR dots and converging EMAs, hints at a volatility expansion likely within the next 24-48 hours.
BTC Price Prediction: Short-Term Outlook (24H)
In the short term, Bitcoin price is expected to react to the $119,200–$119,500 resistance zone. A confirmed breakout with volume would target $122,000 followed by $124,800 as the next Fibonacci projection levels from the inverse head and shoulders breakout.
If the triangle fails to break higher and BTC drops below $116,000, downside targets lie at $114,300 followed by the neckline retest zone at $112,000. However, current Bitcoin price volatility remains controlled, and rising OBV along with sustained spot inflow keeps the bullish case intact unless major support breaks.
Traders should watch the triangle apex over the next 24 hours as a decision point. A successful flip above $119,500 could re-ignite momentum. On the other hand, failure to hold $116K could lead to a deeper consolidation.
Bitcoin Price Forecast Table: July 24, 2025
| Indicator/Zone | Level / Signal |
| Bitcoin price today | $118,687 |
| Resistance 1 | $119,500 (Triangle top) |
| Resistance 2 | $122,000 (Post-breakout target) |
| Support 1 | $116,000 (Triangle base) |
| Support 2 | $114,300 (Demand block) |
| RSI (30-min) | 42.6 (Bearish divergence) |
| MACD (30-min) | Negative histogram, bearish bias |
| EMA Cluster (20/50/100/200, 4H) | All below price, bullish aligned |
| Bollinger Bands (4H) | Moderately expanded |
| Pattern | Symmetrical triangle breakout |
| Spot Netflow | +$74.10M (Bullish) |
| Wallet Outflow | 11.2K BTC (Profit-taking) |
Disclaimer: The information presented in this article is for informational and educational purposes only. The article does not constitute financial advice or advice of any kind. Coin Edition is not responsible for any losses incurred as a result of the utilization of content, products, or services mentioned. Readers are advised to exercise caution before taking any action related to the company.


 Price Prediction: Canton Eyes Key Break After Market Activity Spike")

