 Price Prediction for July 30")
After posting a strong recovery in July, Bitcoin price today is consolidating beneath the critical $120,000 barrier, trading near $118,800 at press time. This price region has become a key inflection zone, with volatility compression intensifying on lower timeframes. The market is now watching for breakout confirmation amid muted momentum and narrowing Bollinger Bands.
What’s Happening With Bitcoin’s Price?
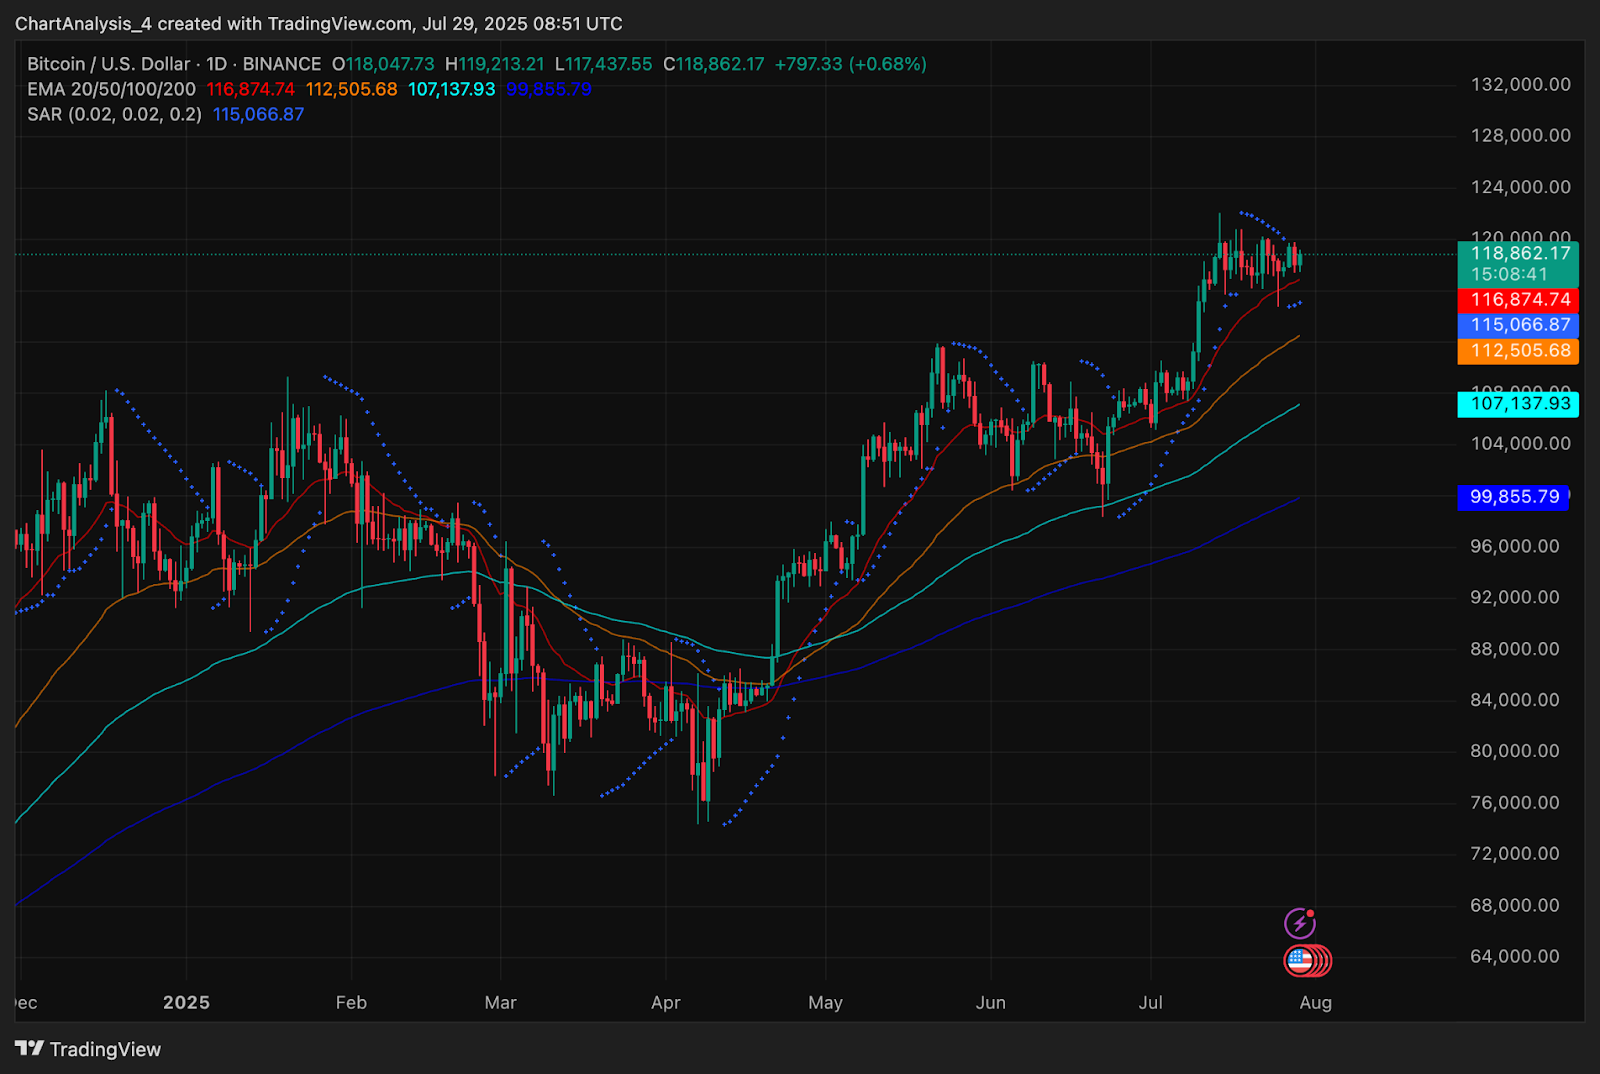
Bitcoin remains stuck in a tight consolidation just below the $120,000 supply zone. On the daily chart, the Parabolic SAR dots remain above price, suggesting stalled upside attempts since July 26. Price continues to hold above the 20-day EMA at $116,874 and the 50-day EMA at $112,505, indicating the broader structure still favors bulls.
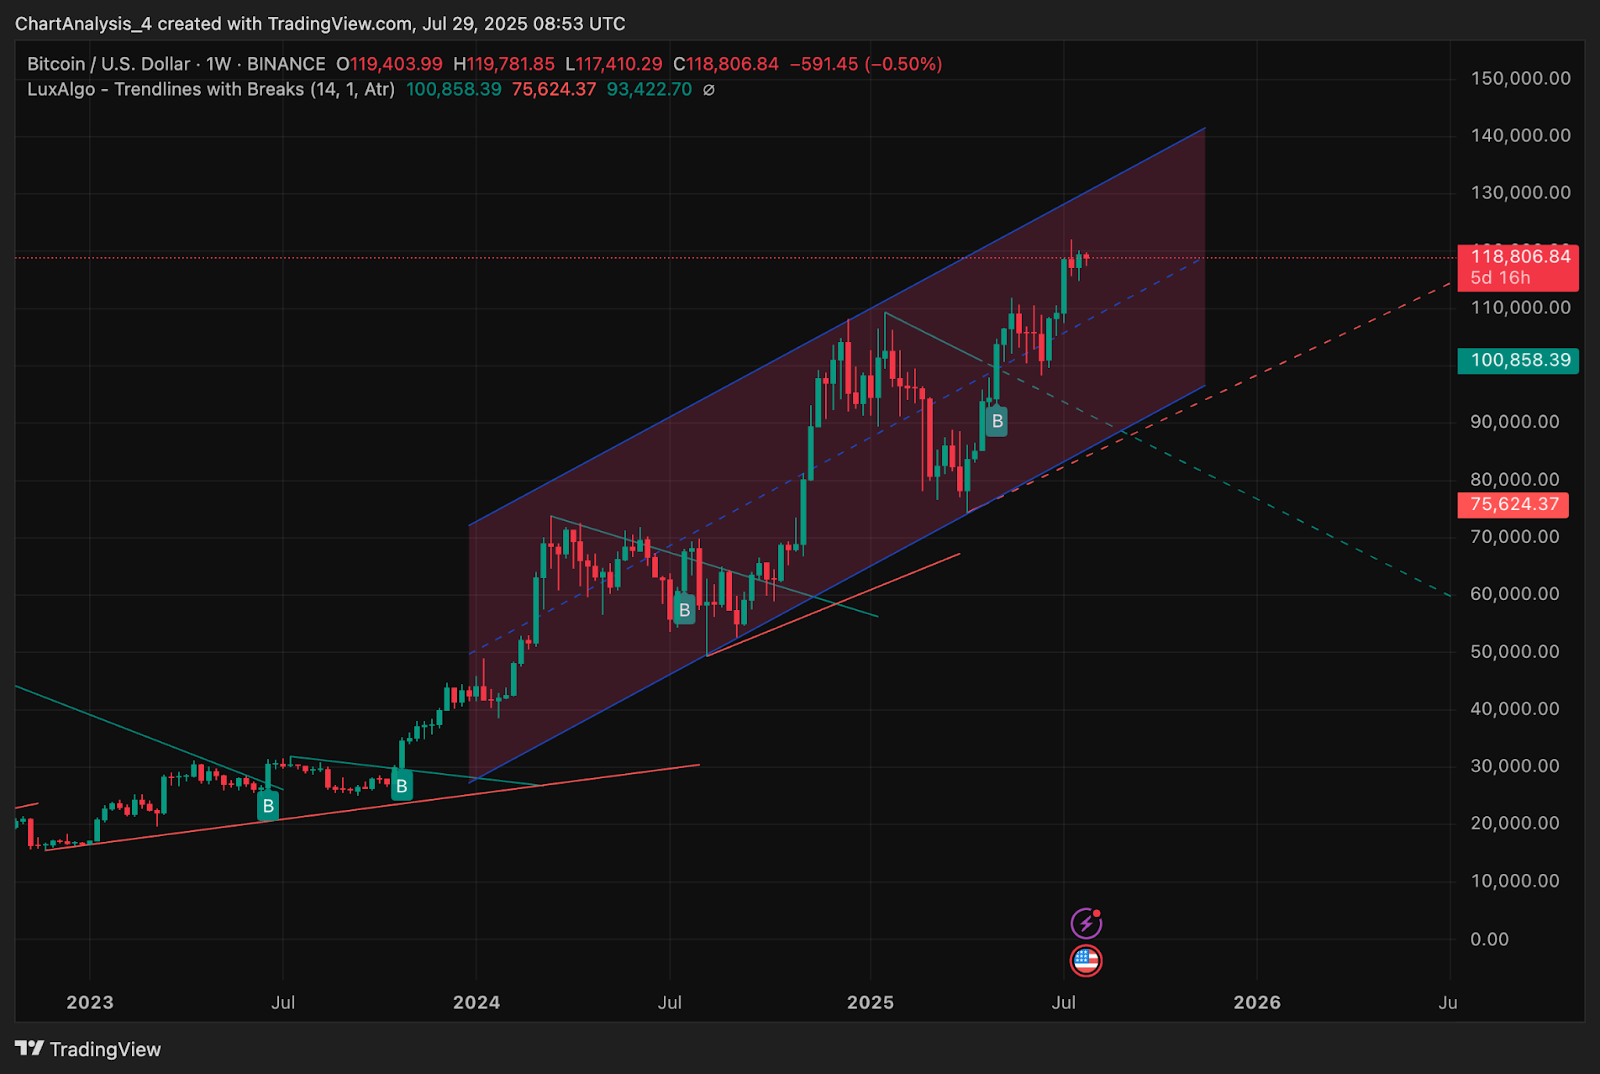
The weekly chart shows BTC firmly inside a rising parallel channel extending from mid-2023. Price is currently testing the upper boundary of this channel near $119,000, a level that has repeatedly capped prior rallies. Sustained rejection here could spark a corrective leg, while a confirmed breakout would likely target the $125,000–$130,000 range in the coming sessions.
Why Is The Bitcoin Price Going Down Today?
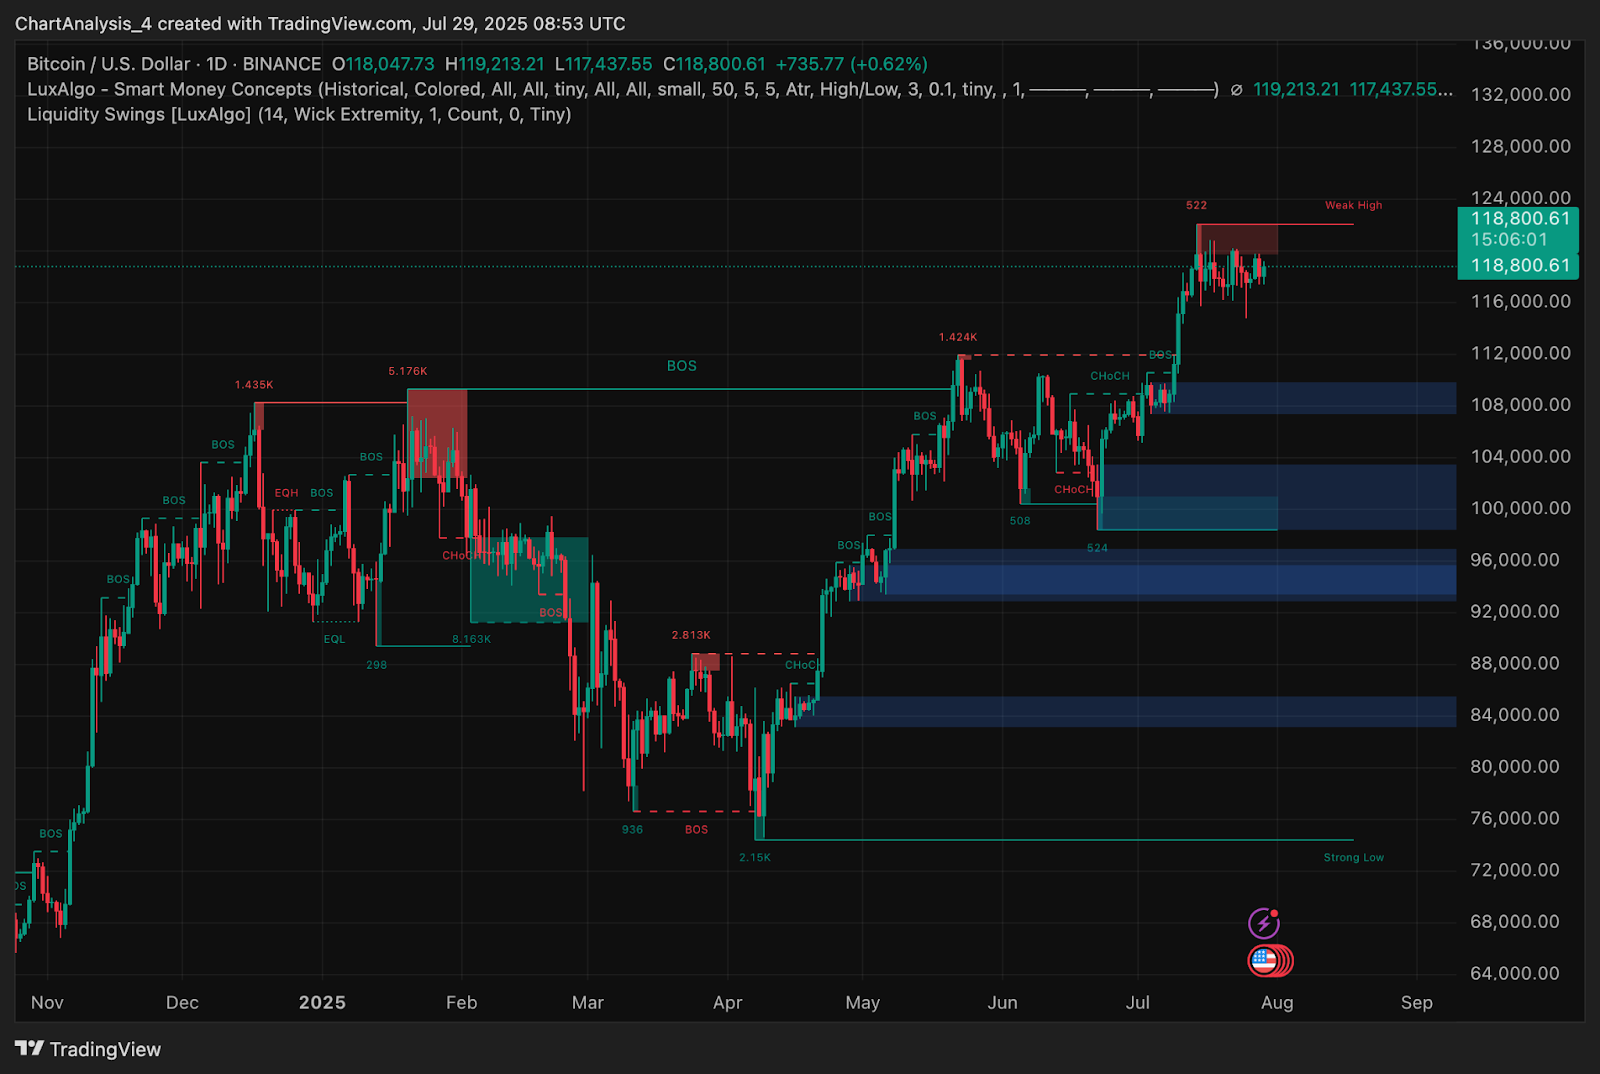
Why Bitcoin price going down today centers around rejection at a Smart Money “weak high” liquidity zone. On the daily chart, BTC has failed to close above $119,200 for five consecutive sessions, forming consecutive lower highs while hovering inside a visible supply block. This coincides with the red Supertrend level at $119,792, which continues to act as dynamic intraday resistance.
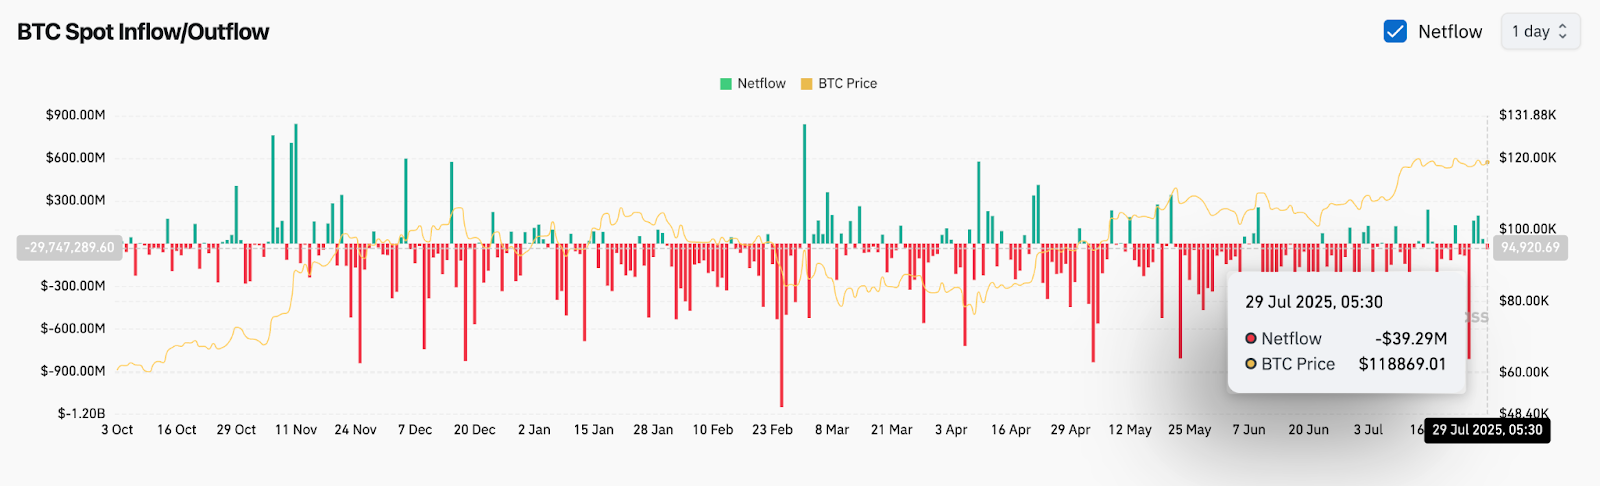
Additionally, spot netflows show consistent outflows across exchanges, with -$39.29M in net BTC leaving trading platforms as of July 29. This signals cautious accumulation or withdrawal, reducing short-term sell pressure but also indicating a lack of aggressive inflow demand at current highs.
The RSI has cooled to 64.08 from prior overbought readings, reflecting consolidation rather than full reversal. MACD is still positive, but histogram bars are narrowing on the 4-hour chart, pointing to momentum fatigue.
BTC Indicators Signal Sideways Bias Before Breakout
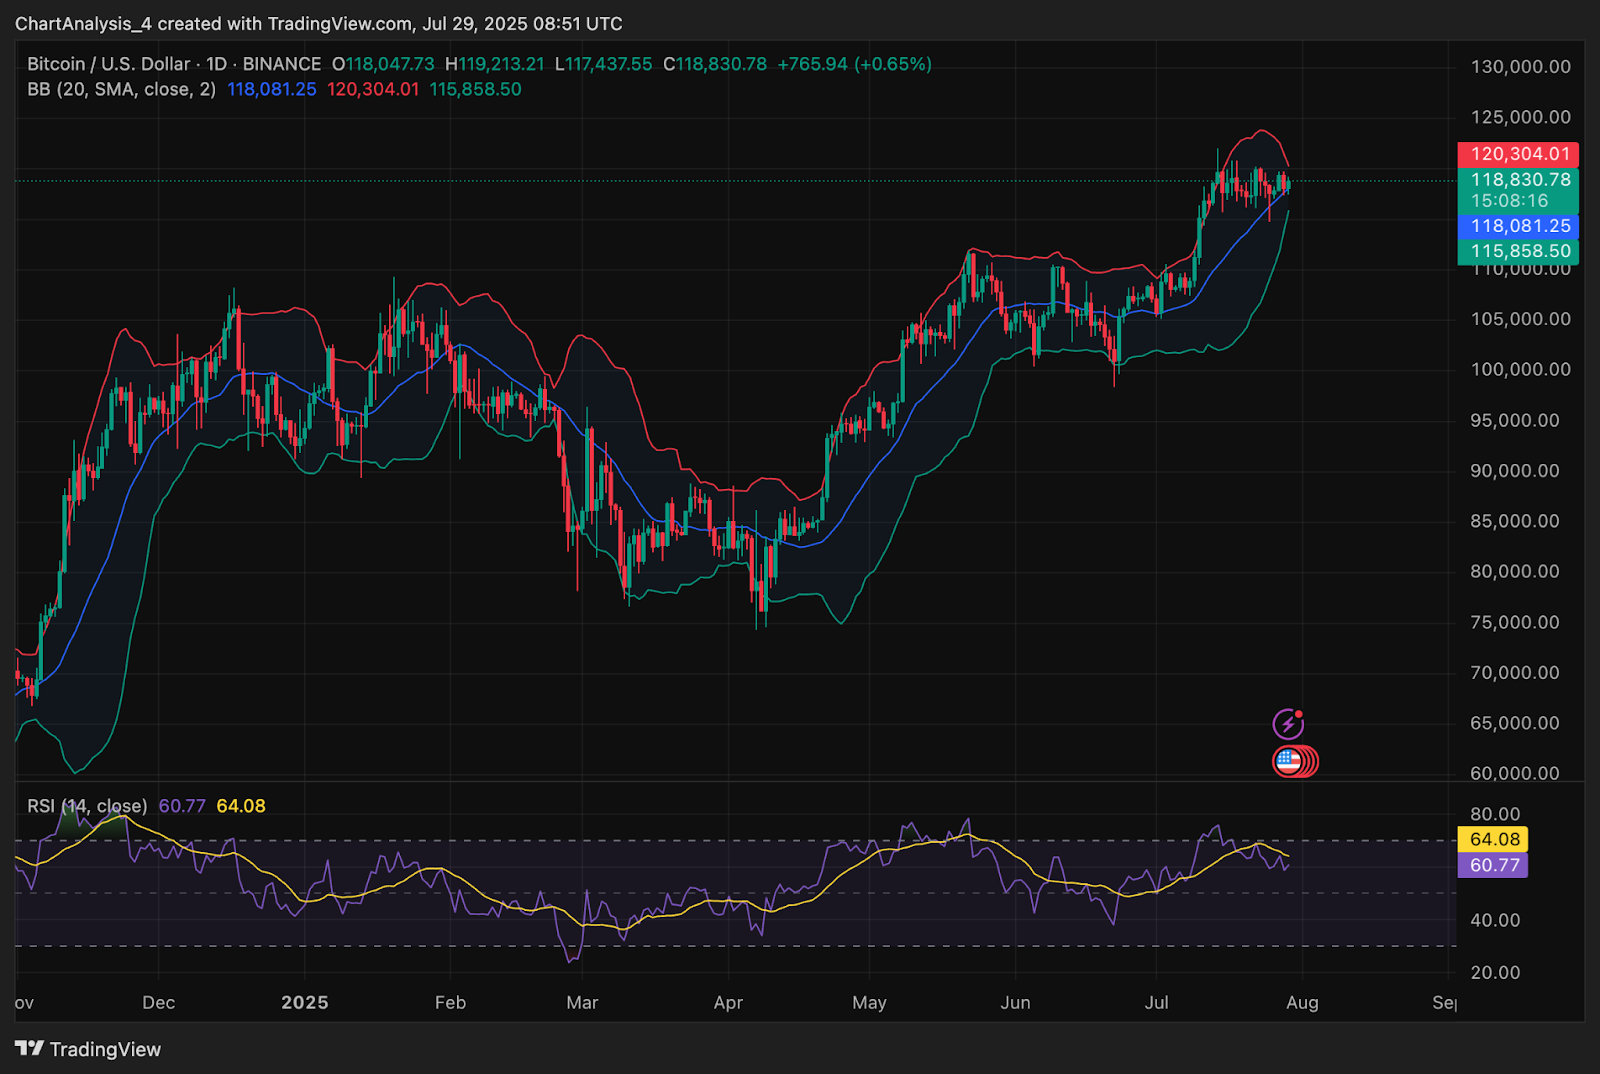
Bollinger Bands on the daily timeframe have started to squeeze, with the range now tightening between $115,800 and $120,300. Historically, such compression phases precede significant directional moves. With price hovering near the upper band but unable to close above it, traders are anticipating a volatility expansion event soon.
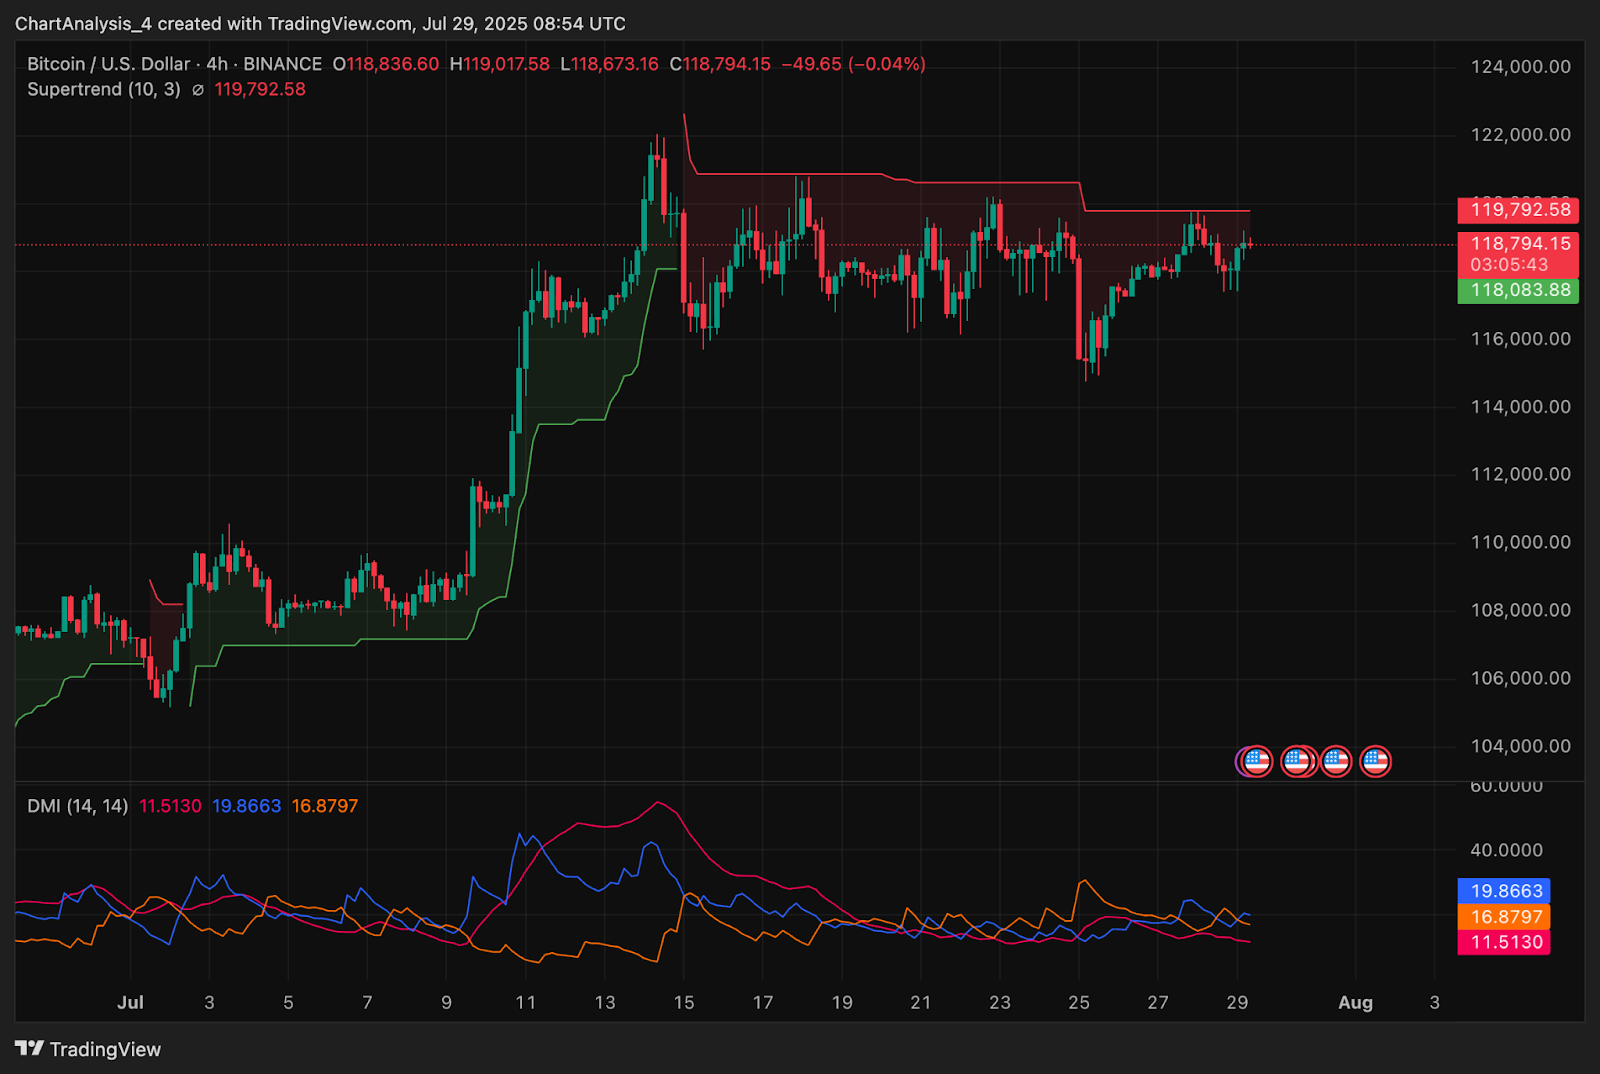
Directional Movement Index (DMI) shows a loss of clear trend strength. The +DI and -DI are narrowing with ADX below 20, indicating indecisive directional control. Meanwhile, the Supertrend remains bearish on the 4-hour chart unless price closes decisively above $119,792.
The Smart Money Concepts chart highlights a CHoCH formation near $118,200 and recent Break of Structure (BOS) at $117,000. As long as BTC holds above the $116,000–$117,000 zone, the bullish structure remains intact, but failure to reclaim $120K would invalidate breakout hopes.
BTC Price Prediction: Short-Term Outlook (24H)
The short-term structure for Bitcoin price remains neutral to bullish, with bulls needing a daily close above $120,000 to confirm a breakout. If successful, the next resistance lies at $122,500 and $125,000. However, repeated rejections from the $119,200–$120,000 band could open the door for a dip toward $116,800 (EMA20) and potentially $115,000 (Parabolic SAR and BB midline).
The key to confirmation will lie in intraday volume and whether BTC can break above the compression wedge that has formed since July 24. A downside break of $116,000 would flip bias short-term bearish and could expose the $112,500–$113,000 support cluster aligned with the 50 EMA.
Bitcoin Price Forecast Table: July 30, 2025
| Indicator/Zone | Level / Signal |
| Bitcoin price today | $118,800 |
| Resistance 1 | $119,792 (Supertrend) |
| Resistance 2 | $122,500 |
| Support 1 | $116,874 (EMA20) |
| Support 2 | $115,066 (Parabolic SAR) |
| Bollinger Band Width (Daily) | Tight (Volatility breakout nearing) |
| RSI (Daily) | 64.08 (Neutral-Bullish) |
| MACD Histogram (4H) | Fading Bullish |
| Netflow | -$39.29M (Outflow) |
| Smart Money CHoCH | $118,200 (Reclaim Level) |
| DMI (14) | Weak Trend, ADX ~16.9 |
| Weekly Channel Upper Bound | $119,500 (Breakout Trigger) |
Disclaimer: The information presented in this article is for informational and educational purposes only. The article does not constitute financial advice or advice of any kind. Coin Edition is not responsible for any losses incurred as a result of the utilization of content, products, or services mentioned. Readers are advised to exercise caution before taking any action related to the company.


