 Price Prediction for July 5")
After briefly breaking out of a multi-week symmetrical triangle, the Bitcoin price today is trading around $109,000, down 0.5% on the day. The breakout attempt stalled just below $110,600, a level that aligns with key Fibonacci and supply resistance. While the broader structure remains bullish, intraday indicators are showing divergence and early signs of short-term exhaustion.
What’s Happening With Bitcoin’s Price?
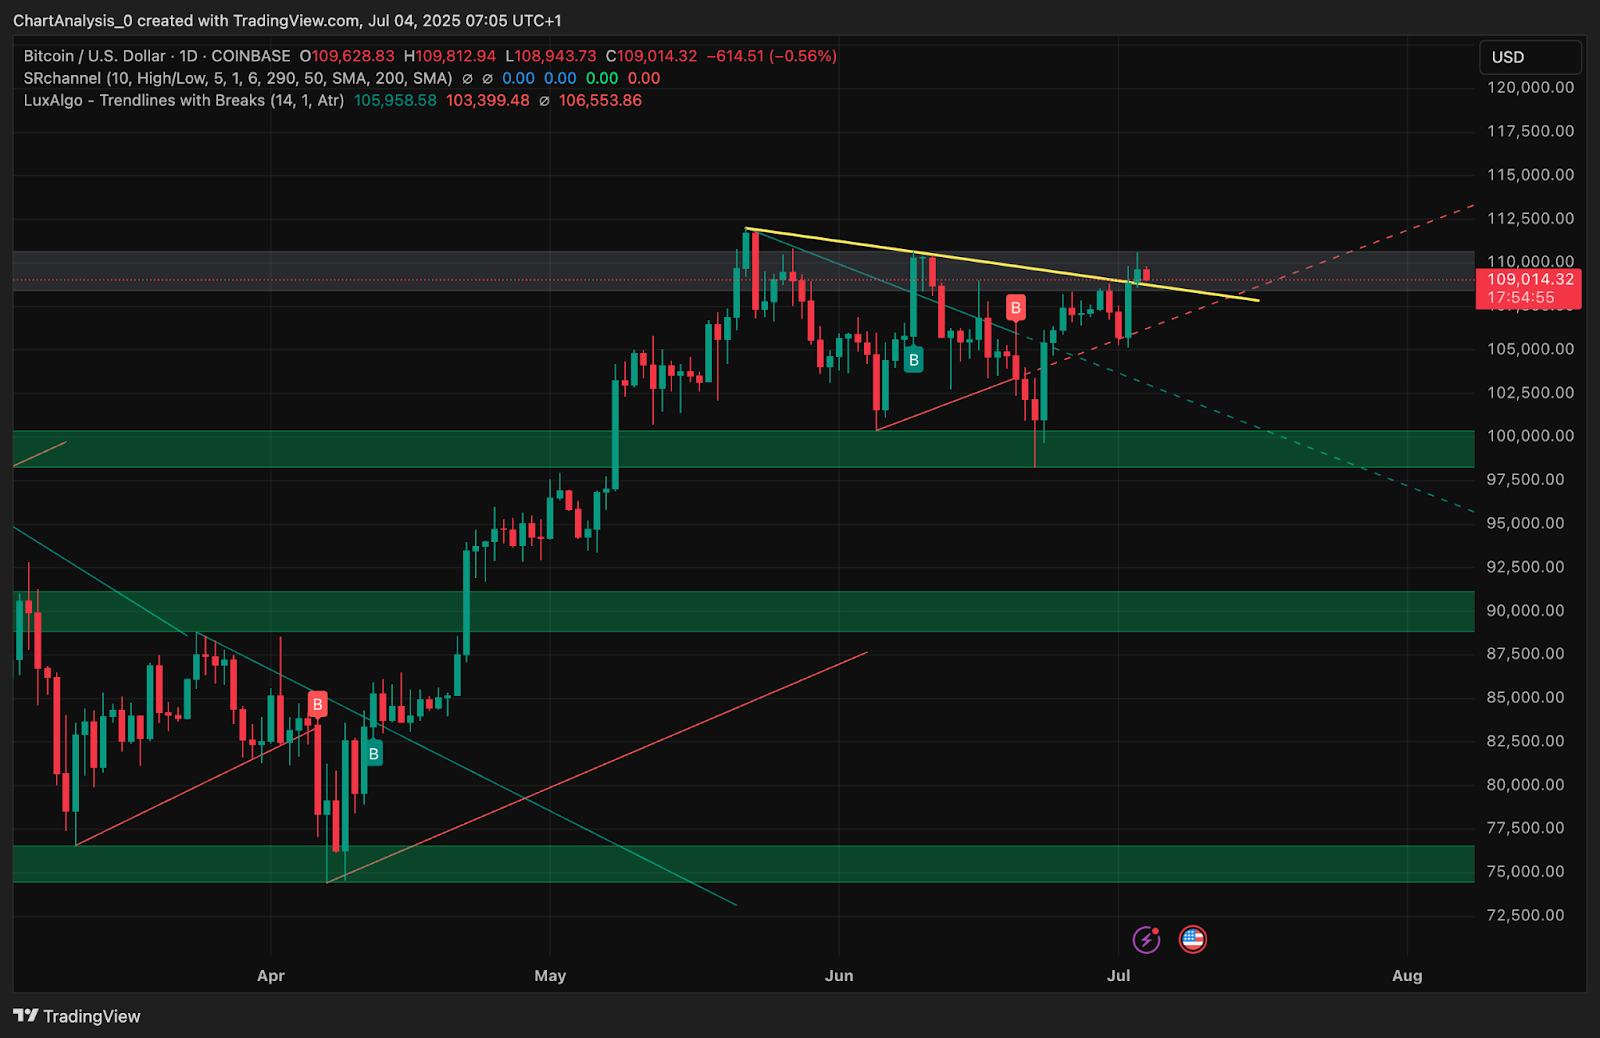
On the daily chart, Bitcoin price recently breached the descending triangle resistance near $108,000, which had capped upside since early June. The breakout was clean but met heavy supply pressure just under $111,000. The move still keeps BTC above the key trendline, suggesting structural strength. However, candles are now consolidating at the edge of the breakout zone, indicating indecision.
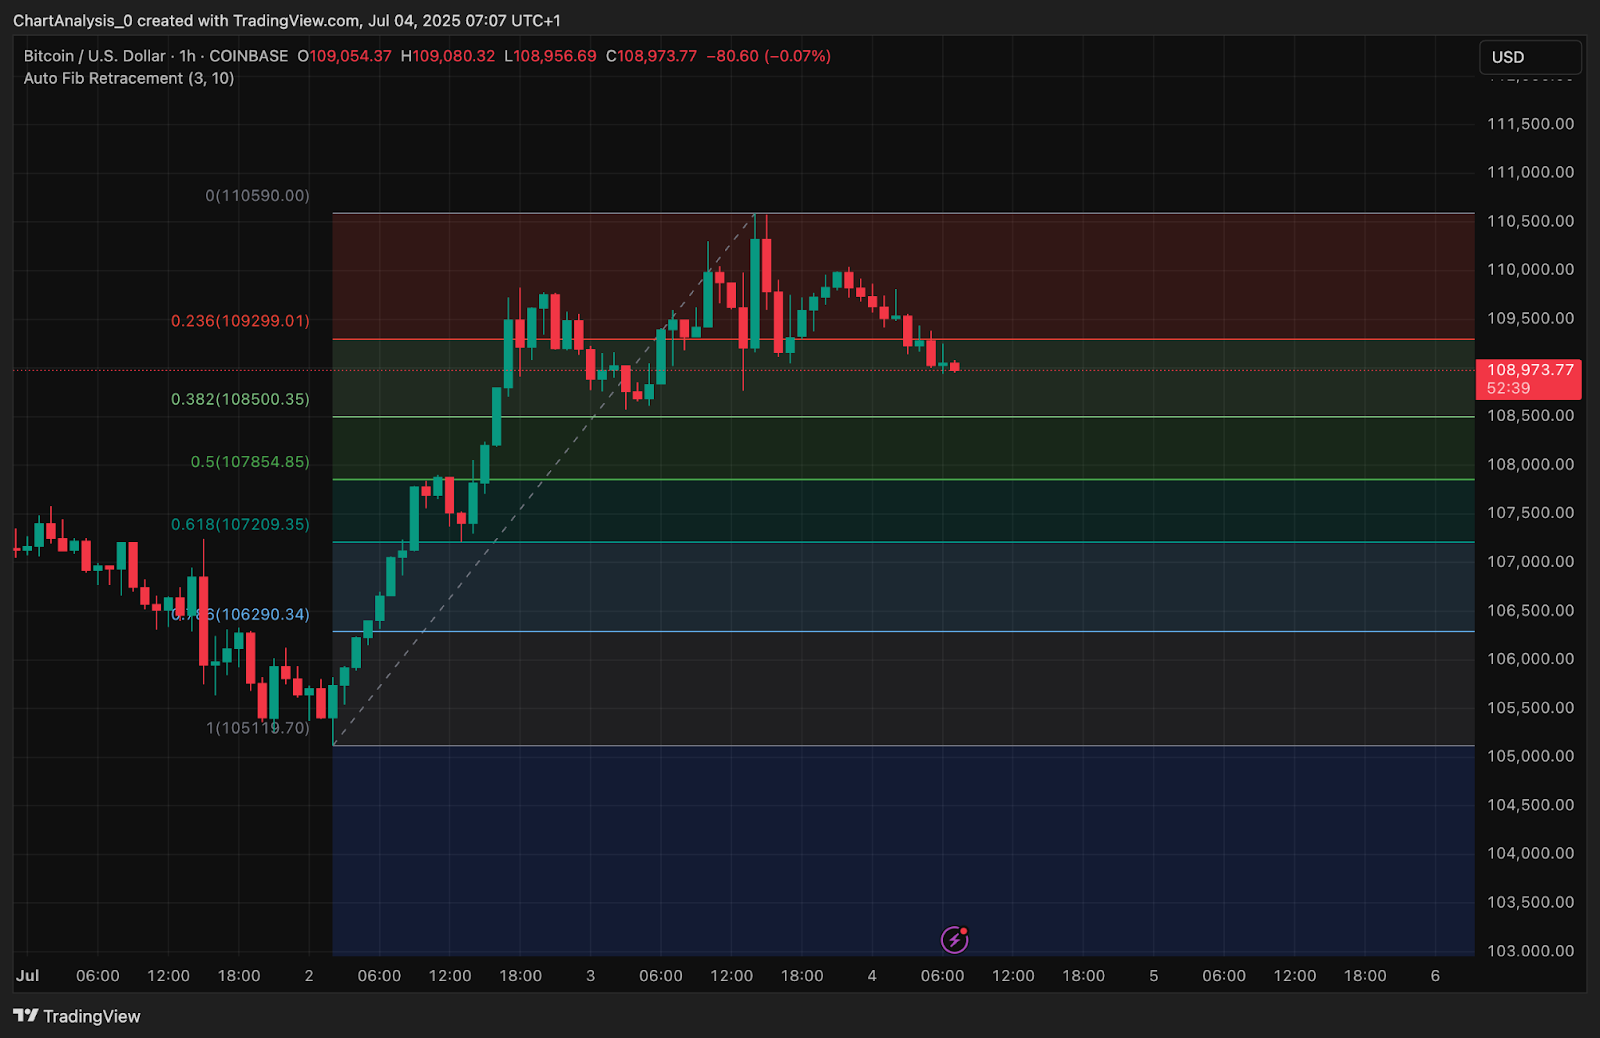
The rejection near $110,590 corresponds with the 0.0 Fibonacci level from the latest 1H swing, while the 0.236 retracement near $109,299 is currently acting as short-term resistance. A sustained move above this level is required to maintain upward pressure.
The broader ascending parallel channel from late June remains intact, and BTC is currently hovering near the midline. The key support at $108,000 also coincides with the lower Bollinger Band on the 4H chart and EMA50.
Why Is The Bitcoin Price Going Down Today?
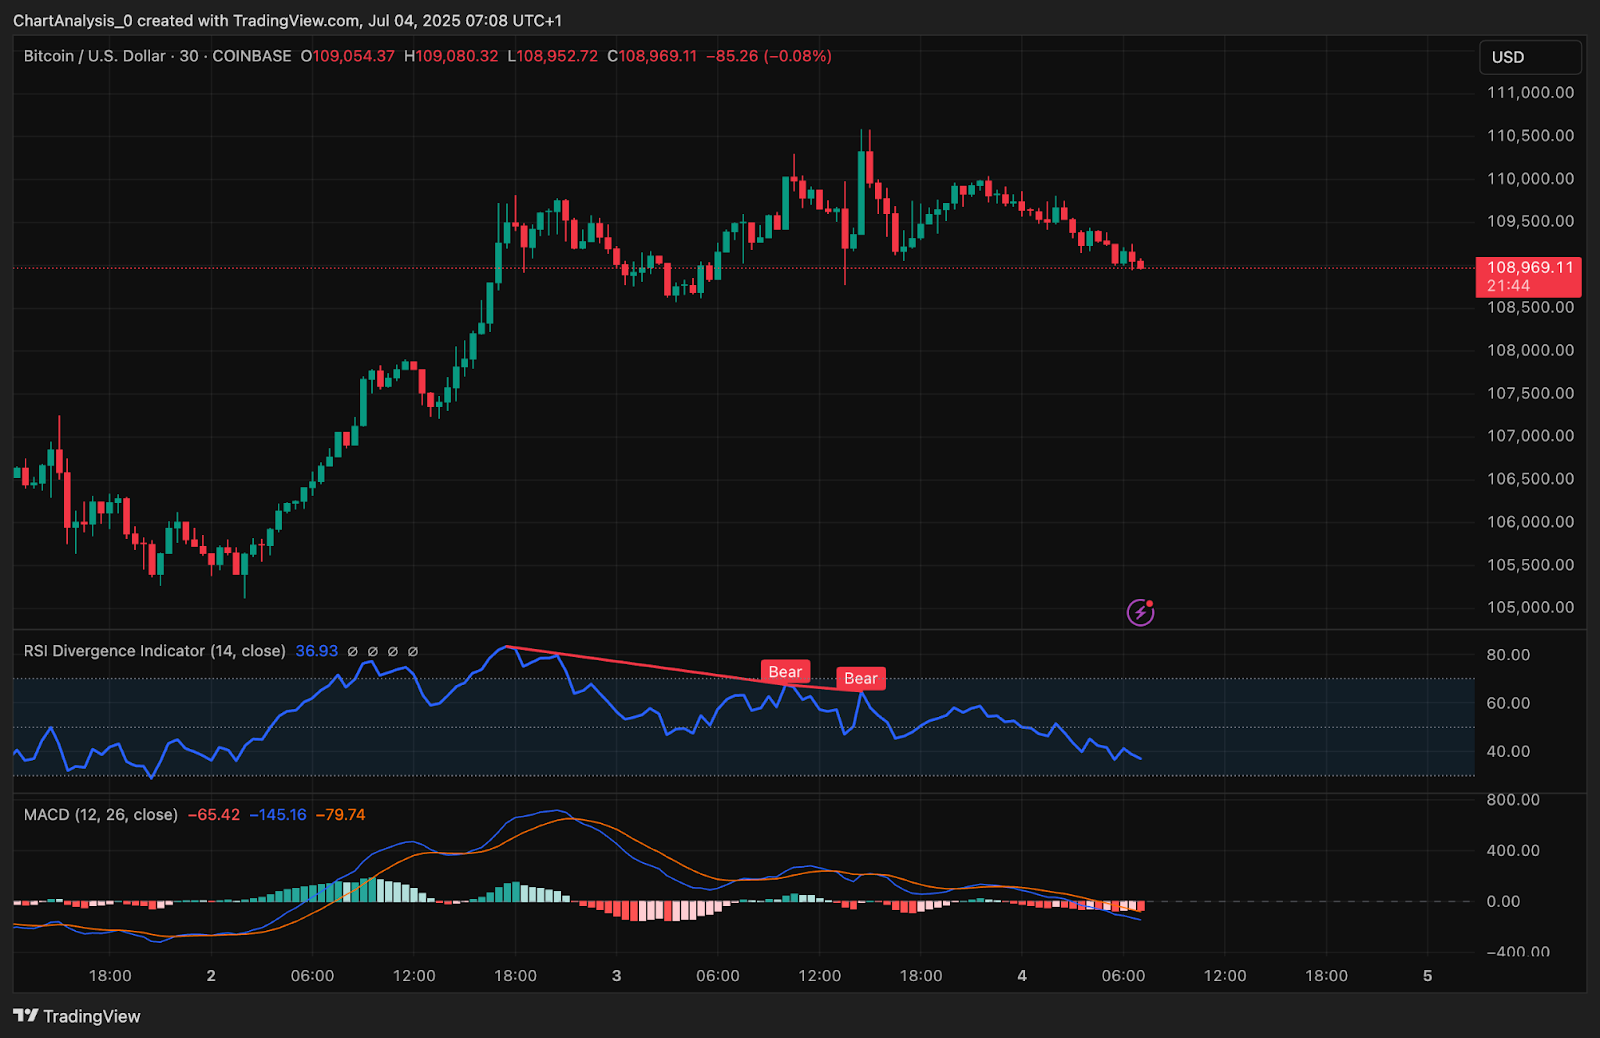
Why Bitcoin price going down today can be attributed to a cluster of bearish divergences and weakening momentum across multiple timeframes. On the 30-minute chart, RSI has formed two lower highs while price made higher highs — a clear bearish divergence. RSI is now trending below 37, indicating weakening strength. Simultaneously, MACD on the same timeframe shows a bearish crossover with widening histogram bars, confirming downside momentum.

On the 4-hour chart, the Supertrend indicator remains bullish but is narrowing, suggesting a potential flip if $108,500 is breached. The DMI shows -DI overtaking +DI, with ADX near 18, reflecting weak trend strength and potential for a short-term reversal.
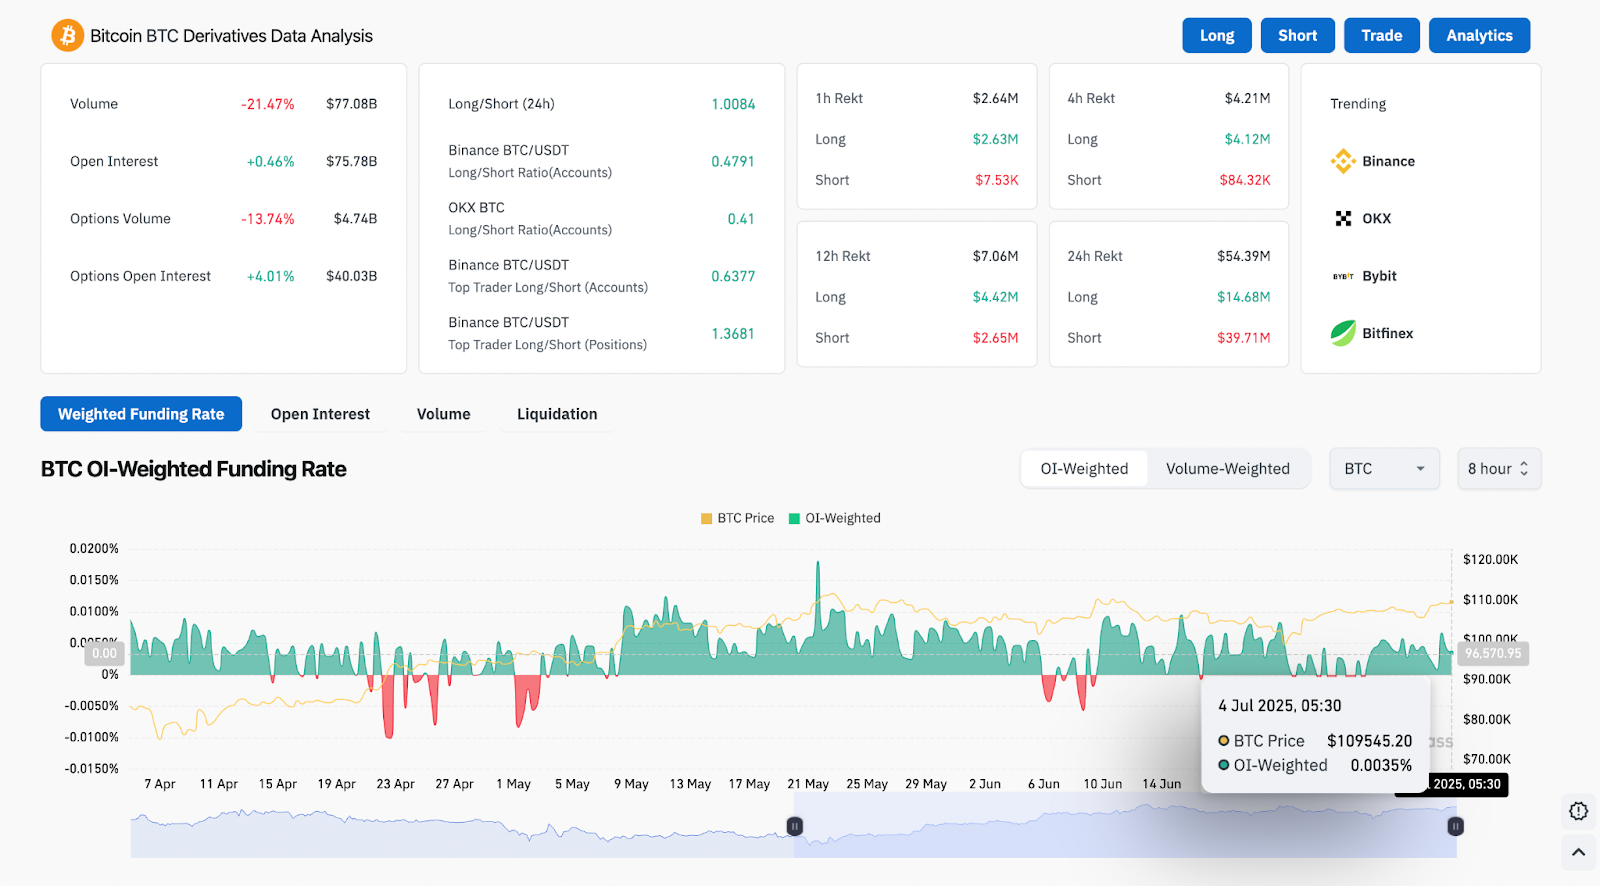
Derivative metrics echo the caution. Despite rising open interest (+0.46%), 24-hour volume is down by 21.47%, and options volume has dropped 13.74%, signaling reduced speculative activity. The funding rate remains slightly positive at 0.0035%, hinting at marginal long bias — but far from aggressive positioning.
BTC Price: Bollinger Band Squeeze Near Resistance Hints At Breakout Trap
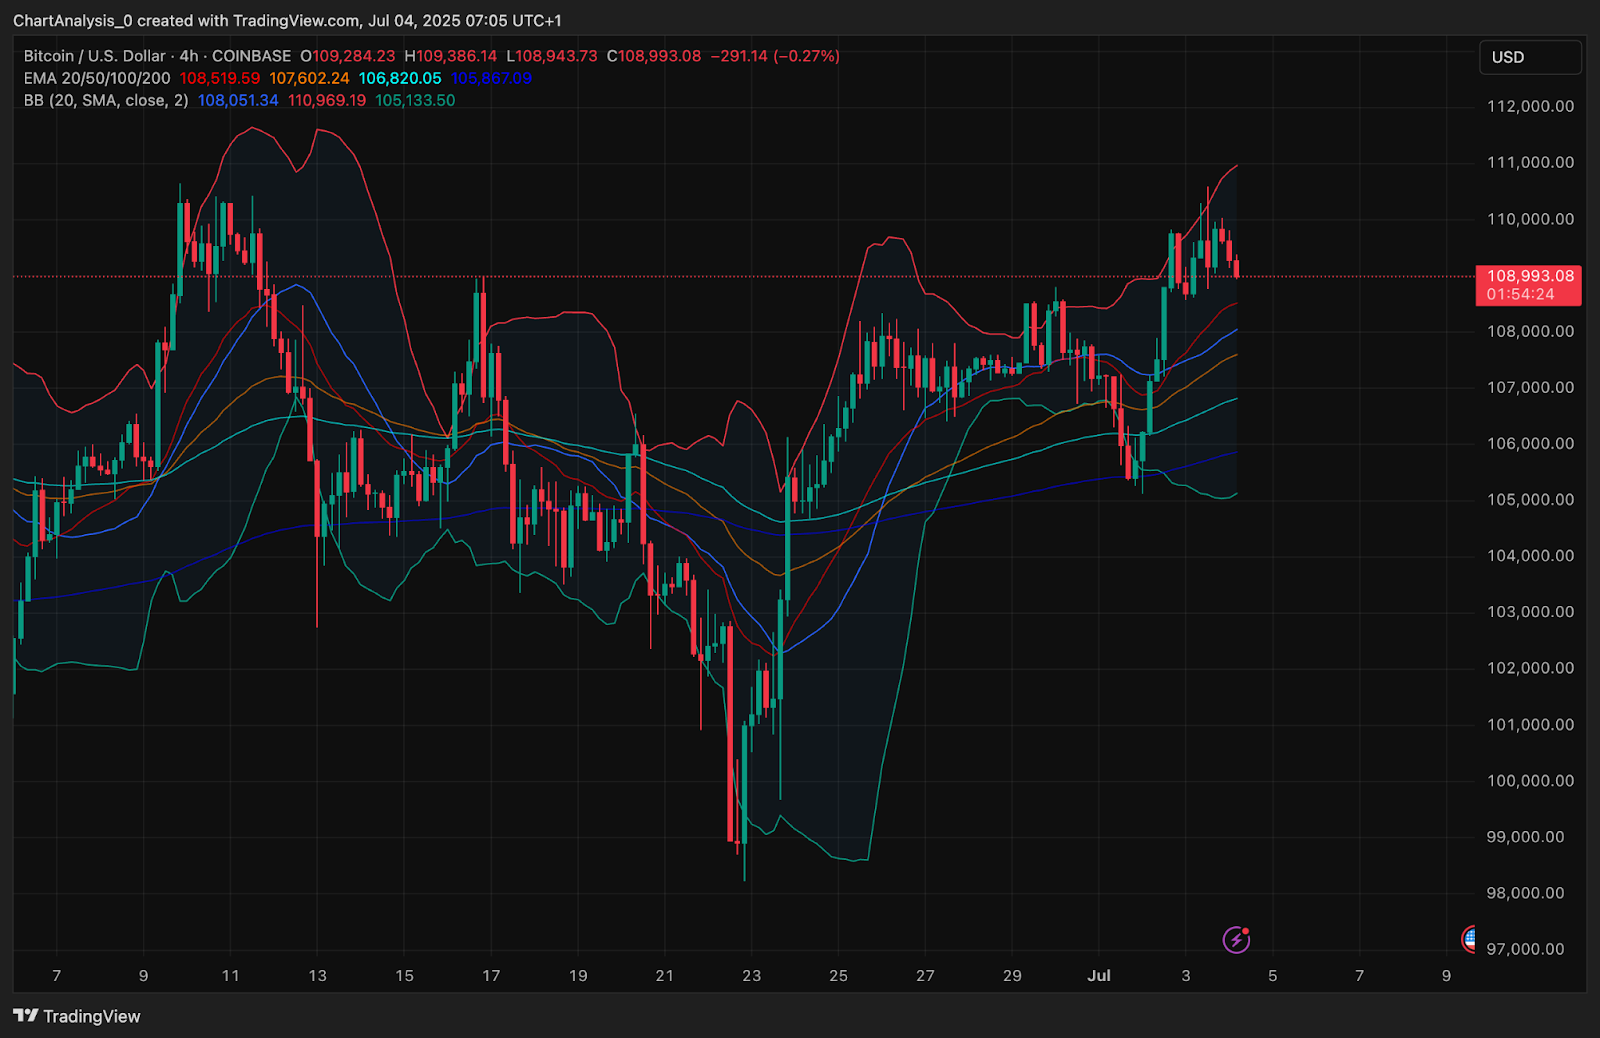
On the 4H chart, Bitcoin price action is hugging the upper Bollinger Band but has started to turn inward. This contraction, paired with declining candle body size and a lack of follow-through above $110K, increases the likelihood of a volatility compression event.
Price is also reacting to the EMA20/50/100 cluster between $106,800 and $108,500. If BTC closes below this band, bears could press for a deeBitcoin price volatility is expected to remain elevated over the next 24 hours. The key pivot is the $108,500 level — if this area breaks, downside targets include the 0.5 and 0.618 Fibonacci zones at $107,854 and $107,209, respectively. These levels also align with previous intraday consolidation zones, making them critical for bulls to defend.
Conversely, a clean push above $109,300 could revive momentum toward $110,600 and the R3 pivot resistance near $110,826. If that is cleared, BTC could accelerate toward R4 near $113,266, but the path remains steep.
Traders should watch the $108,000–$109,300 band closely for directional resolution.per retest of lower channel support near $106,000. On the upside, reclaiming $109,300 with volume confirmation would reassert bullish control and could invite a fresh wave of breakout buyers.
BTC Price Prediction: Short-Term Outlook (24h)
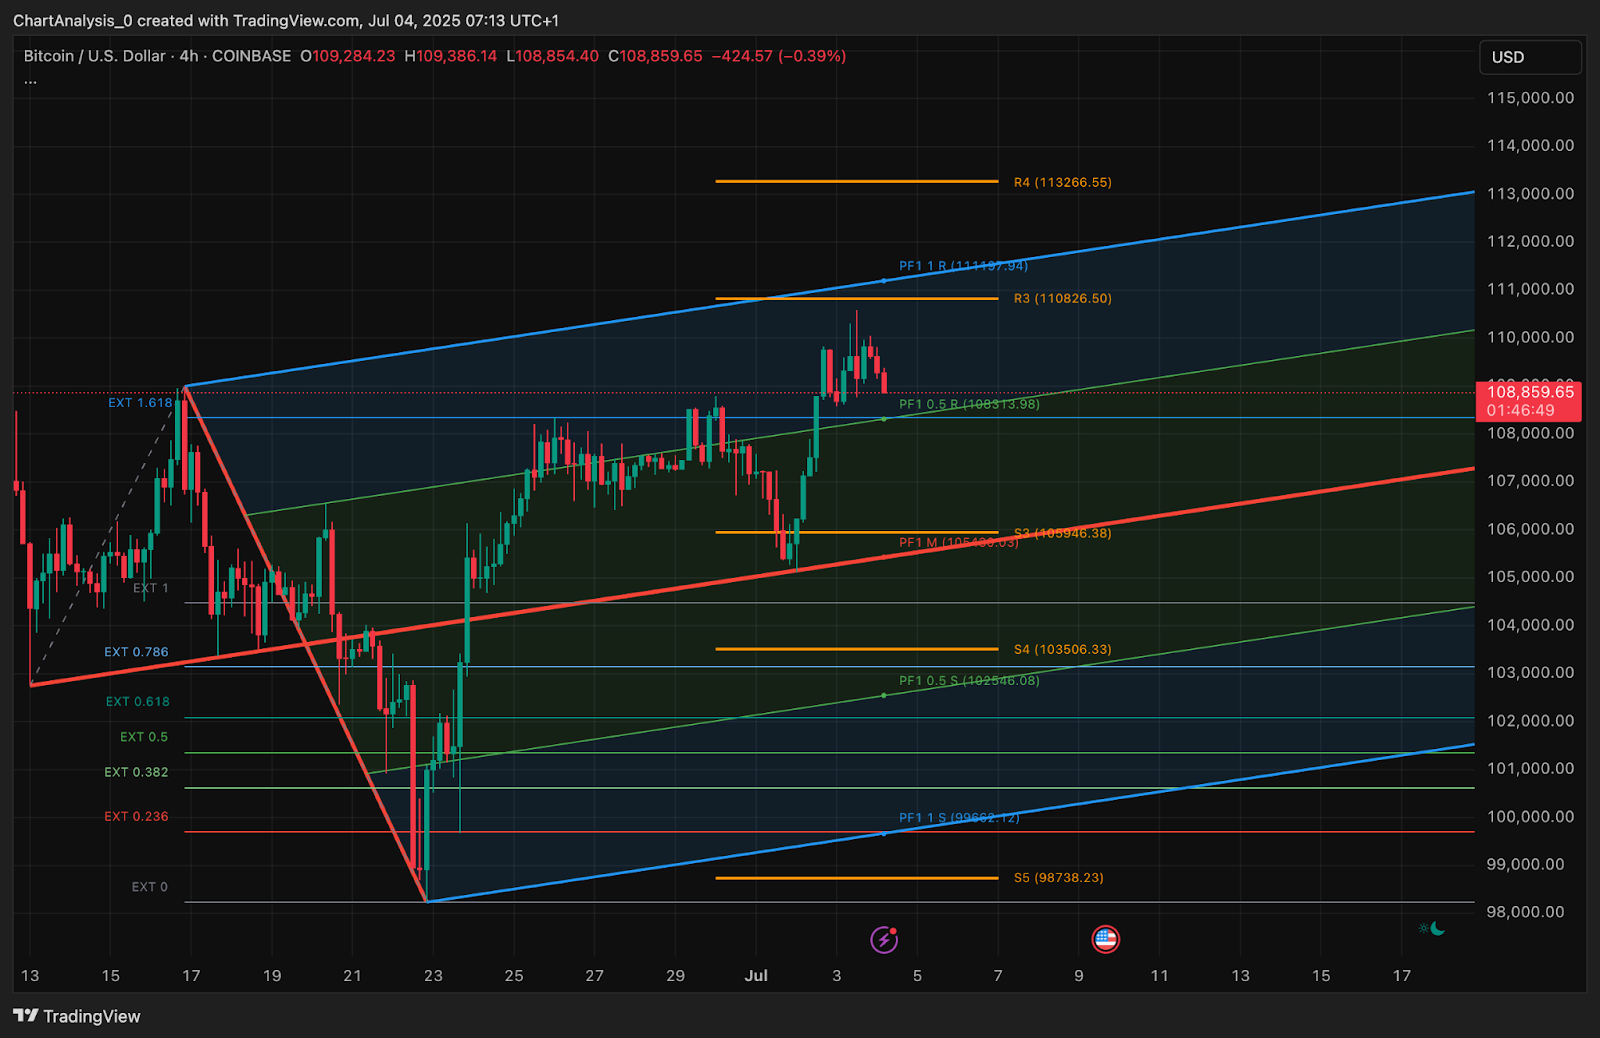
Bitcoin price volatility is expected to remain elevated over the next 24 hours. The key pivot is the $108,500 level — if this area breaks, downside targets include the 0.5 and 0.618 Fibonacci zones at $107,854 and $107,209, respectively. These levels also align with previous intraday consolidation zones, making them critical for bulls to defend.
Conversely, a clean push above $109,300 could revive momentum toward $110,600 and the R3 pivot resistance near $110,826. If that is cleared, BTC could accelerate toward R4 near $113,266, but the path remains steep.
Traders should watch the $108,000–$109,300 band closely for directional resolution.
Bitcoin Price Forecast Table: July 5, 2025
| Indicator/Zone | Level (USD) | Signal |
| Resistance 1 | 109,300 | 0.236 Fib & short-term ceiling |
| Resistance 2 | 110,600 | Previous high, R3 pivot |
| Support 1 | 108,000 | Bollinger Band mid + trendline |
| Support 2 | 107,209 | 0.618 Fib + channel bottom |
| RSI (30-min) | 36.9 | Bearish divergence |
| MACD (30-min) | Bearish | Downward crossover confirmed |
| Bollinger Band (4H) | Tightening | Volatility compression zone |
| Supertrend (4H) | 106,980 | Flip risk below this point |
| DMI (-DI > +DI) | Weak trend | Bear bias increasing |
| OI-Weighted Funding Rate | 0.0035% | Mild long bias |
Disclaimer: The information presented in this article is for informational and educational purposes only. The article does not constitute financial advice or advice of any kind. Coin Edition is not responsible for any losses incurred as a result of the utilization of content, products, or services mentioned. Readers are advised to exercise caution before taking any action related to the company.

 Price Prediction for April 2026: Will Chainlink Move Higher?")
 Price Prediction: Can Bulls Sustain the $0.045 Push?")

