 Price Prediction for July 9")
After a week of tight-range movement, Bitcoin price is hovering around $108,300 as bulls continue to test the upper supply zone between $108,800 and $110,400. Price action remains capped within a well-defined horizontal resistance, but higher lows and bullish market structure suggest a breakout may be brewing. Traders are closely watching whether Bitcoin price today can sustain upward momentum into mid-week.
What’s Happening With Bitcoin’s Price?
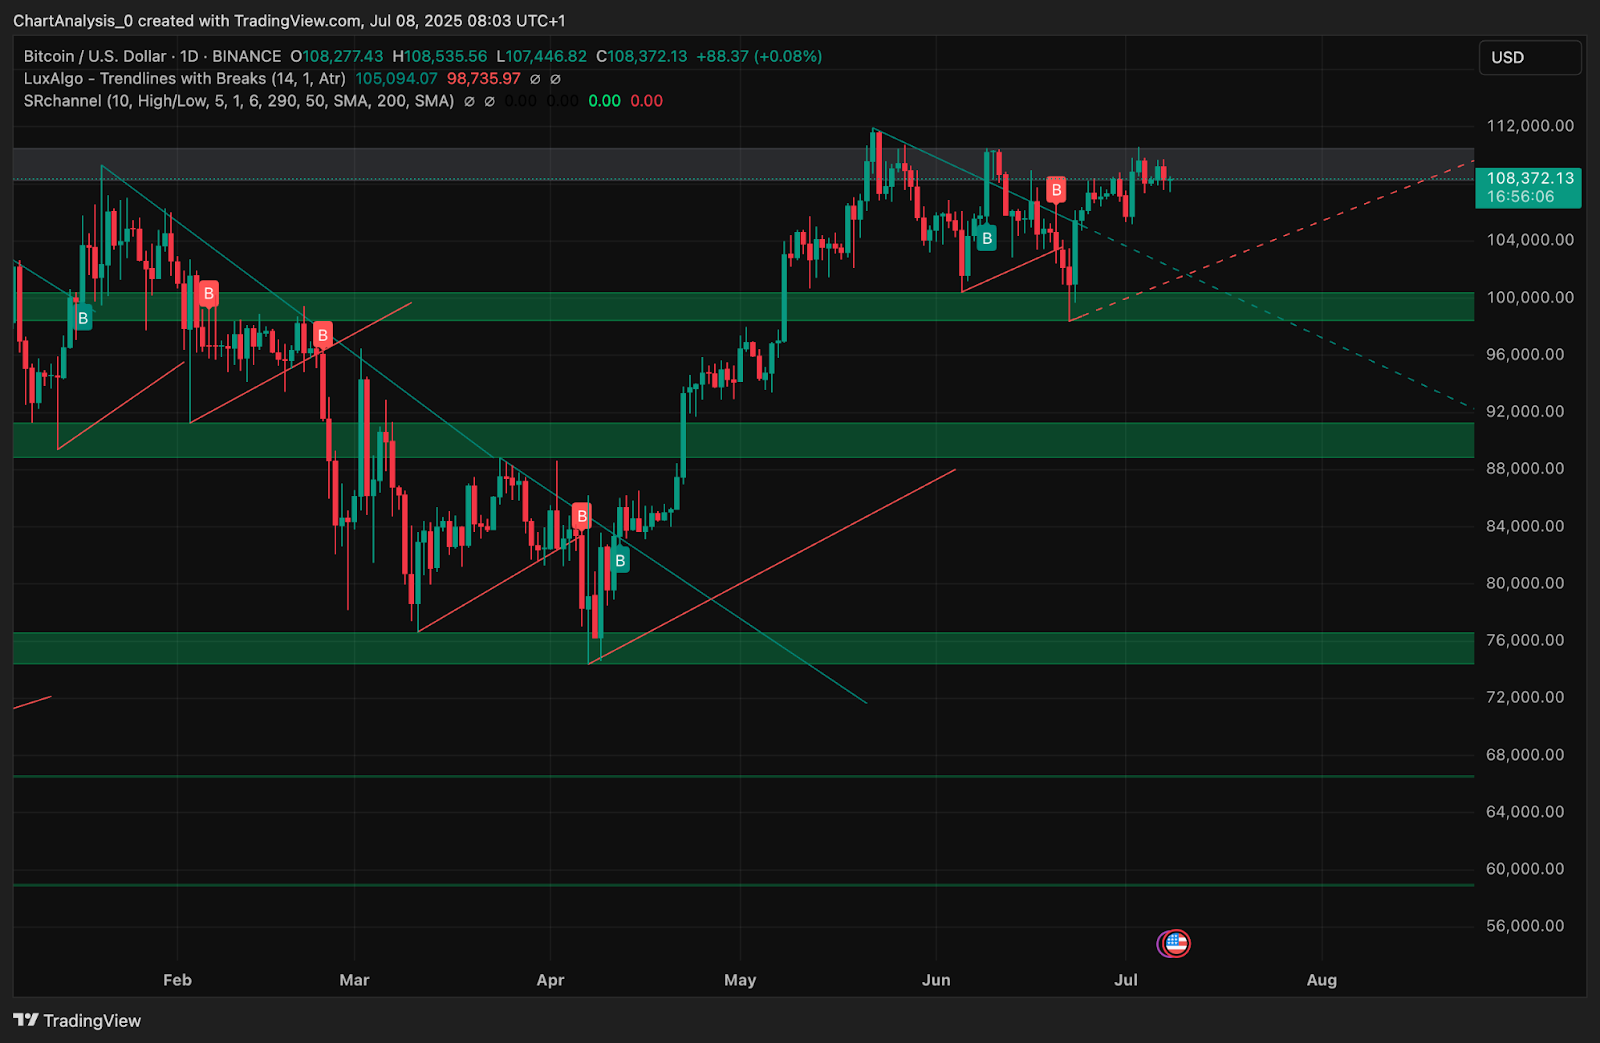
BTC continues to trade inside a compressing range beneath the long-standing resistance band between $109,000 and $110,500. On the daily chart, this zone has repeatedly rejected price since early June. Despite this, buyers have consistently defended the rising trendline from the April lows, while price remains above the 20/50/100 EMAs.
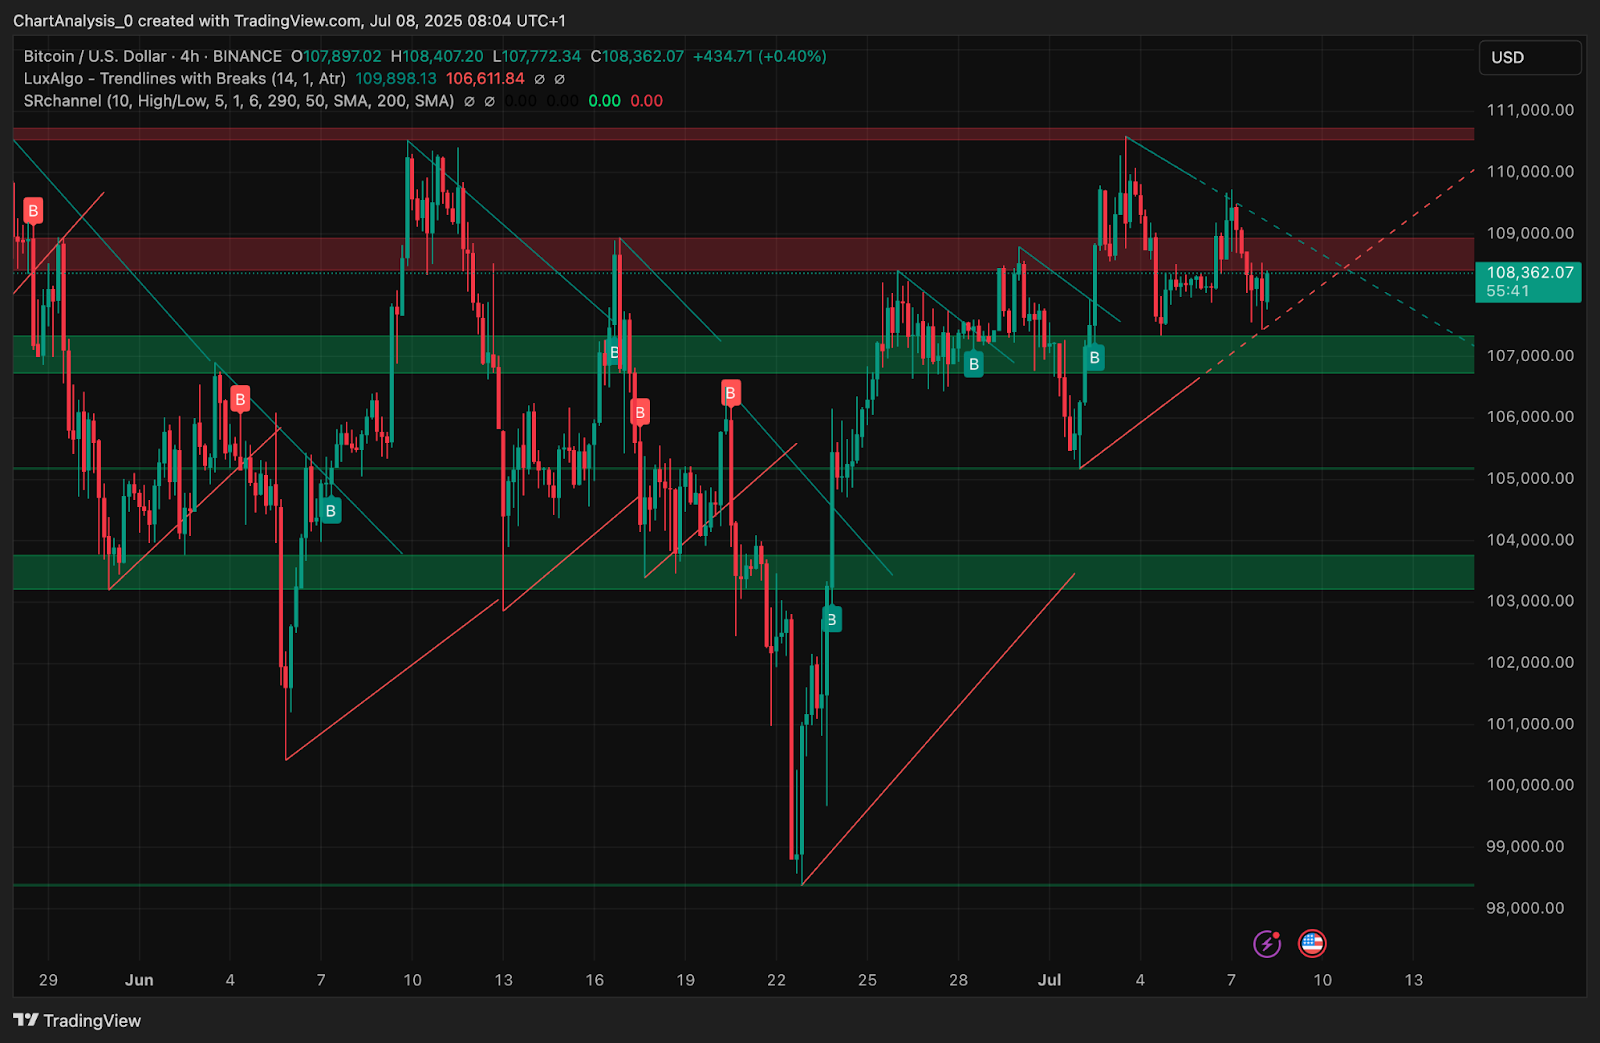
On the 4-hour chart, Bitcoin bounced from the $107,000 demand zone and reclaimed the ascending channel that has held since late June. The move coincides with a bullish order block and trendline confluence, signaling a potential base-building structure for another leg higher.
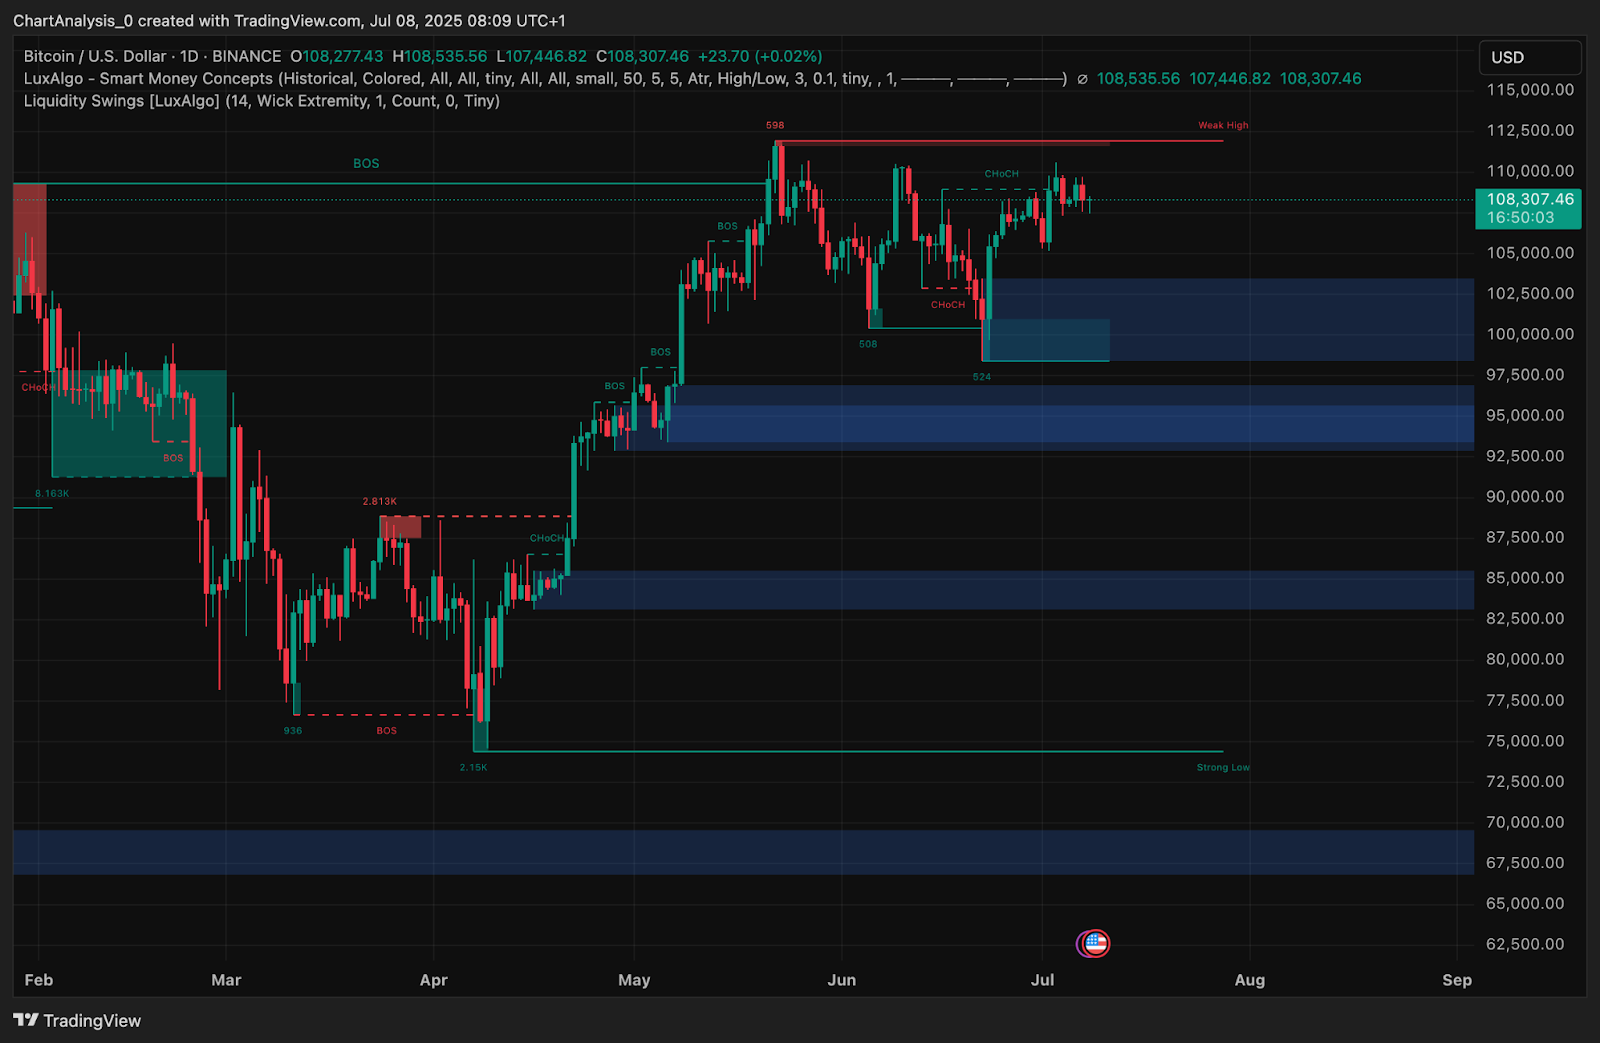
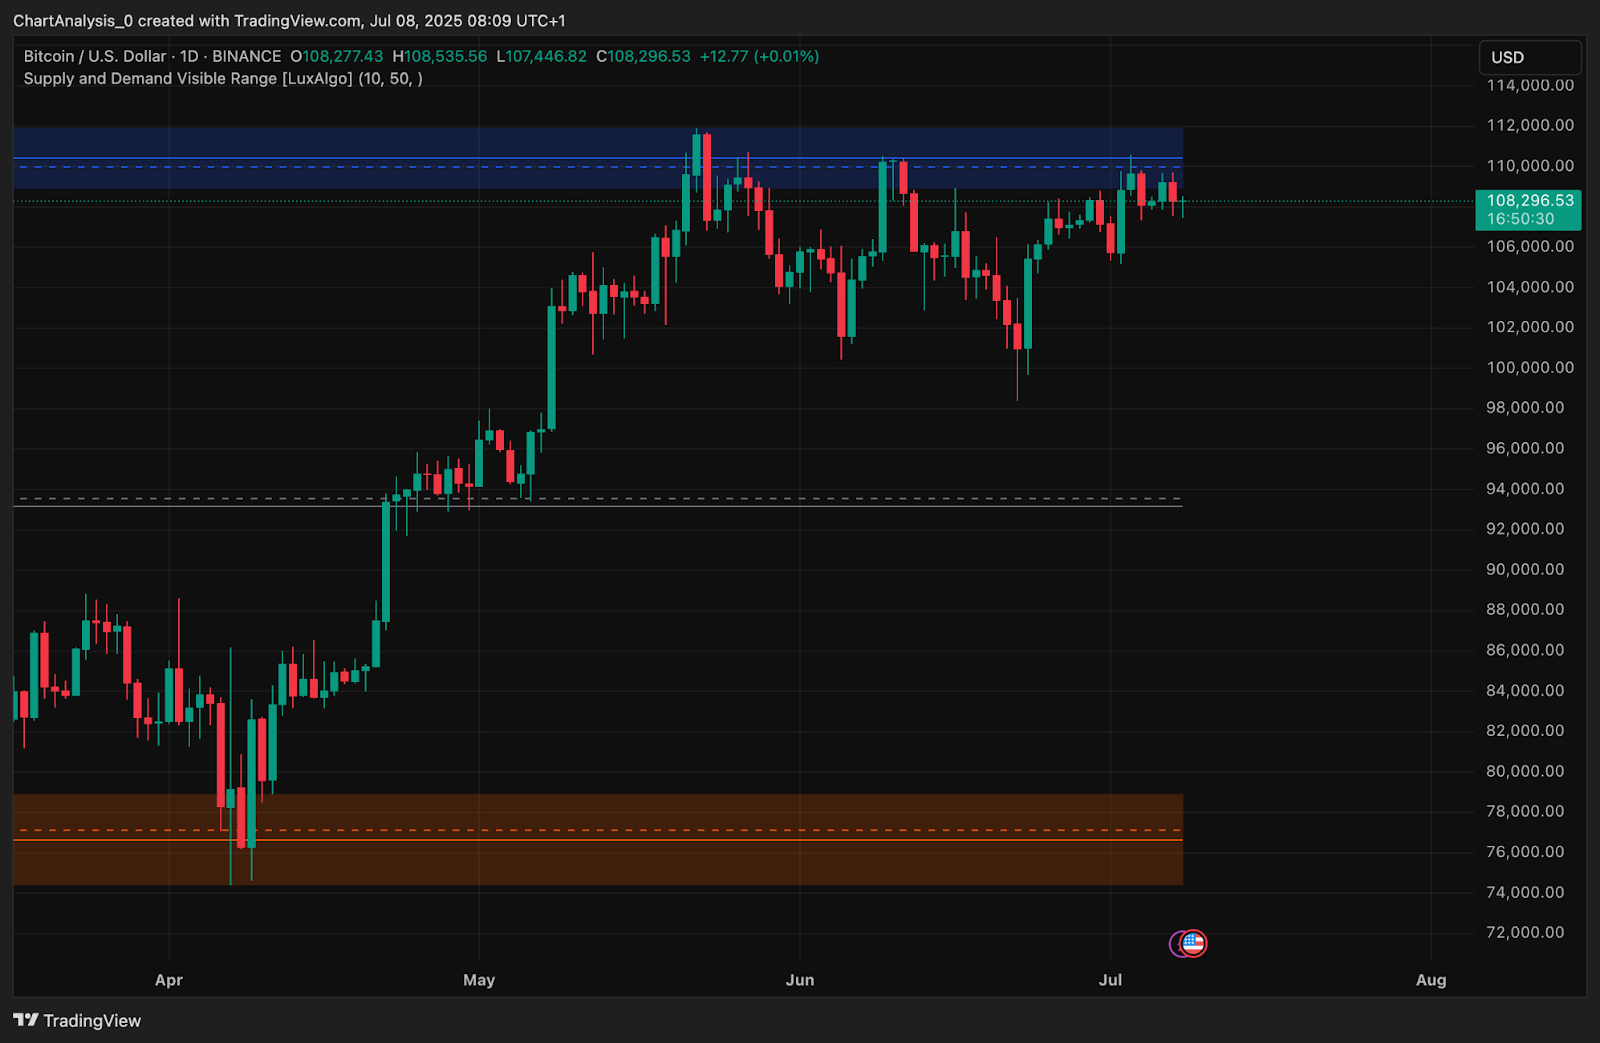
Market structure remains bullish across higher timeframes, with repeated Breaks of Structure (BOS) seen on Smart Money charts. Liquidity remains clustered above $110K, making that level a likely magnet if the current range breaks.
Why Is the Bitcoin Price Going Up Today?
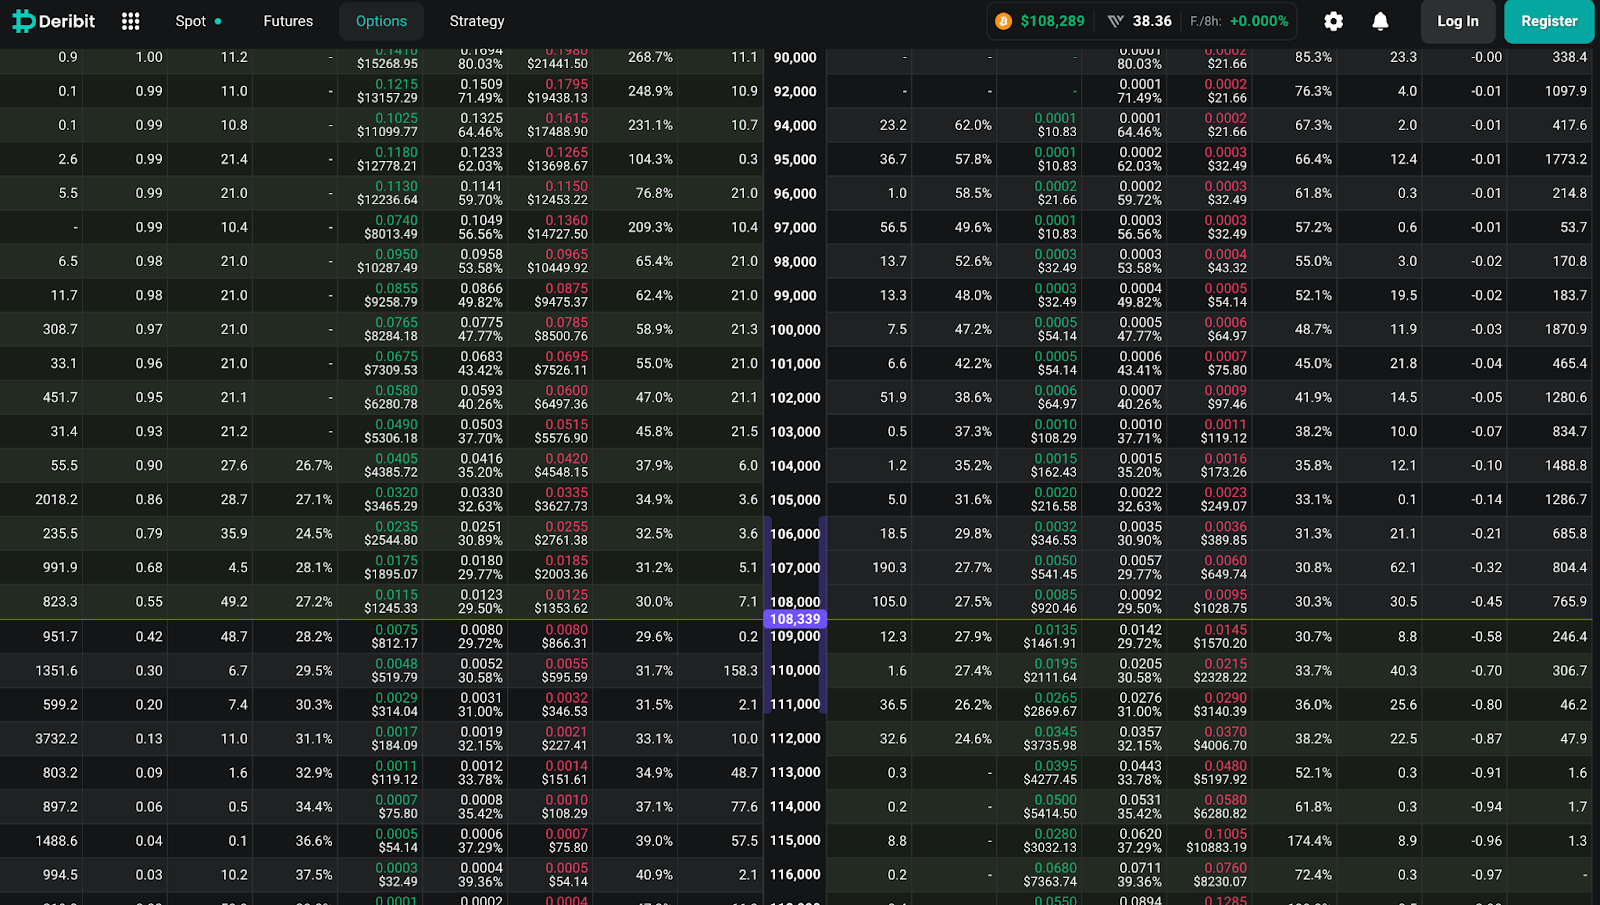
The question of why Bitcoin price going up today finds its answer in both price structure and derivatives data. BTC options data from Deribit shows heavy call interest between $110,000 and $112,000, with notable open interest building at $110K. This suggests speculative bets continue to favor a breakout beyond the immediate resistance band.
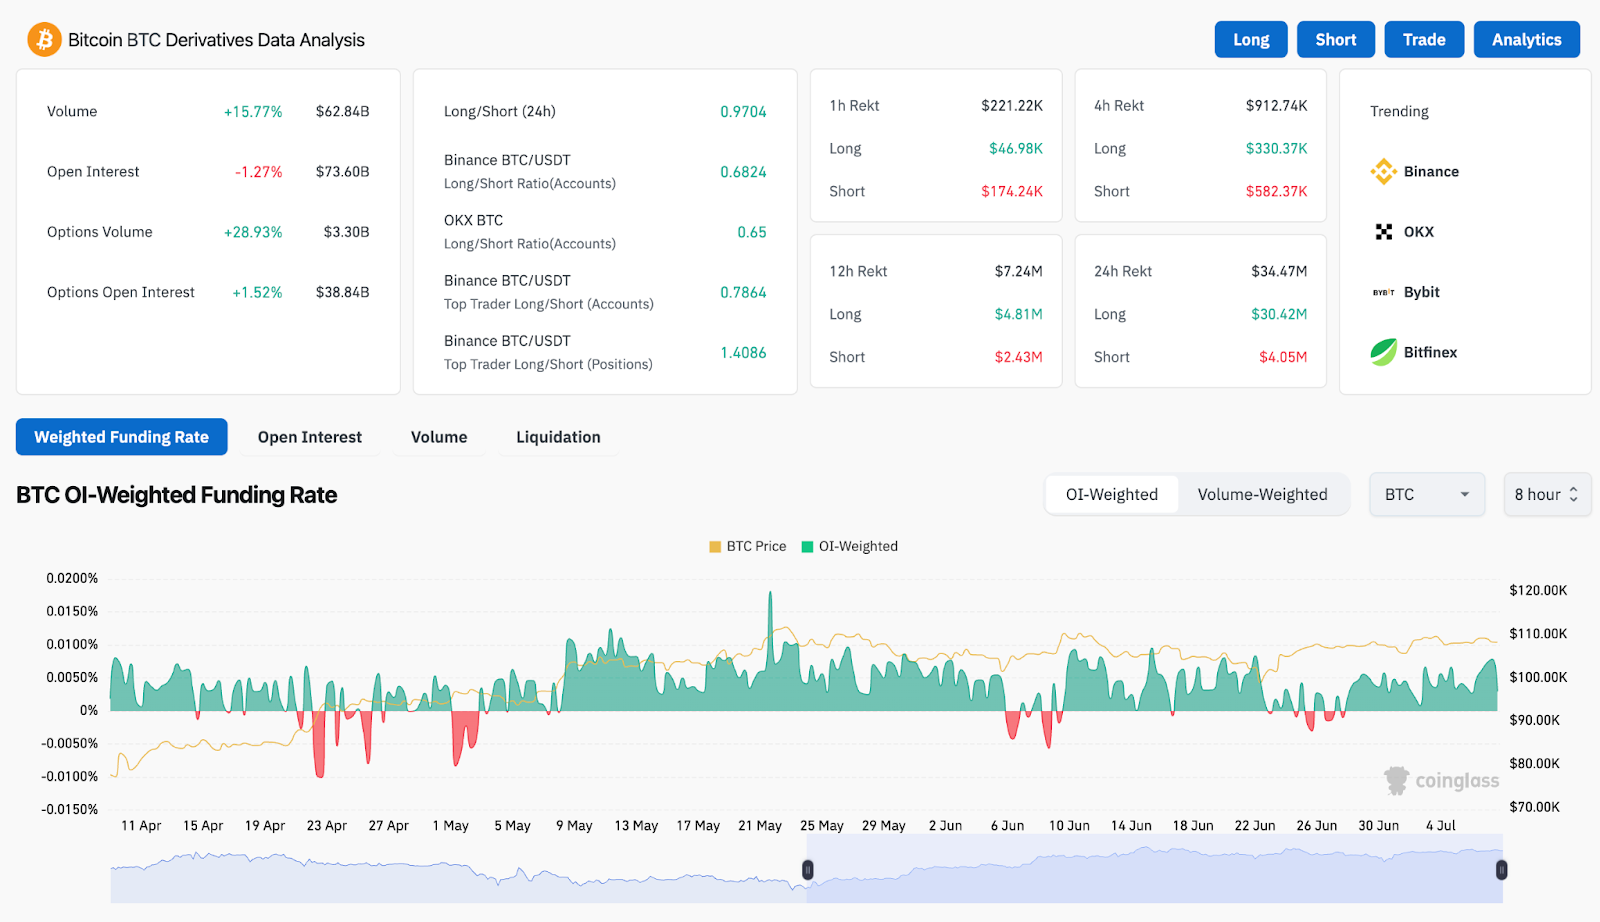
Funding rates remain positive but moderate, showing controlled bullish sentiment. Derivatives volume has risen by 15.7% over the last 24 hours, with options volume jumping nearly 29% — signaling increased directional positioning. Long/short ratios across Binance and OKX remain near neutral, suggesting that the current move is not overly leveraged.
Meanwhile, the Bollinger Bands on the 4-hour chart are tightening again, hinting at another volatility expansion cycle. Price is currently pressing the mid-band near $108,300, and a push through the upper band at $109,250 could reignite bullish continuation.
Bitcoin Indicators Show Coiled Breakout Potential
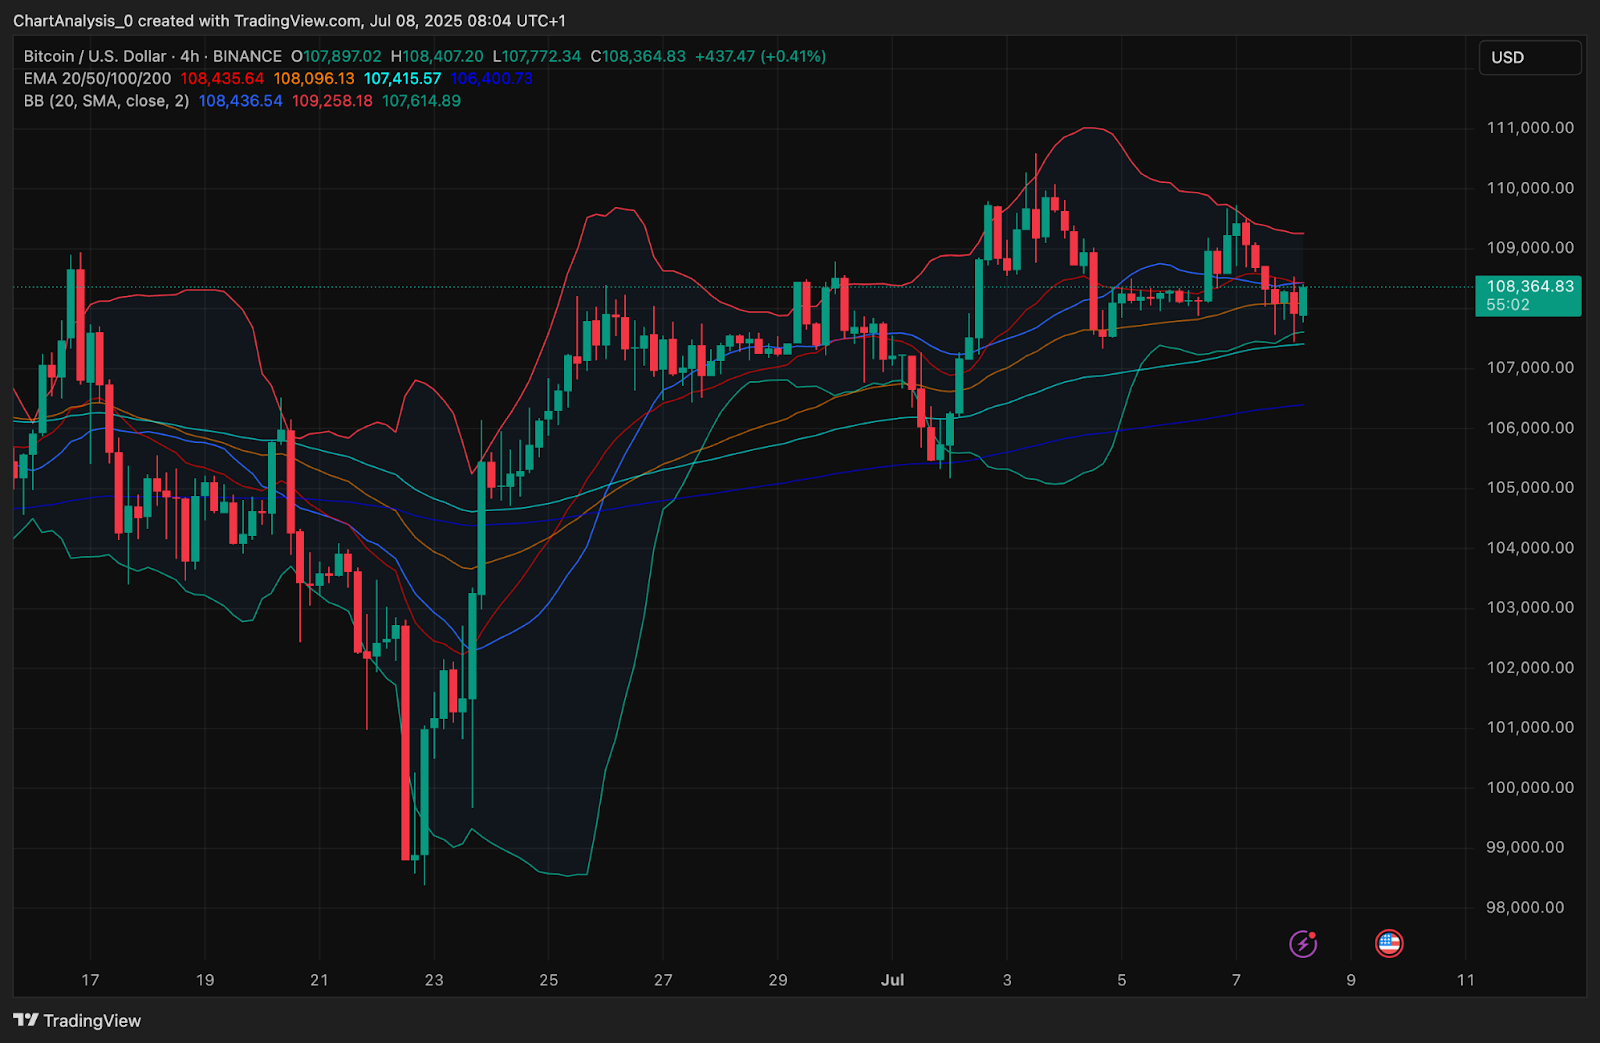
Technicals remain supportive of a breakout scenario as momentum resets just below resistance. On the 4-hour timeframe, Bitcoin price action shows a steady grind above the 100 EMA ($107,415) and 200 EMA ($106,400). The shorter-term 20/50 EMAs are providing immediate support around $108,000–$108,400, creating a bullish cluster.
The Bollinger Bands are narrowing, indicating reduced volatility — a classic precursor to impulsive moves. RSI is neutral at 52, leaving room for further upside without signaling overbought conditions. MACD remains slightly positive but flat, reflecting temporary equilibrium.
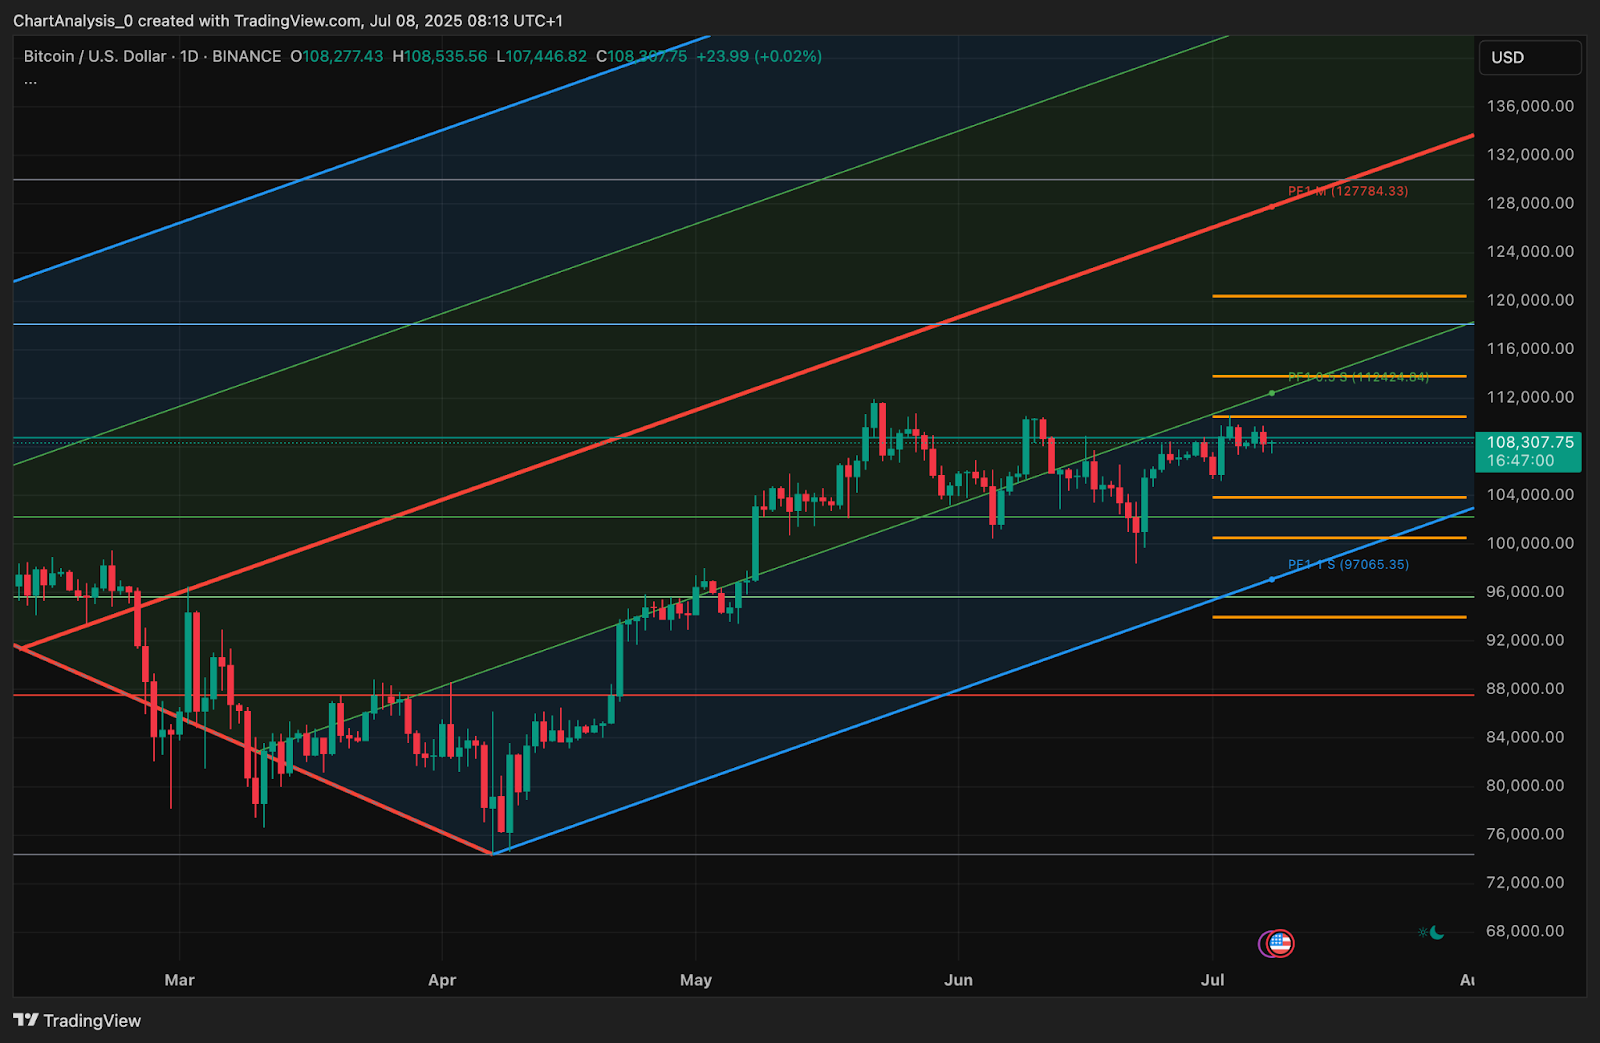
From a broader structure view, BTC is still trading inside a large ascending channel extending from March, with the current level representing a mid-range equilibrium. A clean break above $110,500 could send price toward the channel top near $114,000, while failure to hold $107,000 would risk a slide toward the $104,500–$105,200 support pocket.
BTC Price Prediction: Short-Term Outlook (24H)
For July 9, Bitcoin price is likely to continue oscillating within the $107,000–$110,500 band unless volume spikes decisively. If bulls can close a 4-hour candle above $109,250 with confirmation, the next target becomes $111,200, followed by the $114,000 channel top.
However, failure to defend $107,000 would trigger a revisit of the prior range support near $105,400. Below that, the stronger demand zone around $103,000 could act as a line of defense.
The options market suggests increased bullish bias above $108,000, with clear interest building at $110K and $112K strikes. Traders should watch for volume breakout and potential invalidation of the symmetrical range forming since June.
Bitcoin Price Forecast Table: July 9, 2025
| Indicator/Zone | Level / Signal |
| Bitcoin price today | $108,300 |
| Resistance 1 | $109,250 |
| Resistance 2 | $110,500 |
| Support 1 | $107,000 |
| Support 2 | $105,400 |
| RSI (4H) | 52.0 (Neutral) |
| MACD (4H) | Slightly Bullish |
| Bollinger Bands (4H) | Tightening, breakout possible |
| EMA Cluster (20/50/100/200) | Bullish alignment above $106,400 |
| Options Open Interest (Calls) | Elevated at $110K and $112K strikes |
| Volume (24H) | +15.77% (Derivatives: $62.84B) |
| Smart Money BOS/CHoCH | Bullish with weak high near $110,500 |
| Ascending Channel Support | Intact from April low (bullish bias) |
Disclaimer: The information presented in this article is for informational and educational purposes only. The article does not constitute financial advice or advice of any kind. Coin Edition is not responsible for any losses incurred as a result of the utilization of content, products, or services mentioned. Readers are advised to exercise caution before taking any action related to the company.

 Price Prediction: Can Bulls Reclaim the 0.236 Level?")

 Price Prediction: Can Bulls Break the $329 Barrier?")
