
- Bitcoin’s long-term 200-week SMA ($54,750) remains far below its 2021 peak, a historical bull signal
- The recent sell-off was driven by short-term “hot money,” not long-term holder panic
- Technicals show consolidation as the MACD turns positive, signaling bearish pressure is waning
Bitcoin’s recent decline has raised questions about the bull market’s longevity. Market data and key technical indicators, however, show the general uptrend remains intact.
According to CoinDesk analysis, Bitcoin’s 200-week Simple Moving Average (SMA), a widely tracked long-term trend indicator, remains far below its 2021 peak, signaling that the macro bull market has not yet concluded.
Related: Bitcoin’s Bull Market Is Just Starting: Could $400K Be the Next Stop?
Historical data show that previous bull markets have ended once the 200-week SMA rises to meet or challenge the prior cycle’s high. This occurred in late 2017 and again around late 2021 to early 2022. At present, the 200-week SMA stands at $54,750, while Bitcoin’s 2021 cycle top remains higher, supporting the view that the market is still within its larger bullish structure.
CoinDesk, however, noted this pattern has only been observed twice in Bitcoin’s history.
Why the Recent Sell-Off Was Driven by ‘Hot Money’
Bitcoin’s price has fallen for four straight sessions. This mirrors a broader pattern of muted responses to positive news and heightened sensitivity to negative catalysts.
The decline accelerated after the Federal Reserve’s rate cut, which became a “sell-the-news” event. According to CryptoQuant analyst CryptoOnchain, this was a shakeout led by short-term traders.
Related: CryptoQuant: Bitcoin’s Bull Market Is Early, Buying Dips Still Smart
Data from Binance recorded over 10,000 BTC inflows on October 30. These inflows came primarily from addresses holding coins for less than 24 hours. The analyst described this as a “shakeout” led by “hot money,” not an exodus of long-term investors.
Bitcoin Technical Indicators Show Consolidation
As of press time, Bitcoin traded at $109,779, down 0.94% over the past 24 hours, with a market capitalization of $2.19 trillion. The RSI stands at 45.32, suggesting neutral momentum but delayed recovery from oversold conditions. Meanwhile, the MACD line at 1,077.40 is closing in on the signal line at 1,151.11, and the histogram turning positive at 73.70 implies waning bearish pressure.
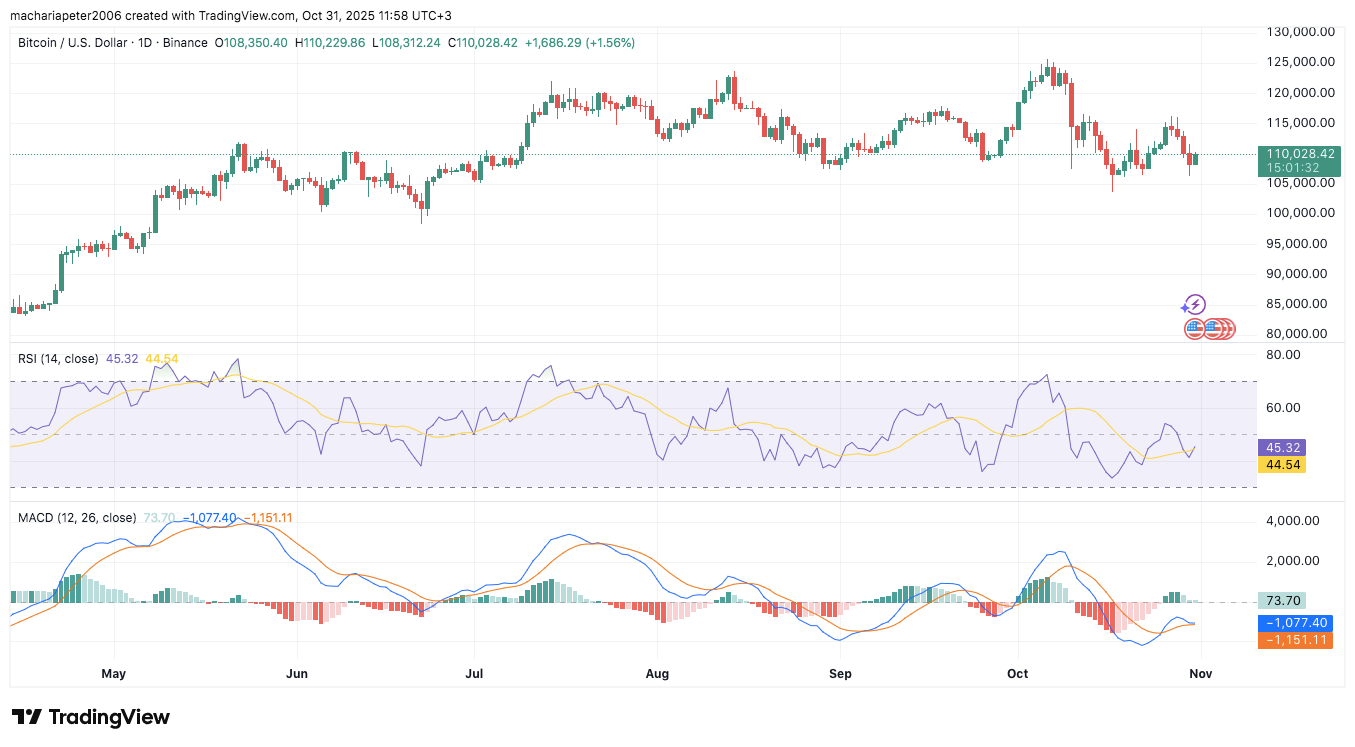
If the RSI breaks above 50 and the MACD confirms a bullish crossover, Bitcoin could retest resistance between $115,000 and $118,000. Failure to hold $108,000 may drive a pullback toward $102,000, signaling continued short-term consolidation within a longer-term bullish structure.
Disclaimer: The information presented in this article is for informational and educational purposes only. The article does not constitute financial advice or advice of any kind. Coin Edition is not responsible for any losses incurred as a result of the utilization of content, products, or services mentioned. Readers are advised to exercise caution before taking any action related to the company.


