
- Bitcoin is very close to the 20-day EMA which stands at $97,141.
- Bitcoin is currently in a bullish phase of the cycle and could soar to a new ATH soon.
- If BTC reclaims the 20-day EMA and breaks out of the upper BB, $100K is likely.
Bitcoin (BTC) is once again at a turning point. The latest chart shared by “Mags” on X platform takes a look at the digital asset’s long-term cycle and its possible next phase. The chart zeroes in on Bitcoin’s cyclical nature, especially its price moves around halving events.
According to a Mag’s post, Bitcoin usually follows a fairly predictable pattern. It kicks off with the halving event, then a strong rally, hitting a peak before a bear market takes over.
Finally, once the cryptocurrency hits rock bottom in the bear market, it turns bullish again with the next halving event.
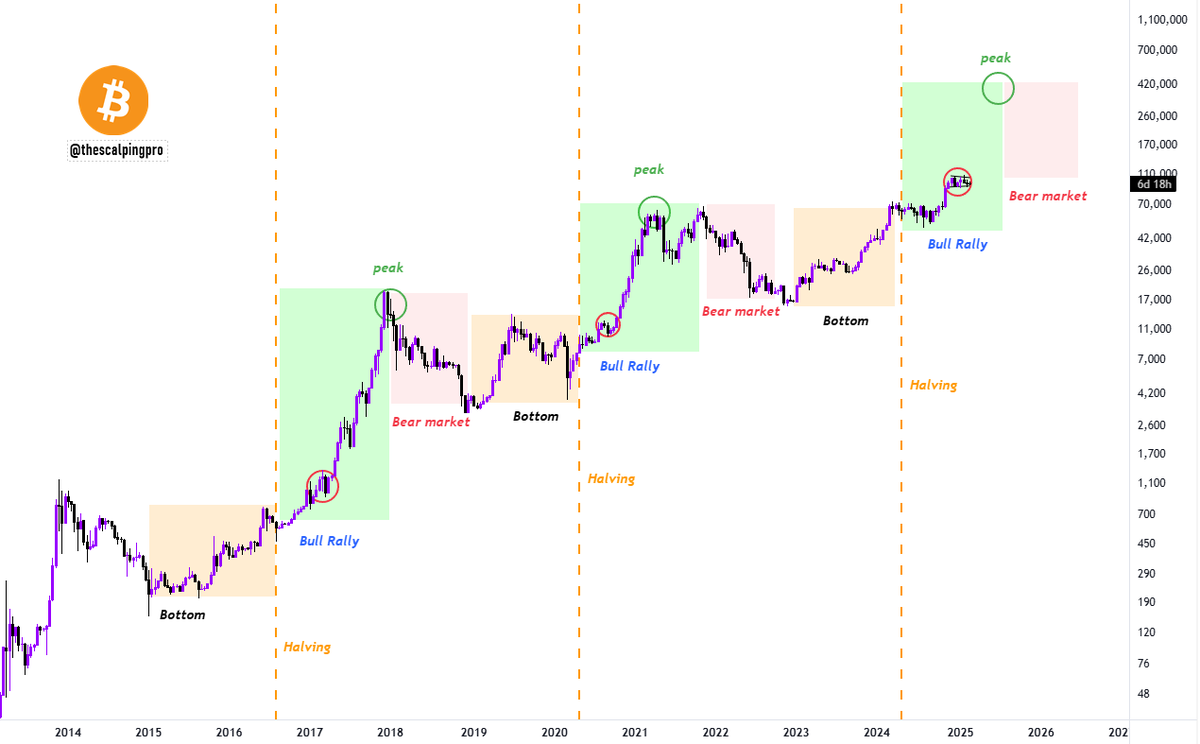
Halving Events: Fueling Bitcoin’s Cyclical Rallies
This cycle has played out multiple times in the past, and it looks like BTC is in the bull rally phase after the 2024 halving. Historically, each halving kicks off a supply shock, often leading to a huge rally before prices peak, followed by a bear market.
Looking at “Mags’” chart, BTC is getting close to a phase similar to previous bull runs, pointing towards a potential price surge.
Related: Negative Crypto Sentiment: Bitcoin’s Booster?
If history repeats itself, Bitcoin could be aiming for a new all-time high (ATH) before the next bear market hits.
Right now, BTC is trading around $95,600, down almost 1% over the last day and 12.5% from its ATH of $109K.
Bitcoin Price Analysis: Key Levels to Watch
It is important to note that Bitcoin’s immediate resistance is around the 20-day Exponential Moving Average, currently at $97,141. If BTC can get back above this level and confirm it as support, investors might see the market leader climb above $100,000 soon.
The chart provided by TradingView shows that Bitcoin’s price path is currently near the middle of the Bollinger Bands. The upper BB is at $98,090, and the lower BB is at $95,152.
Interestingly, price stability near the middle band suggests a possible breakout in either direction. The upper BB is acting as resistance, while the lower BB is acting as support.
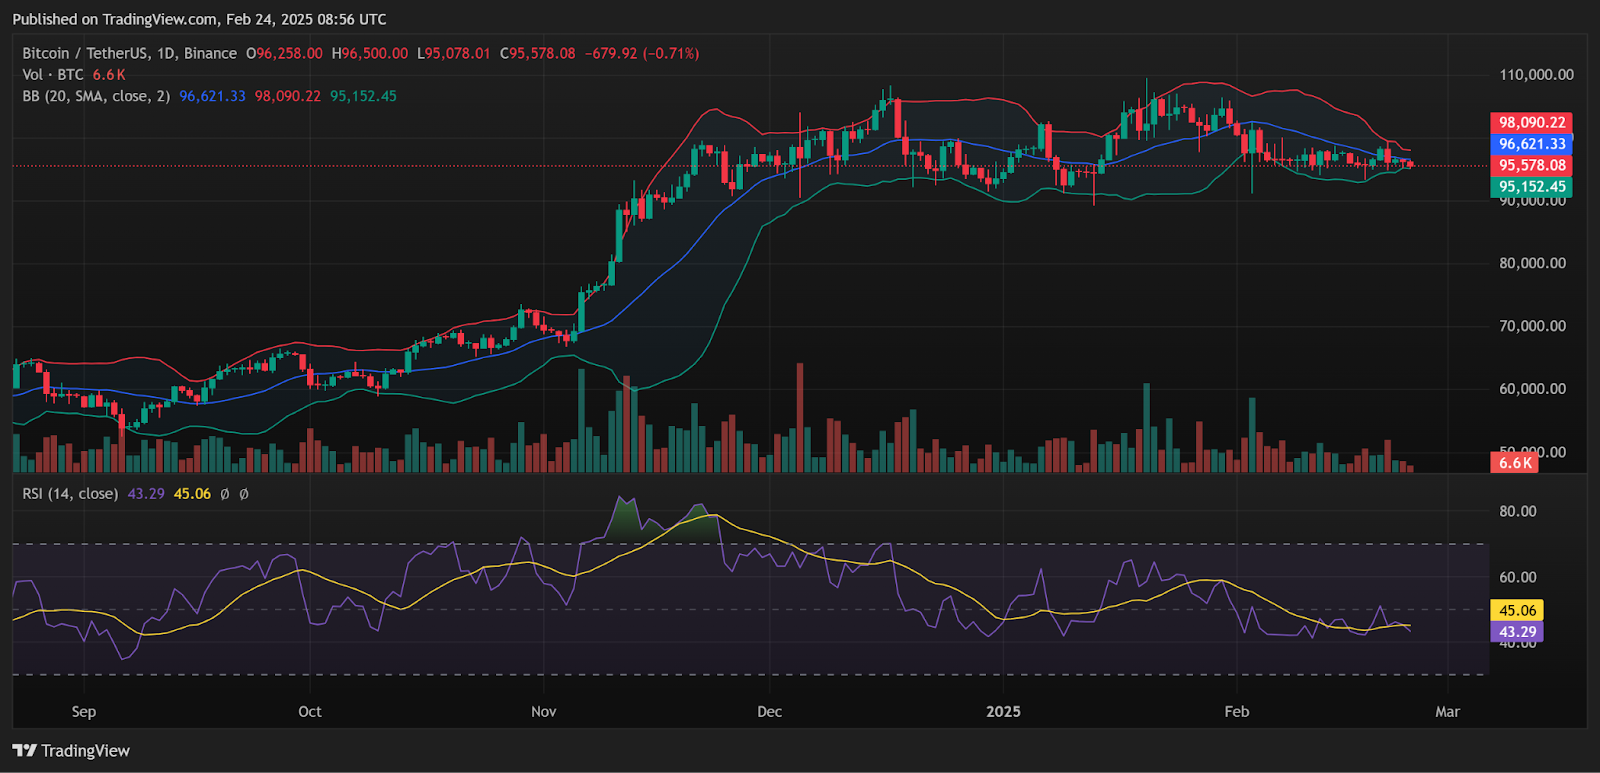
The Relative Strength Index (RSI) is currently at 43.29, meaning BTC is neither overbought nor oversold. If the RSI climbs above 50.
Related: Bitcoin’s Range-Bound Trading Ethereum Could Benefit, Analysts Say
it could signal stronger bullish momentum. However, if it drops below 40, BTC could experience a short-term price drop.
Disclaimer: The information presented in this article is for informational and educational purposes only. The article does not constitute financial advice or advice of any kind. Coin Edition is not responsible for any losses incurred as a result of the utilization of content, products, or services mentioned. Readers are advised to exercise caution before taking any action related to the company.


