
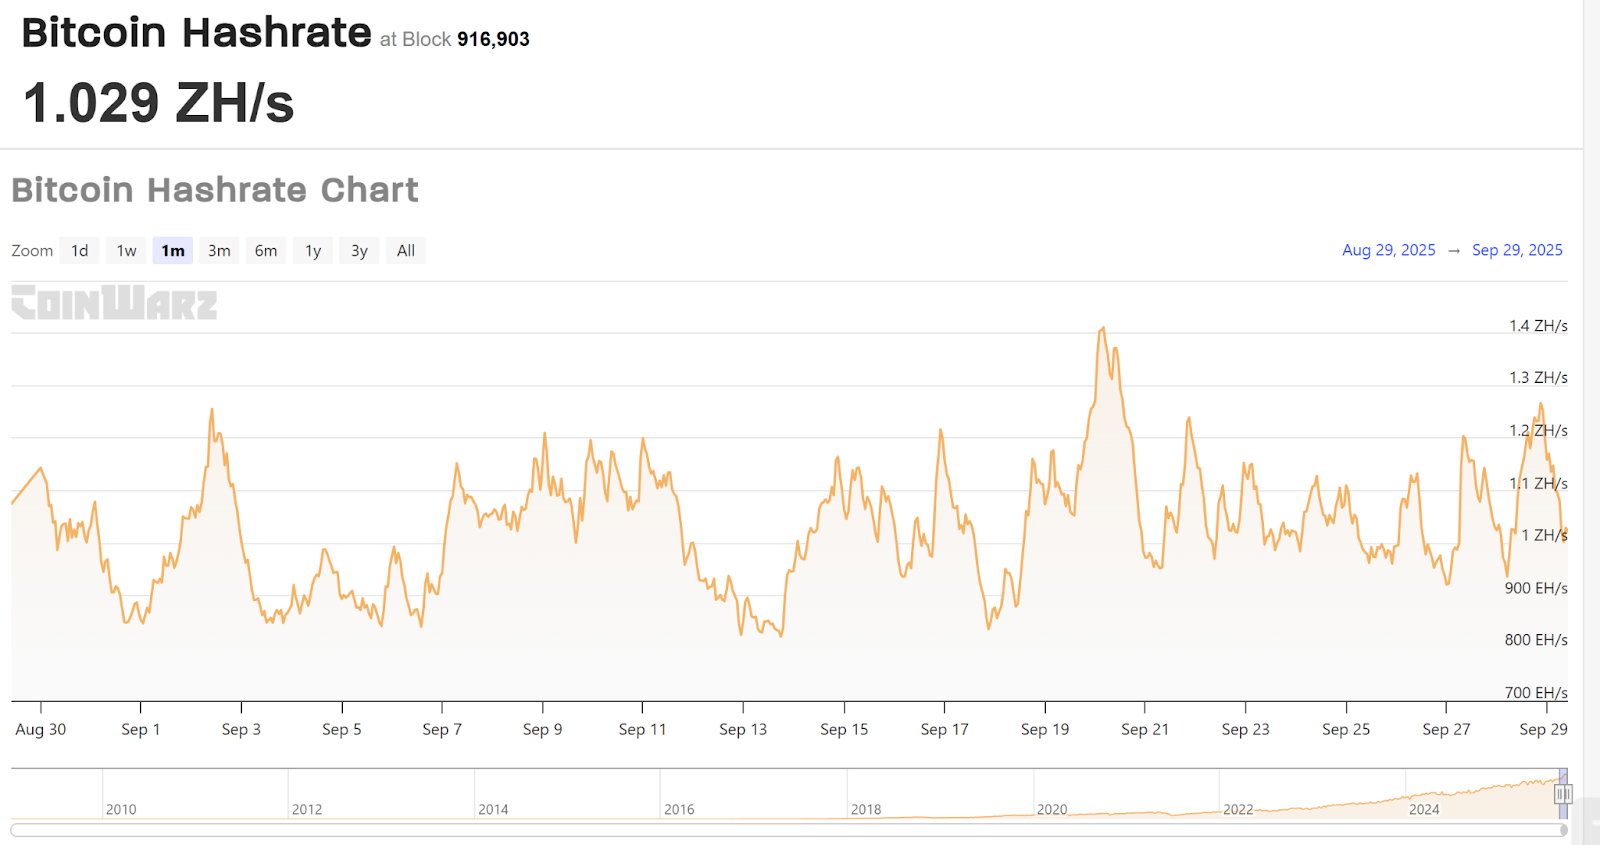
- Bitcoin hashrate hit a new ATH of 1.2 ZH/s, showcasing industrial-scale mining growth.
- Negative funding rates and SOPR ratio suggest short-term capitulation and long-term conviction.
- BTC broke out of a descending wedge with bullish RSI, CMF, and volatility signals.
Bitcoin has just reached another historic milestone, with its hashrate climbing to a new all-time high of 1.2 zetahashes per second (ZH/s) before settling near 1.039 ZH/s.
This major record shows the growing industrial scale of Bitcoin mining and sets the stage for what could be a critical period for BTC’s price action.
Hashrate Surge Highlights Mining Industry Evolution
Hashrate is more than a measure of network security, it reflects the enormous infrastructure powering Bitcoin.
Achieving a zetahash requires years of investment, i.e., setting up large-scale facilities, negotiating energy contracts equivalent to powering entire towns, and deploying fleets of specialized mining rigs.
But with hashrate surges come tighter margins. Bitcoin’s protocol adjusts mining difficulty every 2,016 blocks, ensuring a steady block cadence.
When hashrate spikes, difficulty ratchets up, compressing miner economics until only the most efficient operators, those with low-cost power and advanced fleets, can sustain profits.
Hashrate at record levels signals an industry that is both highly committed and fiercely competitive, far from a 2022-styled crypto winter.
On-Chain Data Signals Shifting Momentum
CryptoQuant data shows the 72-hour Funding Rate (FR72h) has dipped into negative territory. Historically, this has been an early sign that sellers may be exhausting, creating conditions for a potential upward squeeze as momentum shifts to buyers.
At the same time, the SOPR ratio, comparing long-term to short-term holder realized profits, has dropped back near 1.5.
It is clear that short-term holders are realizing deeper losses while long-term holders remain steady, a dynamic seen before major rebounds in late 2024. Historically, such setups often align with price bottoms.
Bitcoin Price Analysis: BTC Breaks Bullish Pattern
On shorter timeframes, Bitcoin has broken out of a descending wedge on the 3-hour chart, a typically bullish reversal formation.
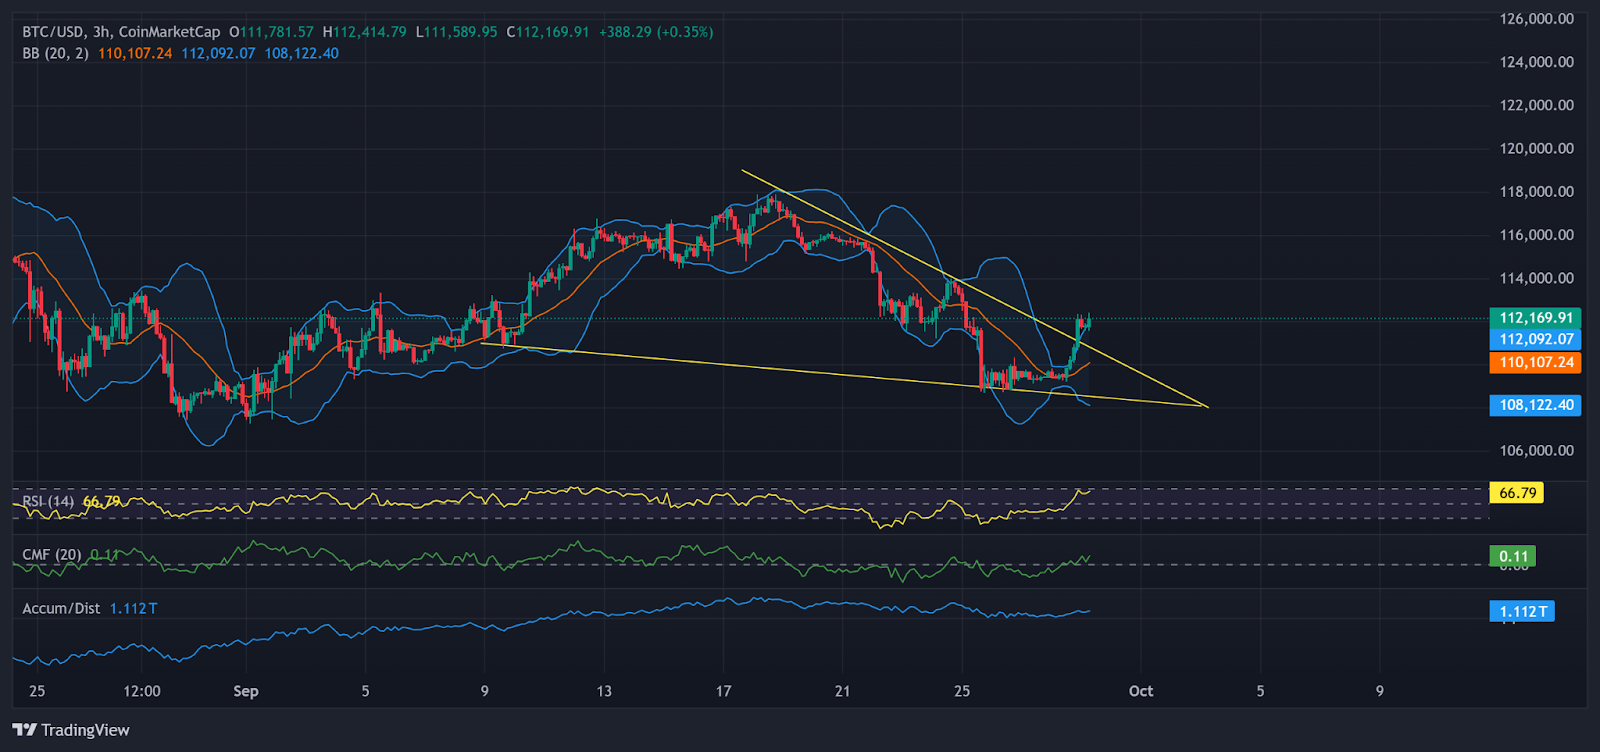
Price action has surged above the upper trendline, supported by the RSI at 66.79 and the CMF at 0.11, confirming positive capital inflow.
Immediate resistance lies near $114,000–$116,000, with an extension toward $120,000 if momentum holds. However, failure to sustain above the breakout zone ($112,000) could send BTC back to $110,000 or even test support near $108,000.
Disclaimer: The information presented in this article is for informational and educational purposes only. The article does not constitute financial advice or advice of any kind. Coin Edition is not responsible for any losses incurred as a result of the utilization of content, products, or services mentioned. Readers are advised to exercise caution before taking any action related to the company.


 Price Prediction: Weak Momentum Signals Possible Drop to $62K")