
- Bitcoin dropped to the $82,000 price level resulting in $769.61 million in liquidations.
- Robert Kiyosaki remains bullish on Bitcoin, stating that he continues to buy the dip.
- If Bitcoin holds above $85,000, a retest of $94,877 is very likely in the near future.
Top digital asset Bitcoin (BTC) fell to the $82,000 price level yesterday, but buyers jumped in, stopping the cryptocurrency from going under $80,000.
Right now, BTC is trading at $85,747.56, a decrease of more than 3% since yesterday, CoinMarketCap data shows. This negative feeling was made stronger by the Fear and Greed Index falling to 10.
Extreme Fear Grips Bitcoin Market
Based on data from alternative.me, the Bitcoin Fear and Greed Index dropping to 10 signals “extreme fear” among investors.
Interestingly, this level of fear is not as high as during the FTX collapse in November 2022, when Bitcoin traded under $20,000. Even with the current selloff, Rich Dad, Poor Dad author Robert Kiyosaki stayed positive on BTC. In an X post, Kiyosaki said that he sees the current Bitcoin price decline as a buying opportunity rather than a cause for concern.
He reaffirmed his belief in BTC as a hedge against traditional financial systems, which he claims are full of excessive debt and economic instability. “When Bitcoin crashes, I smile and buy more,” Kiyosaki stated, while adding that BTC is “money with integrity.”
Bitcoin Price Plunge Triggers Massive Liquidations
It is important to note that the Bitcoin price plunge resulted in liquidations worth $769.61 million in the past 24 hours.
As per Coinglass data, $606.44 million in longs and $163.19 million in shorts were wiped off from the digital asset space as BTC dipped to $82,000 briefly. Also, over 185,715 traders were liquidated.
Related: Bitcoin Price Prediction: $90K Break – Dip or Rebound Next?
Technical Analysis: Bitcoin at Key Support Level
Looking at the daily chart from TradingView below, Bitcoin recently broke below the middle Bollinger Band, showing more selling pressure.
The price is now close to the lower band, which often acts as dynamic support. If BTC stays above this level, a short-term bounce back toward the middle band (around $94,877) is possible.
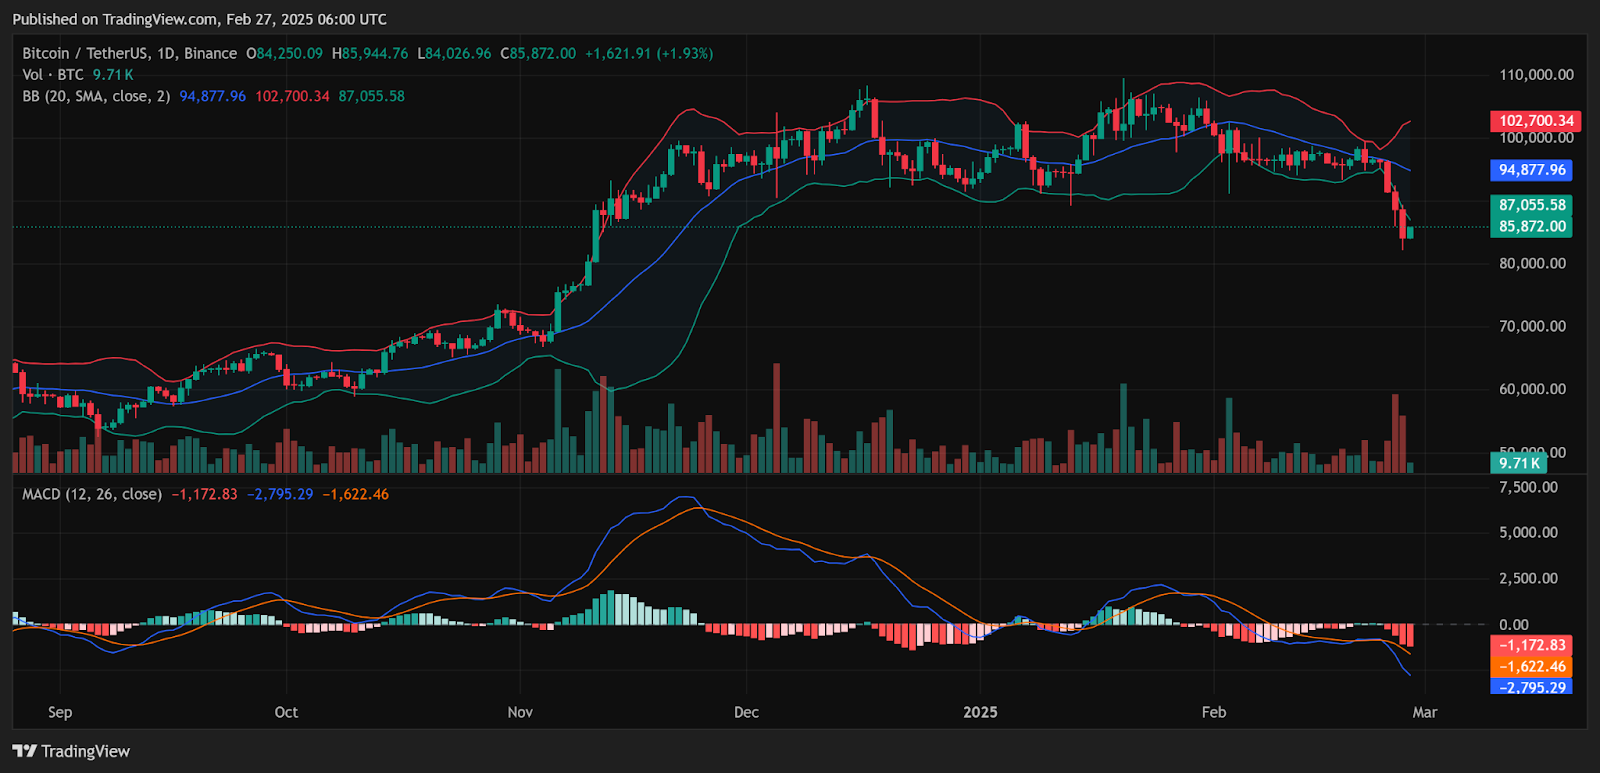
Bearish MACD Indicator Signals Seller Dominance
Additionally, the Moving Average Convergence Divergence (MACD) indicator remains negative, with the MACD line (blue) below the signal line.
Related: Crypto Market Shaken by $245M Bitcoin Long Squeeze, Open Interest Declines
The MACD histogram shows red histogram bars which are getting bigger, indicating that sellers are controlling the Bitcoin price action.
Disclaimer: The information presented in this article is for informational and educational purposes only. The article does not constitute financial advice or advice of any kind. Coin Edition is not responsible for any losses incurred as a result of the utilization of content, products, or services mentioned. Readers are advised to exercise caution before taking any action related to the company.

 Price Prediction: Can Bulls Reclaim the 0.236 Level?")

 Price Prediction: Can Bulls Break the $329 Barrier?")
