
- Bitcoin’s price dipped to $106K before rebounding to $109K, securing a red October close
- The dip was driven by a $1B retail sell-off on Binance and massive ETF outflows
- Red October history flags November risk even as the 200-week trend holds
Bitcoin’s late-October correction saw prices briefly tumble to $106K, the lowest in two weeks, before recovering slightly to $109K. Despite the dip, the world’s largest cryptocurrency continues to hold a $2 trillion market cap, down about 3.85% for the month.
Historically, when Bitcoin ended October in red, as it did last in 2022, November witnessed a sharp 36.57% crash, making traders wary of a repeat.
Related: Bitcoin’s December Dilemma: FOMC Split on Rate Cut Raises Uncertainty for Altcoins
Binance and ETF Outflows Spike
According to CryptoQuant, retail traders on Binance sparked another wave of selling on October 30, offloading more than 9,200 BTC ($1 billion) around the $107,700 level. This followed a similar retail-driven sell-off on October 22, when over 12,000 BTC were sold near $108,300.
At the same time, spot Bitcoin ETFs recorded heavy outflows. BlackRock led with -$2.6 billion, followed by Fidelity (-$790M) and Grayscale (-$500M).
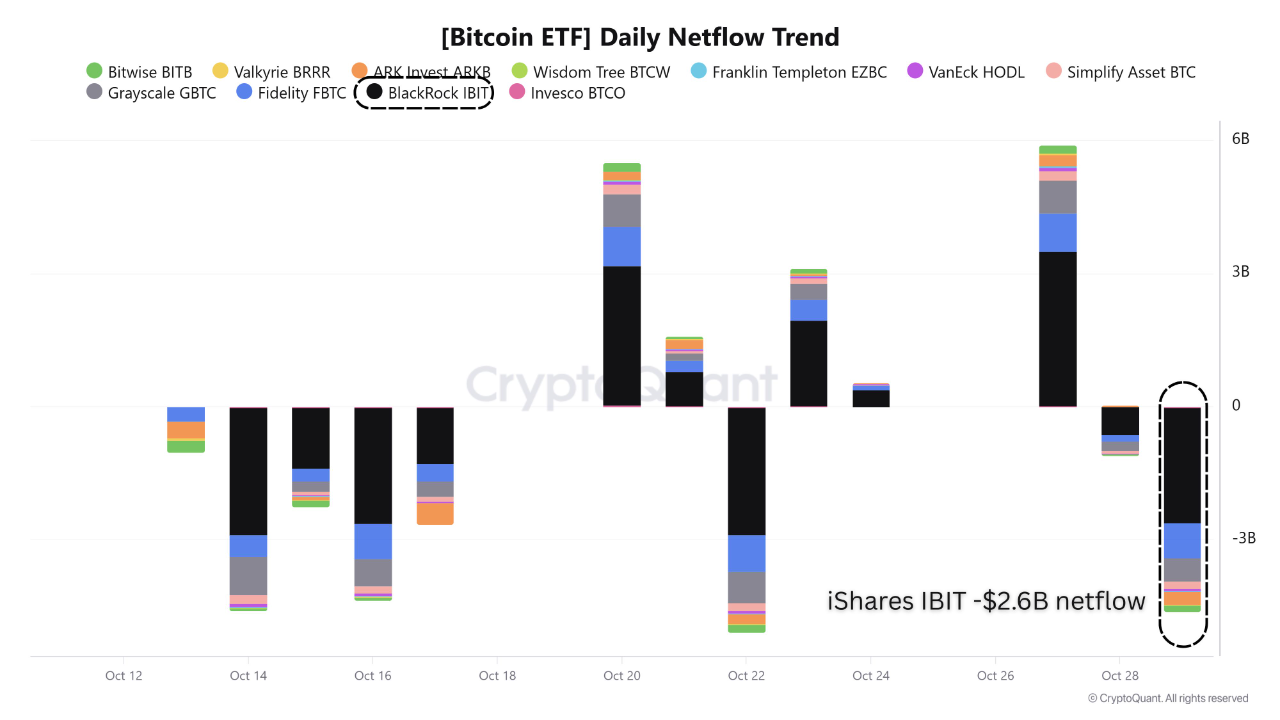
Interestingly, these ETF flows appeared to move inversely with price, i.e., selling pressure on October 22 preceded a rebound to $114.7K, while renewed buying on October 27 coincided with Bitcoin’s drop below $107K.
CryptoQuant analysts stated that such behavior suggests a retail-heavy pattern, with both ETF investors and short-term traders contributing to selling pressure, indicating local bottoms rather than a bear market.
Social Fear Peaks — A Contrarian Buy Signal?
Data from Santiment supports this contrarian view, adding that social media chatter around sub-$100K predictions surged sharply after Bitcoin’s dip to $107K.
On the other hand, discussions about higher price ranges ($150K–$200K) dropped massively. Historically, such fear-dominant sentiment often marks ideal entry zones. Santiment’s showed that the last time this sentiment peaked, on October 17, Bitcoin bounced 12% over the next 10 days.
<embed>https://x.com/santimentfeed/status/1983924159261397497<embed>
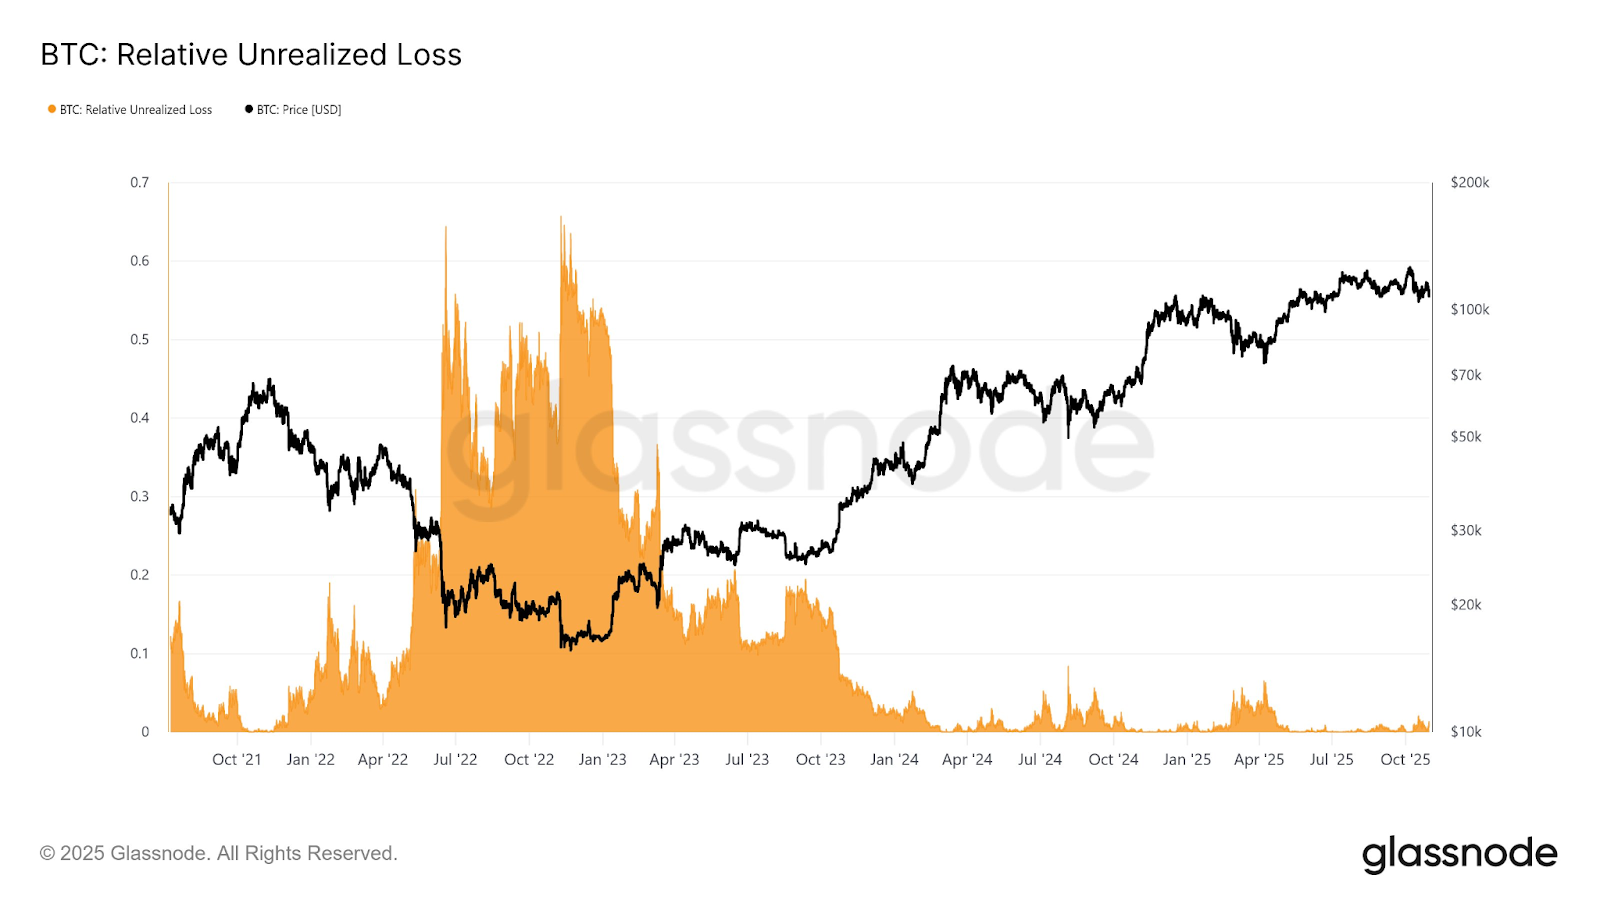
Meanwhile, Glassnode reported that Unrealized Losses at $107K account for just 1.3% of Bitcoin’s market cap, a remarkably low figure compared to mild bear markets (5%) or severe ones (50%), indicating that the market may be cooling off rather than collapsing.
Long-Term Outlook: Still a Bull Market?
The 200-week Simple Moving Average (SMA), currently around $54,750, remains far below Bitcoin’s 2021 peak of ~$70,000.
Historically, bull markets ended when this long-term SMA rose to challenge prior cycle highs, as seen in 2017 and 2021–2022. Since that threshold is still distant, Bitcoin may still be in a broader bullish phase despite the short-term weakness.However, CoinDesk analysts cautioned that these patterns have only appeared twice in Bitcoin’s history, making predictions based solely on them speculative at best.
Related: Bitcoin Price Prediction: Analysts Warn Of Deeper Pullback as BlackRock Sells $2B BTC
Disclaimer: The information presented in this article is for informational and educational purposes only. The article does not constitute financial advice or advice of any kind. Coin Edition is not responsible for any losses incurred as a result of the utilization of content, products, or services mentioned. Readers are advised to exercise caution before taking any action related to the company.


