
Bitcoin is currently hovering around $119,060 after consolidating below the $120,000 resistance mark. The broader structure remains bullish, with the Bitcoin price today still trading well above its long-term EMAs. However, momentum has cooled, and multiple indicators suggest a make-or-break moment as BTC coils inside a tightening pattern.
What’s Happening With Bitcoin’s Price?
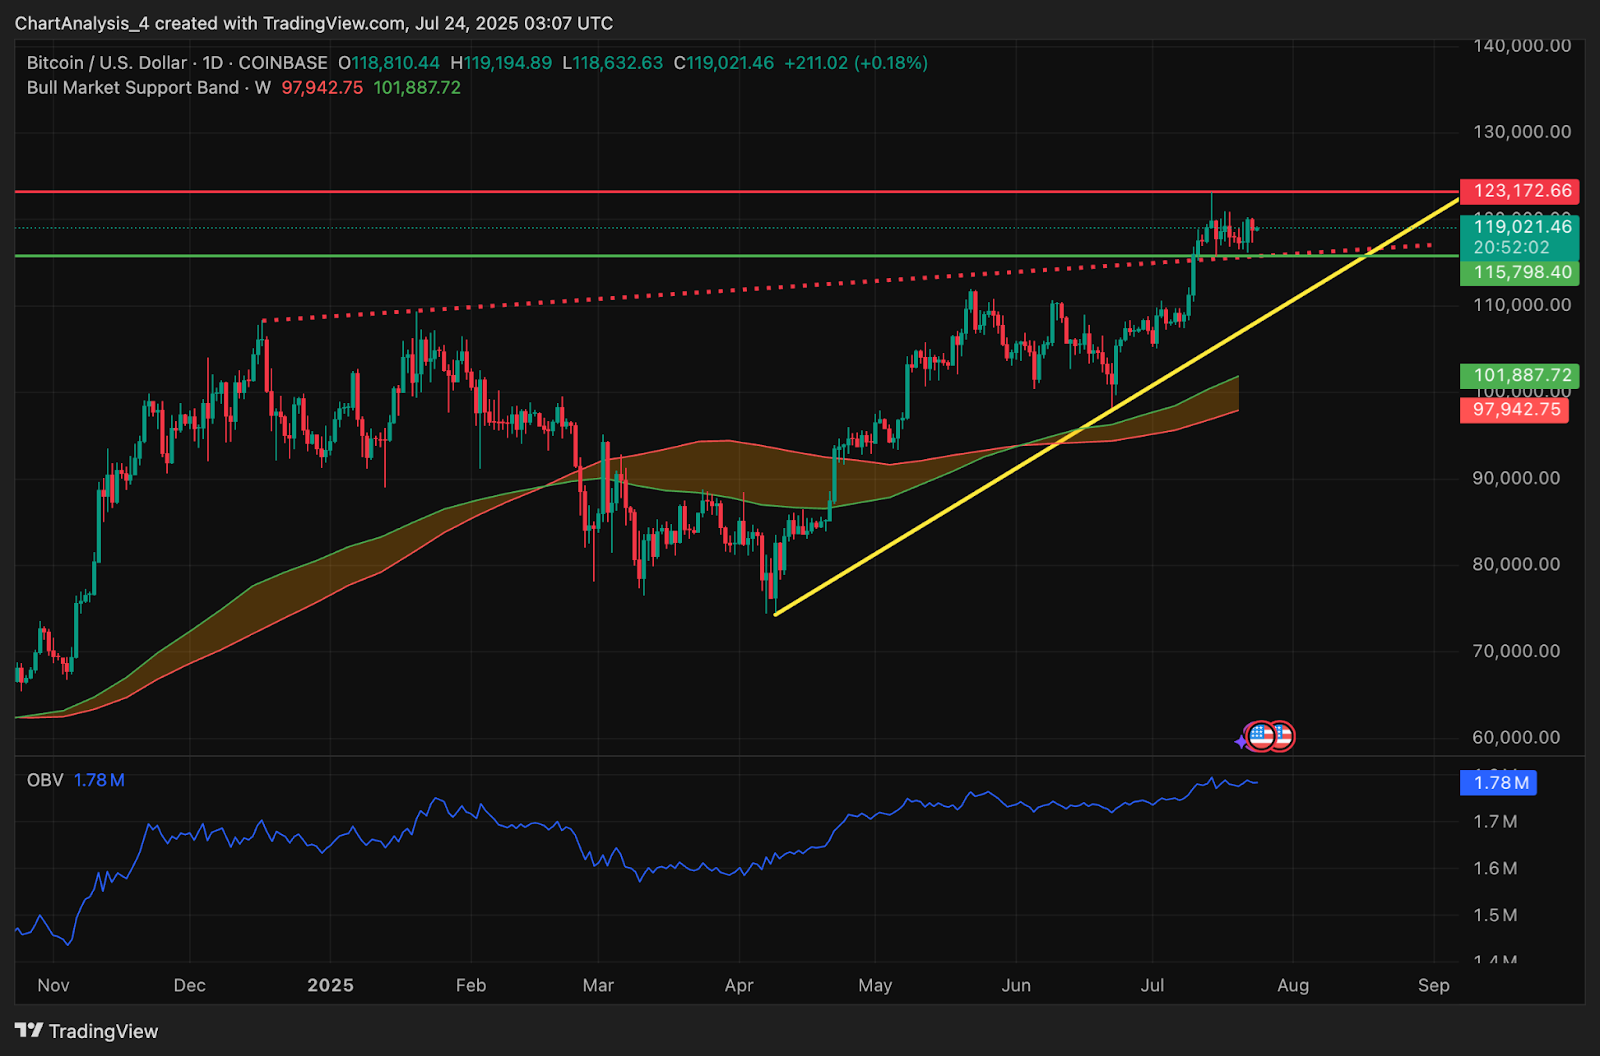
The daily chart shows BTC has respected the ascending trendline that started in early May, while repeatedly testing overhead resistance near $123,000. Price has now stalled under this zone, forming a flat structure that intersects with dynamic trendline support. The On-Balance Volume (OBV) has been stable, implying accumulation is ongoing even as volatility narrows.
Meanwhile, the 1-hour chart highlights a symmetrical triangle pattern forming since mid-July. Price is being squeezed between descending resistance and rising support lines, with Bitcoin price locked between $118,000 and $120,000. This structure suggests a breakout or breakdown may be imminent.
Why Is Bitcoin Price Going Down Today?
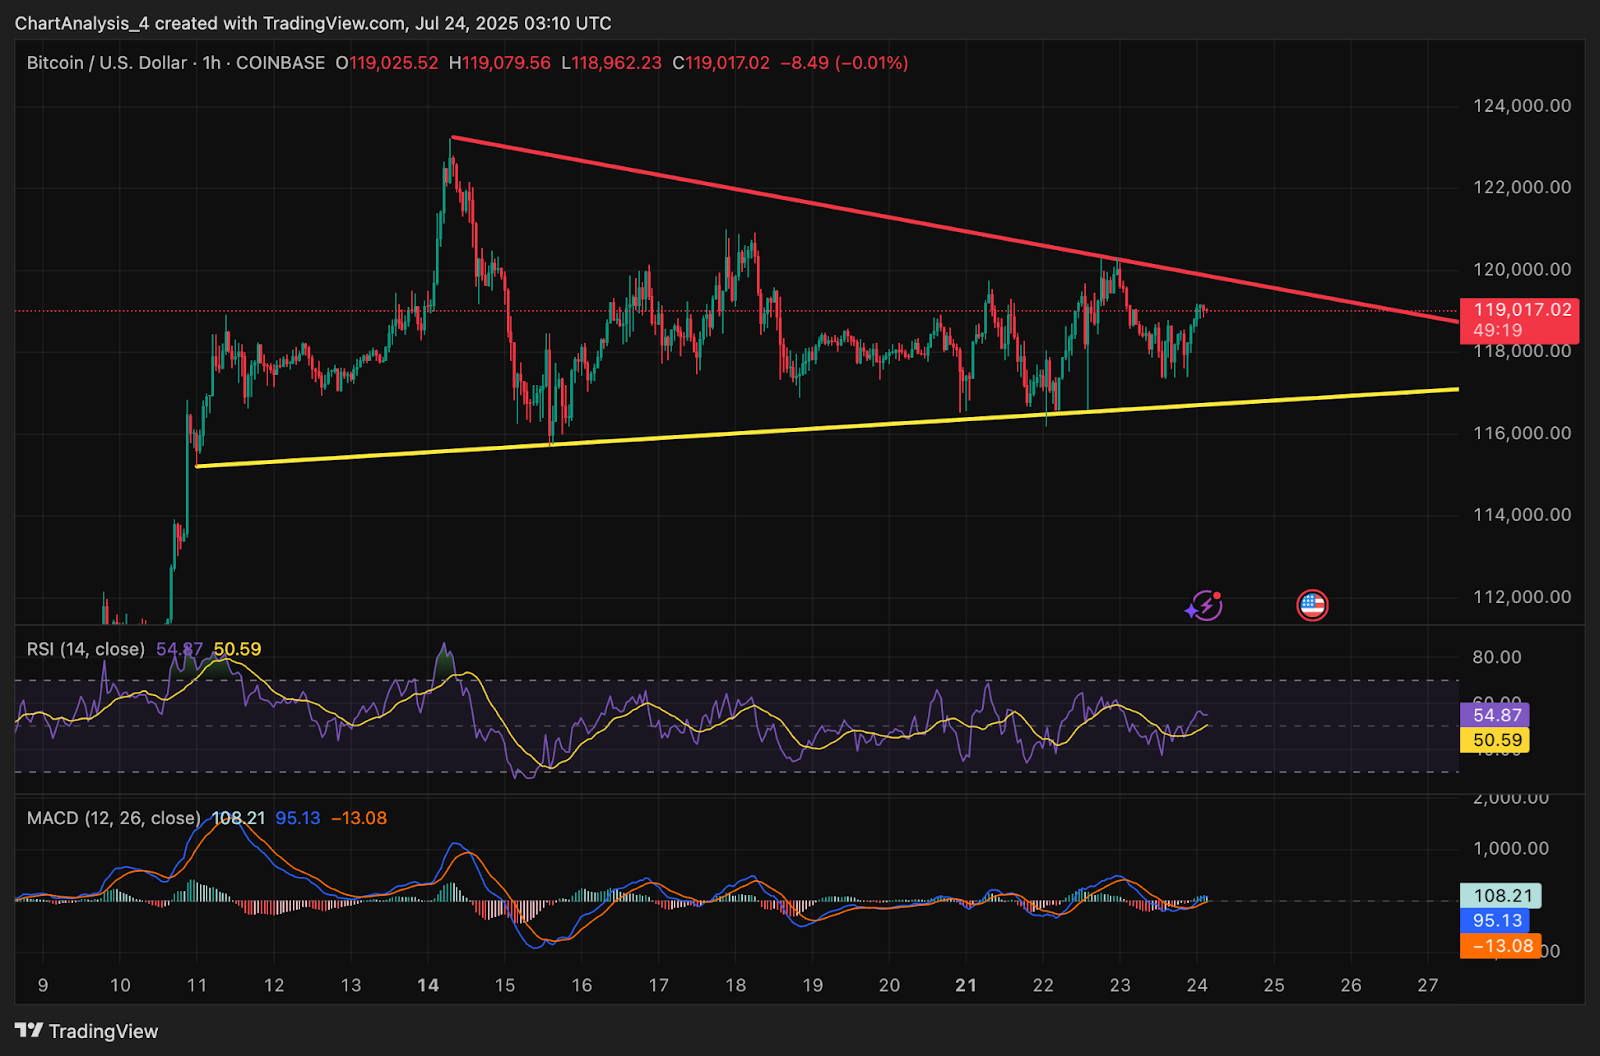
One reason why Bitcoin price going down today is the repeated failure to break above $120,000, which has triggered short-term profit-taking. RSI on the 1-hour timeframe remains neutral near 50, while MACD shows a mild bearish bias with a negative histogram. This reflects uncertainty rather than clear selling pressure.
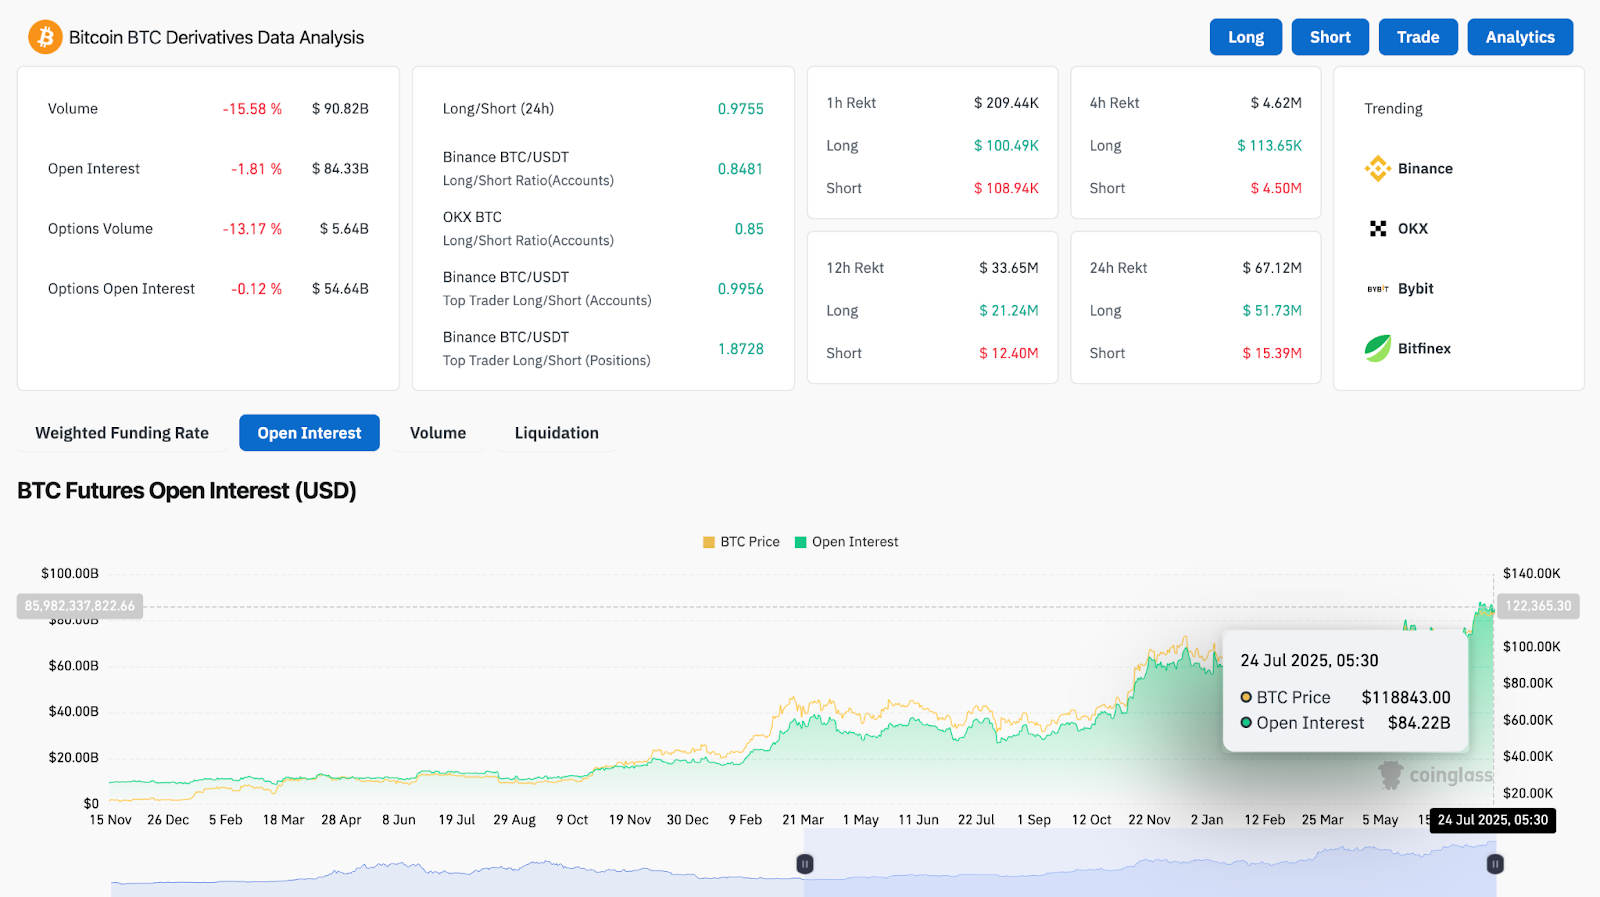
Derivatives data from Coinglass also confirms a cautious sentiment. Volume has dropped over 15% to $90.8 billion, while open interest has declined 1.81% to $84.33 billion. Although the long/short ratio remains near 1.0 across exchanges, the decrease in options volume suggests traders are waiting for confirmation before placing large bets.
BTC Price Action Signals Compression Before Breakout
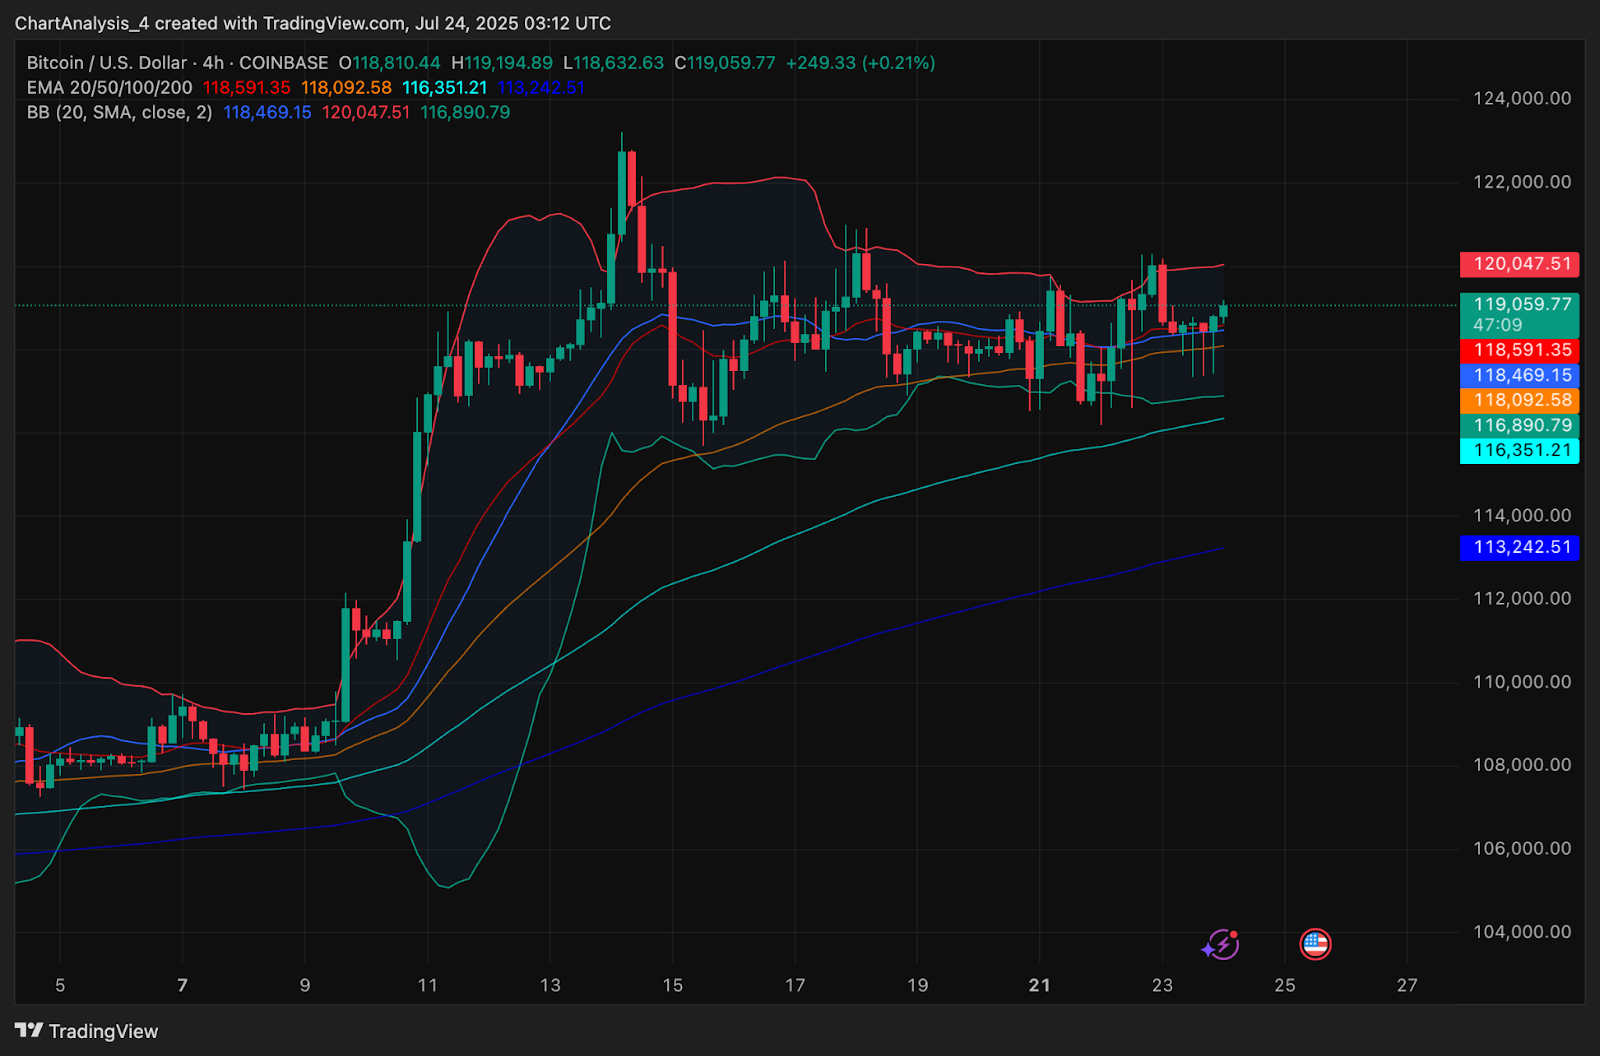
The 4-hour chart reveals a sideways grind between $118,000 and $120,000, with multiple rejections near the upper Bollinger Band at $120,047. Price is trading just above the 20 and 50 EMAs, with the 100 EMA offering deeper support near $116,890. Bollinger Bands are flattening, indicating compression, typically a precursor to volatility expansion.
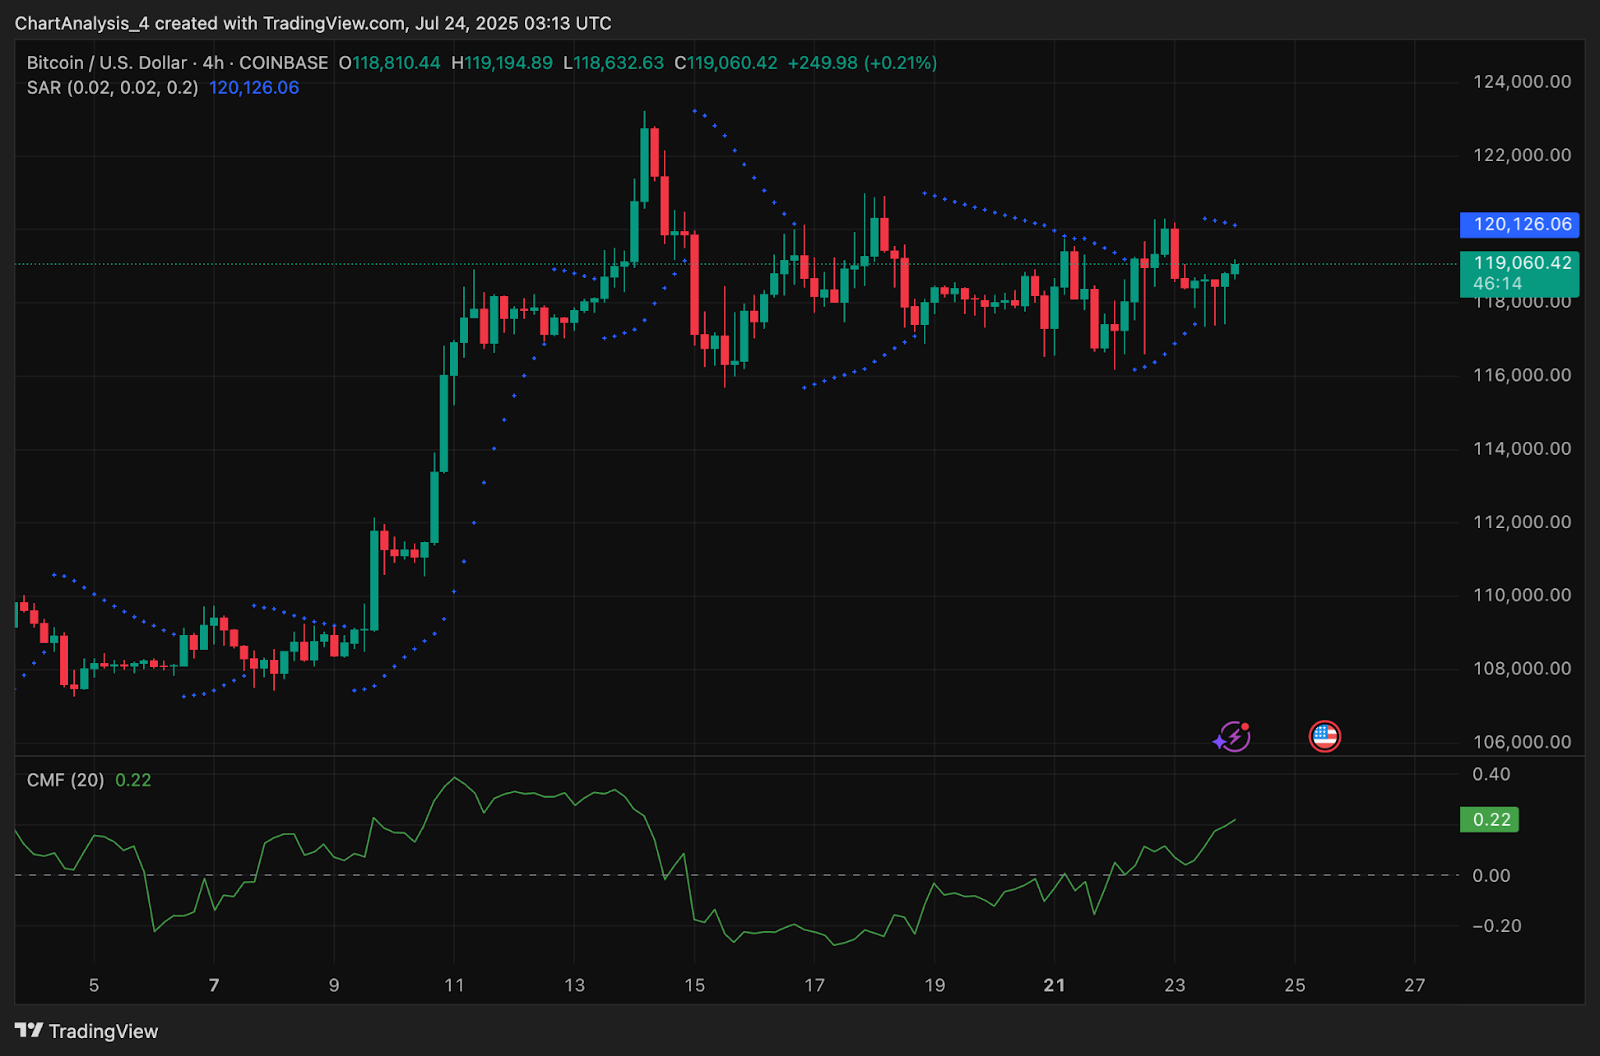
Parabolic SAR dots are now close to the price but remain above the candles, signaling trend indecision. However, the Chaikin Money Flow (CMF) is rising above 0.20, showing capital inflow remains active, even as traders hesitate on direction.
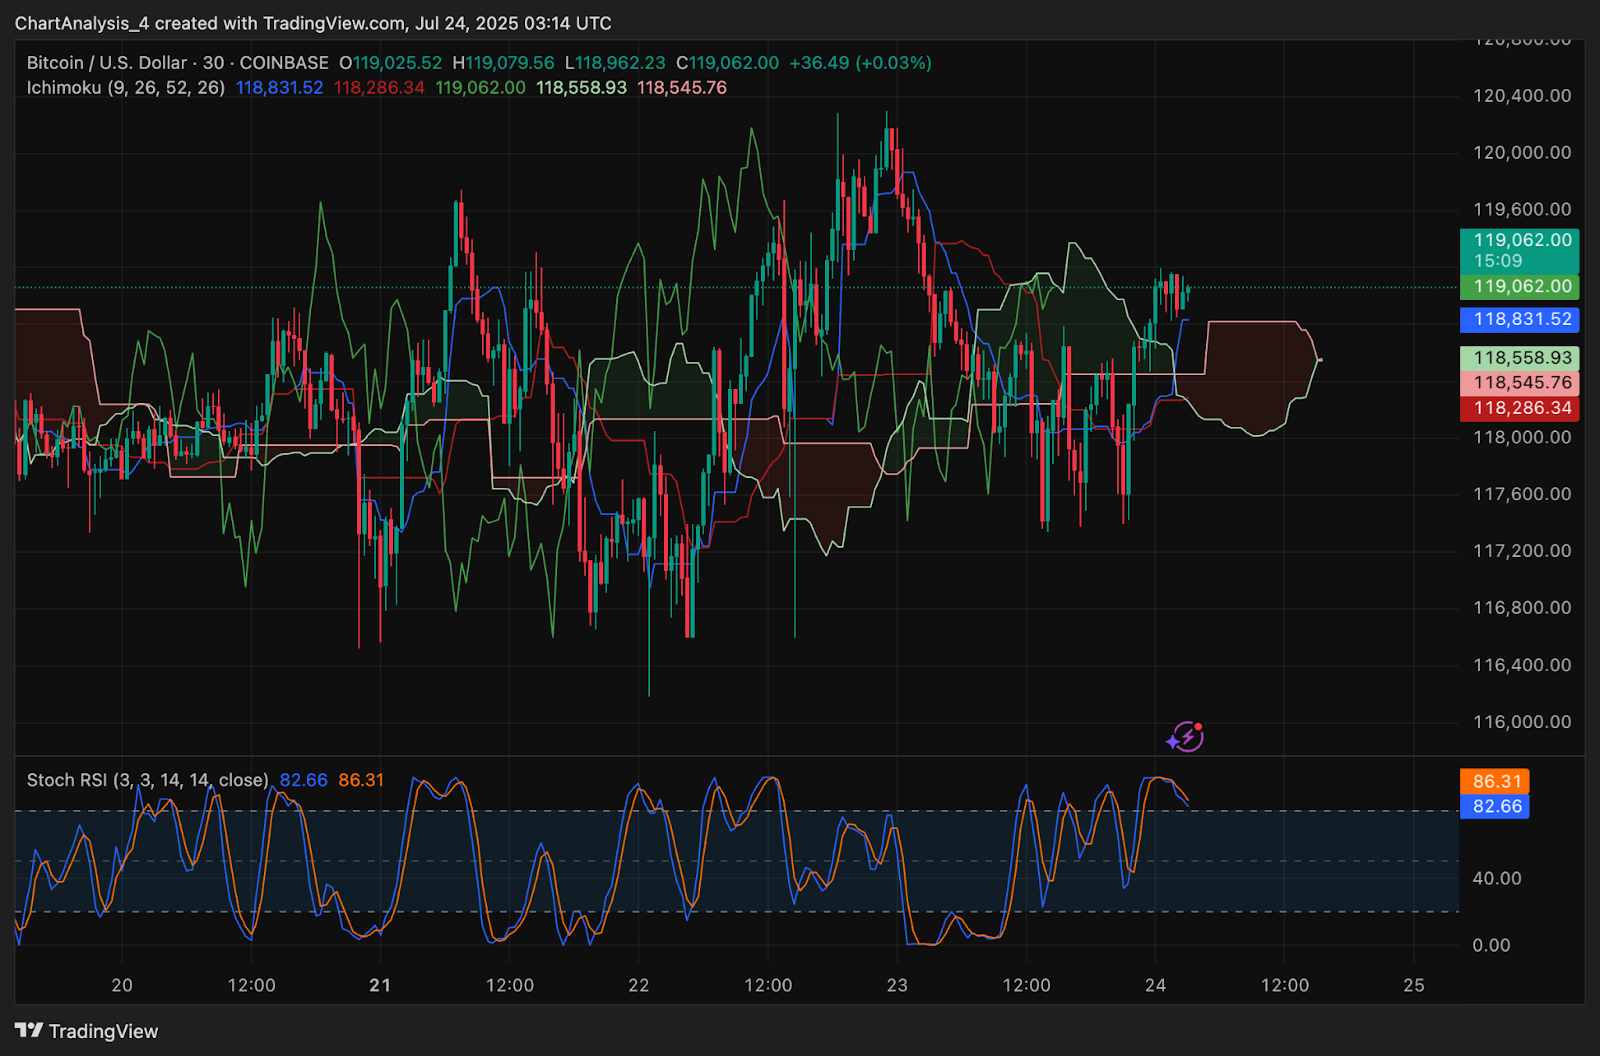
Ichimoku analysis on the 30-minute chart reflects a tight consolidation just above the cloud, with Tenkan-Sen and Kijun-Sen flat. This confirms short-term equilibrium. Stochastic RSI is entering the overbought zone above 80, suggesting the next move will be determined by the strength of any breakout attempt.
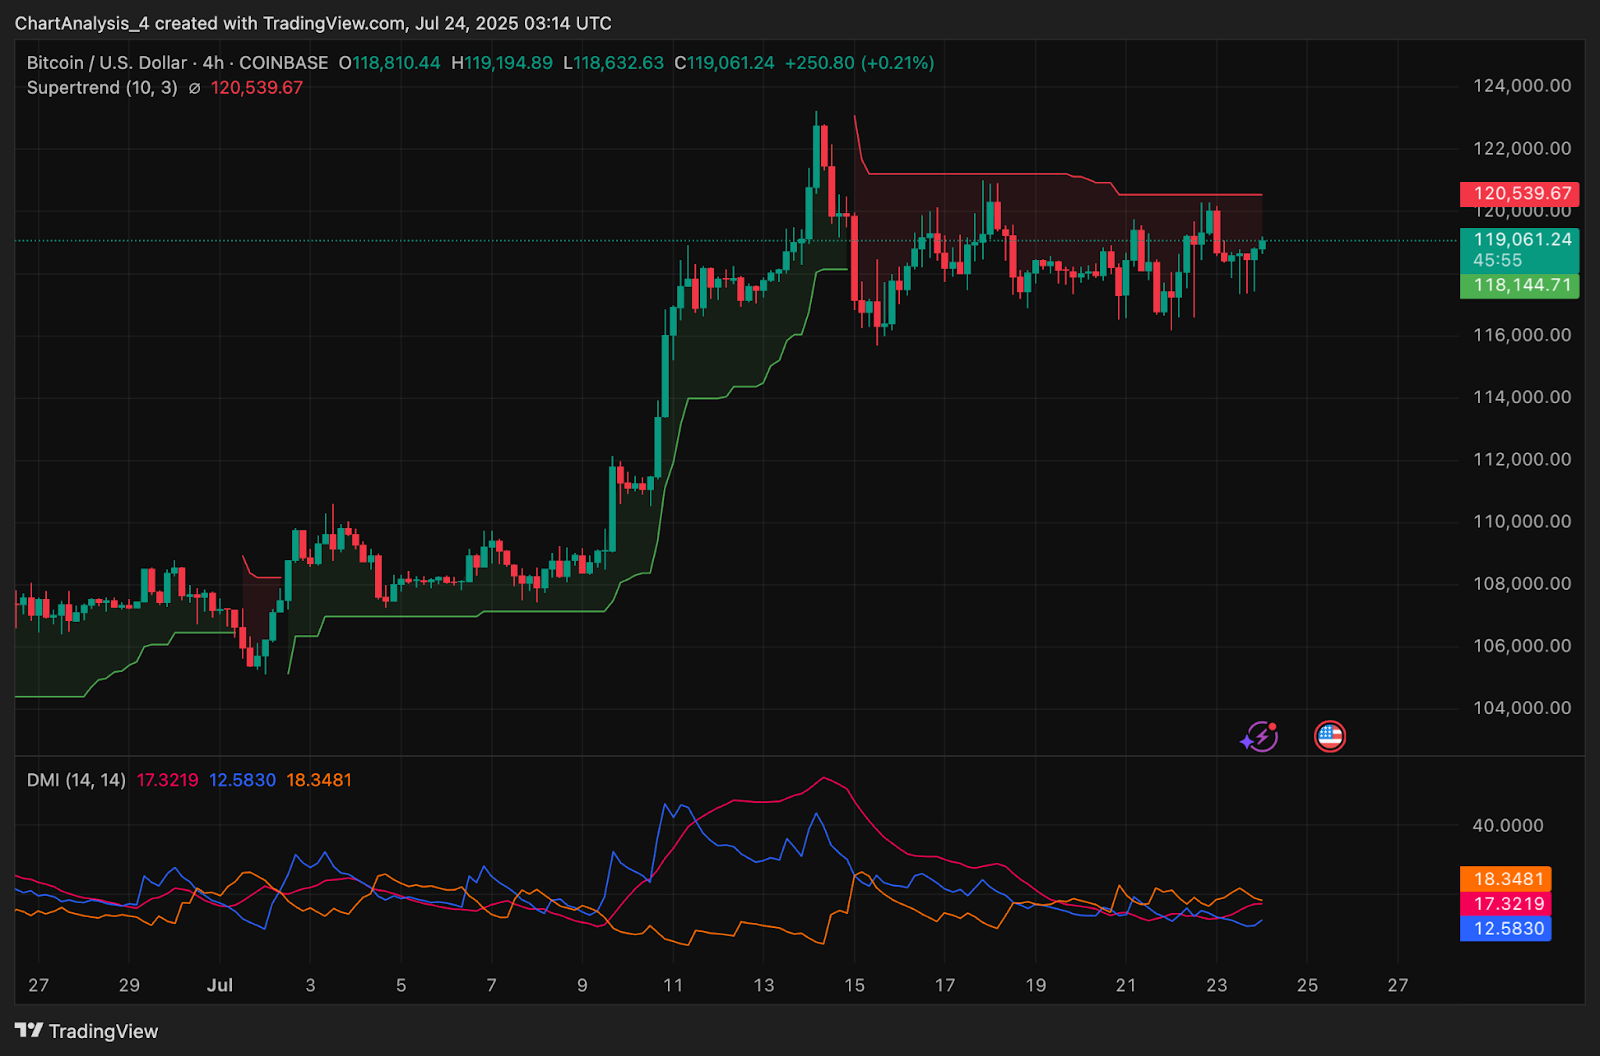
Supertrend on the 4-hour timeframe is still red, flipping bearish at $120,539. BTC must close above this level with conviction to regain short-term bullish momentum.
Bitcoin Price Prediction: Short-Term Outlook (24H)
In the short term, Bitcoin price is expected to remain range-bound unless there’s a confirmed breakout above $120,500. A sustained close above this level opens the path toward $123,000 and potentially $125,000 in the coming sessions.
On the downside, the ascending support line near $116,000 remains crucial. A break below this level could lead to a swift drop toward $113,000, where the 200 EMA and lower Bollinger Band converge.
With momentum indicators neutral and structure compressed, traders should watch for volume surges and decisive candle formations near $120,000 or $116,000. Until then, Bitcoin price volatility may remain suppressed.
Bitcoin Price Forecast Table: July 25, 2025
| Indicator/Zone | Level / Signal |
| Bitcoin price today | $119,060 |
| Resistance 1 | $120,500 |
| Resistance 2 | $123,000 |
| Support 1 | $116,000 |
| Support 2 | $113,000 |
| RSI (1H) | 50.59 (Neutral) |
| MACD (1H) | -13.08 (Mild Bearish) |
| OBV (1D) | Stable at 1.78M (Accumulating) |
| Bollinger Bands (4H) | Flat (Compression phase) |
| Supertrend (4H) | Bearish under $120,539 |
| Parabolic SAR (4H) | Above price (Indecision) |
| CMF (4H) | +0.22 (Capital inflow) |
| Ichimoku (30-min) | Price above cloud, flat lines |
| Stoch RSI (30-min) | 86.31 (Overbought) |
| Derivatives Open Interest | $84.22B (Slightly down) |
Disclaimer: The information presented in this article is for informational and educational purposes only. The article does not constitute financial advice or advice of any kind. Coin Edition is not responsible for any losses incurred as a result of the utilization of content, products, or services mentioned. Readers are advised to exercise caution before taking any action related to the company.


 Price Prediction: Canton Eyes Key Break After Market Activity Spike")

