
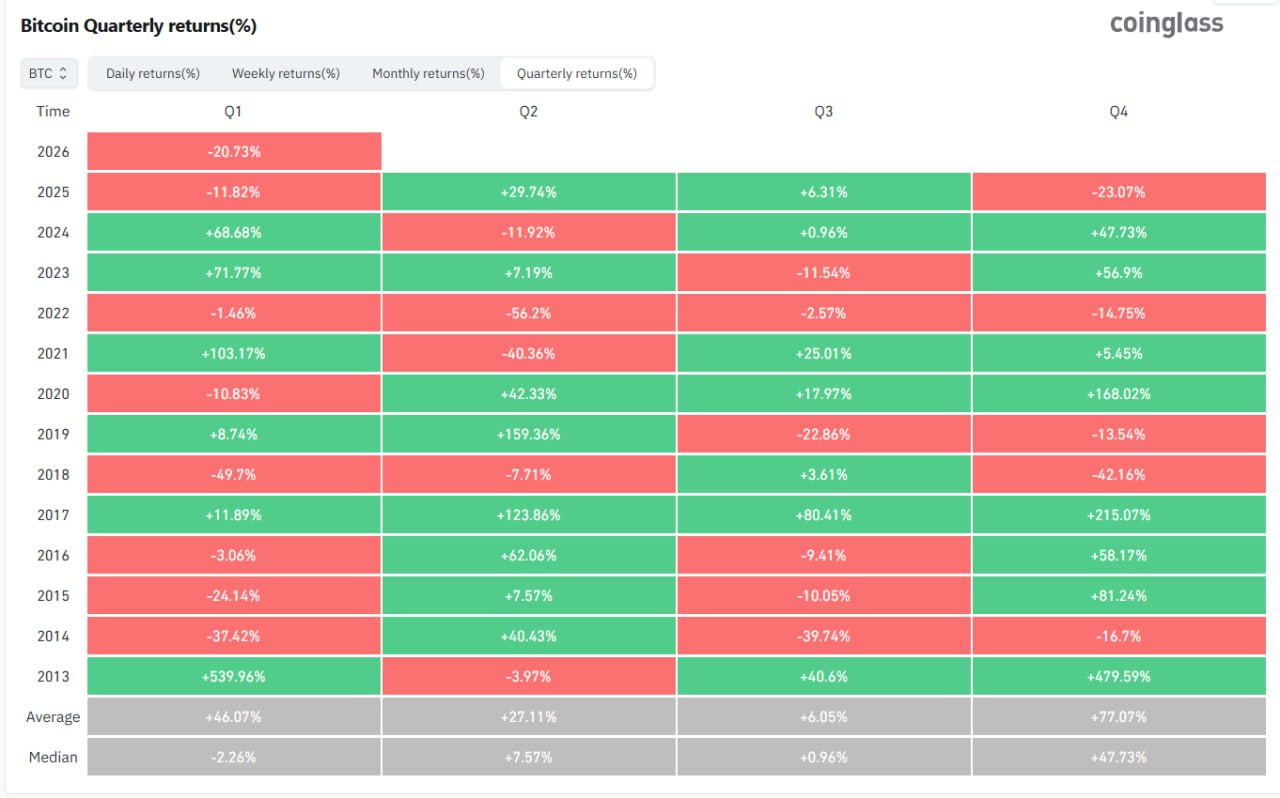
- Bitcoin ended Q1 2026 down 20.73%, weakening the typical bullish setup that often drives strong Q2 rallies.
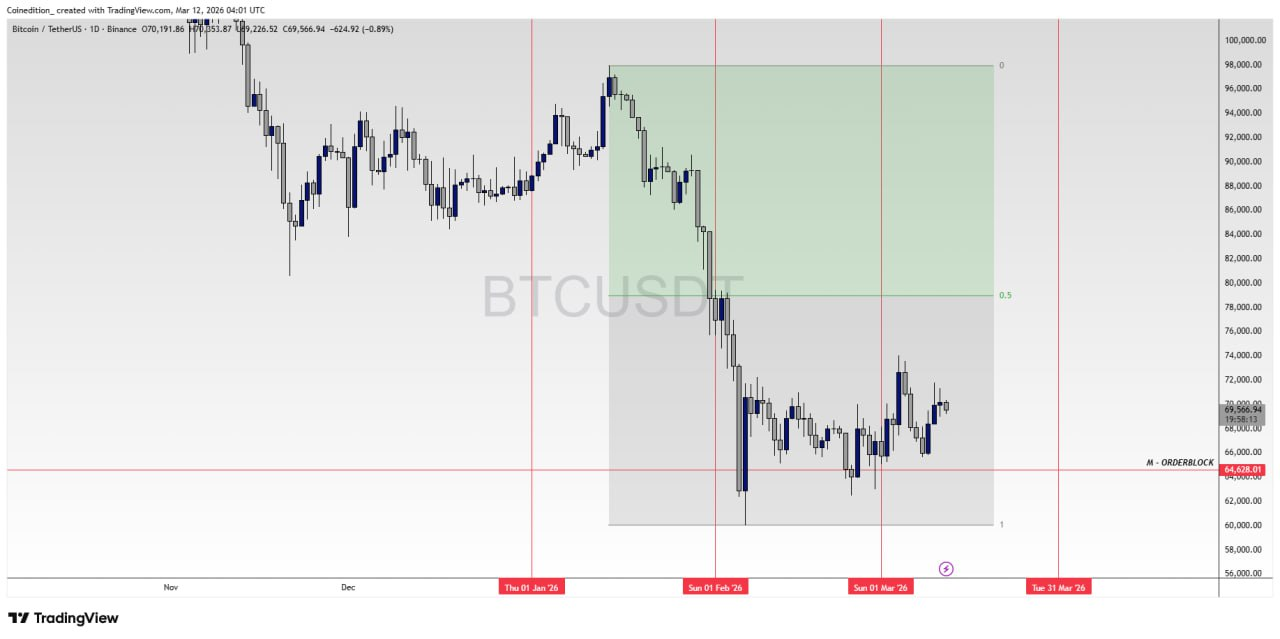
- BTC has traded in a $62.8K-$72.6K range for over a month, with repeated failures to reclaim the $70K level.
- On-chain data shows weak momentum, with STH-SOPR at 0.985 since October 2025.
Bitcoin historically performs well in the second quarter, but the current market behavior shows little confirmation that a strong rebound is underway.
Data from CoinGlass shows that Bitcoin’s average Q2 return sits around +27.11%, making it one of the strongest periods in the yearly cycle. However, Q1 2026 closed down 20.73%, one of the weakest starts to a year since the 2022 bear market.
Strong Q2 rallies typically begin with early momentum but in 2026, that demand is not present. Price reacted only modestly from monthly support and has failed to reclaim higher resistance levels as BTC fails to break out of the $70K price resistance.
Without a rally early in the quarter, Q2 bullish expectations can quickly turn into liquidity for sellers positioning for another move lower.
Bitcoin Stuck in a $62.8K-$72.6K Range
At press time, Bitcoin trades near $69,000 after spending more than a month consolidating between $62,800 and $72,600, according to on-chain data from Glassnode.
Each attempt to reclaim $70,000 has failed as rejections often triggered bursts of profit taking, with net realized profit briefly exceeding $5 million per hour, showing traders selling strength rather than building new positions.
Glassnode said that Bitcoin is currently trapped between two key on-chain cost basis levels.
The Realized Price sits at $54,400, representing the average acquisition price of all circulating coins. Above the market sits the True Market Mean at $78,400, which tracks the cost basis of coins actively moving on-chain.
This creates a wide equilibrium zone where Bitcoin currently floats between long-term support and active market resistance.
Related: Armed Attackers Force French Couple to Transfer $1M in Bitcoin
On-Chain Signals Still Show Bear Market Behavior
The 7-day exponential moving average of the Short-Term Holder Spent Output Profit Ratio (STH-SOPR) currently sits at 0.985 and has remained below 1 since October 2025. This means recent buyers are selling coins at a loss.
Historically, readings below 1 signal that newer market participants lack unrealized profits to defend their positions. Relief rallies often stall when STH-SOPR approaches 1, as traders exit positions near break-even.
On the other hand, a supply cluster has formed near the midpoint of the current price range, but the intensity of that accumulation is weaker than during previous phases that led to strong rallies.
Historically, Bitcoin rebounds strongly after geopolitical shocks, with average recoveries of 15% or more, which would place price in the $77,000 to $80,000 range. But for that scenario to develop, the market must first reclaim $70,000 and eventually break through $75,000.
Related: Arthur Hayes Cautions Bitcoin Buyers as Fed Liquidity Cycle Remains Unclear
Disclaimer: The information presented in this article is for informational and educational purposes only. The article does not constitute financial advice or advice of any kind. Coin Edition is not responsible for any losses incurred as a result of the utilization of content, products, or services mentioned. Readers are advised to exercise caution before taking any action related to the company.


 Price Prediction: Weak Momentum Signals Possible Drop to $62K")

 Price Prediction for April 2026: Will Chainlink Move Higher?")