
- Bitcoin holds $110K after breaking its seven-year positive October streak, down 5% for the month.
- Analysts expect a bullish November with $115K breakout potential as historical trends favor gains.
- Exchange data show steady accumulation and reduced selling pressure after $1.2B October liquidation.
Bitcoin price today trades near $110,100, steadying after breaking a seven-year streak of positive Octobers. The leading cryptocurrency closed October with a 5% loss, its first negative monthly performance since 2018. The decline followed a historic $1.2 billion liquidation after President Trump’s tariff announcement rattled risk assets. Despite the setback, Bitcoin remains up more than 16% this year, holding above key long-term supports that continue to define its broader trend.
October Volatility Tests Investor Confidence
October’s reversal surprised traders who view it as Bitcoin’s historically strongest month. Coinglass data show a consistent seven-year record of gains during October, averaging more than 20% monthly returns. This year, that trend broke sharply as the digital asset fell from its all-time high of $126,142 to lows near $104,782 following the tariff shock.
Analysts attributed the decline to broader market caution. Equity valuations, concerns about U.S. monetary policy, and risk rotation after the liquidation event dampened momentum. Kaiko senior analyst Adam McCarthy noted that Bitcoin tracked gold and equities early in the month but failed to attract dip buyers once volatility returned.
Technical Outlook: Bitcoin Coils Near Key Fibonacci Zone
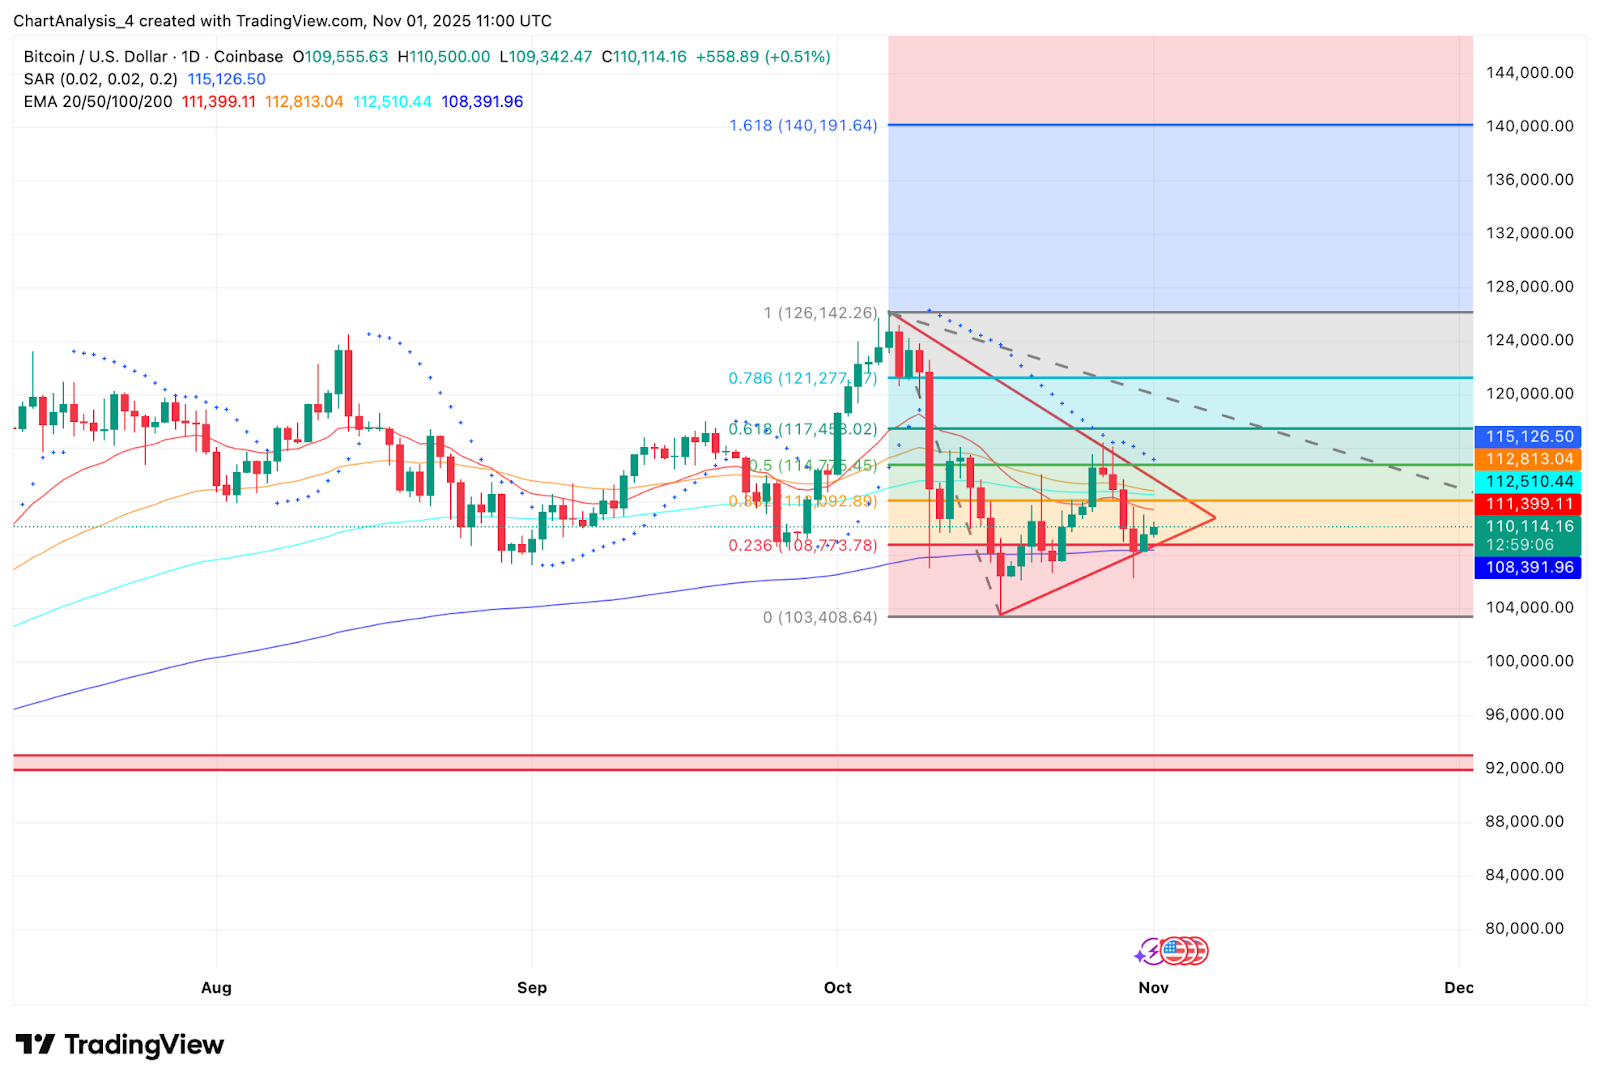
The daily chart shows Bitcoin consolidating inside a symmetrical triangle as volatility compresses near critical Fibonacci retracement levels. The 0.5 retracement at $114,745 and 0.618 level at $117,483 mark resistance zones that bulls must clear to confirm renewed upside.
Support sits near $108,773, which aligns with the 0.236 retracement and the 200-day EMA at $108,392. Holding above this base remains vital for sustaining the long-term bullish structure. The 20-day EMA at $111,399 and 50-day EMA at $112,813 have flattened, signaling a neutral bias as the market awaits direction.
A breakout above the triangle’s upper boundary could open targets toward $121,277, while a breakdown below $108,000 might expose deeper retracement toward $103,400, the prior cycle’s higher low. The Parabolic SAR indicator flipped bullish on November 1, reinforcing short-term upward pressure, though confirmation requires a close above $112,500.
Flows Show Cautious Accumulation
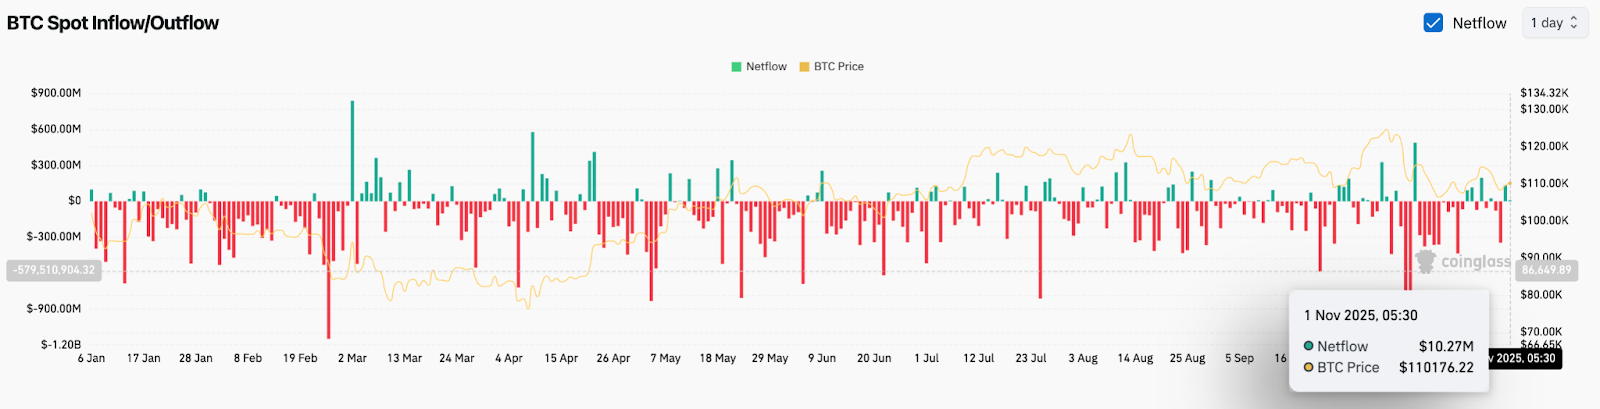
Exchange flow data support the stabilization narrative. Coinglass recorded a $10.2 million net inflow on November 1, indicating subdued but steady accumulation after heavy October withdrawals. The broader trend remains net negative, suggesting long-term investors continue to move holdings off exchanges.
This shift typically signals reduced selling pressure and long-term confidence. Institutional participation appears restrained but steady, consistent with a market waiting for clearer macro signals. The absence of large inflows also shows limited speculative leverage, which may reduce the risk of another liquidation-driven cascade.
Market Sentiment And Macro Backdrop
The macro environment remains mixed. The U.S. Federal Reserve has paused its rate-cut cycle, citing incomplete economic data following the government shutdown. Fed Chair Jerome Powell emphasized flexibility, keeping uncertainty high for risk assets.
At the same time, global equities have entered a consolidation phase, and gold’s strength reflects renewed caution. These conditions often favor Bitcoin as investors rebalance portfolios toward assets perceived as hedges against policy uncertainty.
Comments from JPMorgan CEO Jamie Dimon about a possible equity correction further highlight risk aversion among traditional investors. This shift could work in Bitcoin’s favor if capital rotates toward alternative stores of value.
Historical Patterns Hint At A Potential Rebound
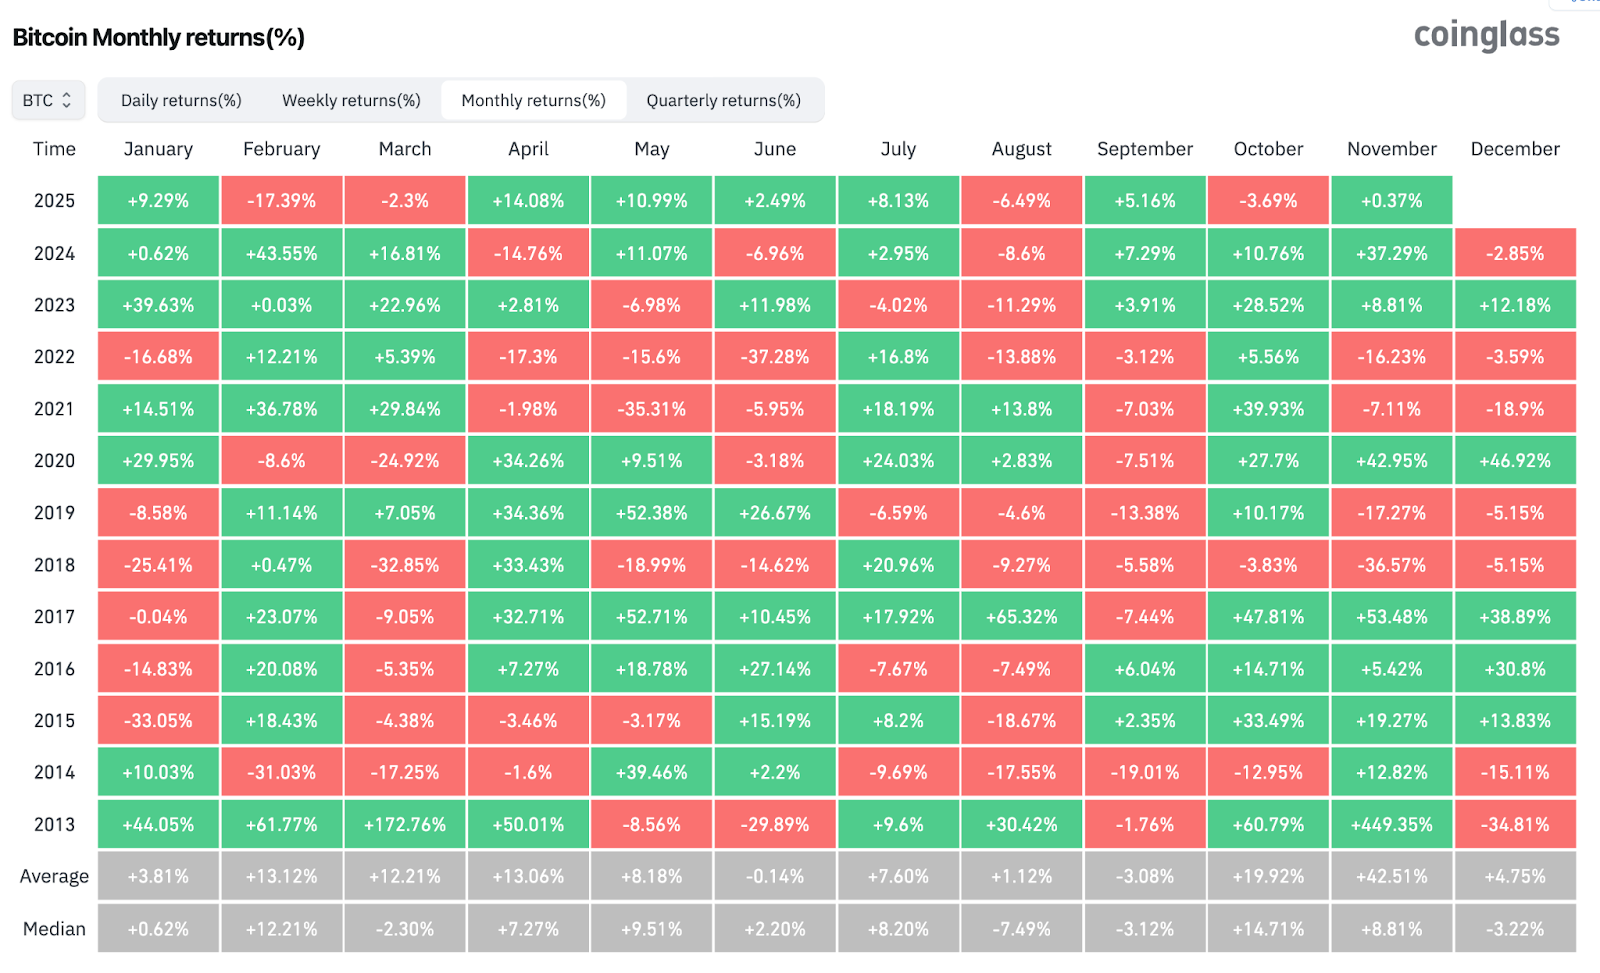
Bitcoin’s seasonality supports the possibility of a November recovery. According to Coinglass, November has delivered an average monthly gain of more than 19% over the past decade, with positive returns in eight of the last ten years. The strongest examples include 2020’s +42.9% and 2021’s +39.9% rallies, both following October consolidations.
While past performance does not guarantee future outcomes, the technical setup mirrors similar compression phases that preceded prior November surges. If sentiment stabilizes and buyers reclaim control above the $115,000 area, a short-term rally could develop quickly toward $121,000–$126,000.
Outlook: Will Bitcoin Go Up?
For now, the Bitcoin price prediction remains balanced. The asset has held firm above $108,000 despite volatility, suggesting resilient demand at lower levels. A breakout above $112,800 would likely trigger renewed momentum, while rejection near that zone could keep price locked between $108,000 and $115,000 until mid-month.
Upside targets sit at $117,400 and $121,200, while a drop below $108,000 would turn sentiment bearish, risking a move toward $103,400 before recovery attempts resume.
Overall, the structure remains intact for a potential recovery in November if macro sentiment stabilizes. Long-term investors continue to accumulate gradually, while short-term traders are watching for confirmation of breakout strength.
Disclaimer: The information presented in this article is for informational and educational purposes only. The article does not constitute financial advice or advice of any kind. Coin Edition is not responsible for any losses incurred as a result of the utilization of content, products, or services mentioned. Readers are advised to exercise caution before taking any action related to the company.


