
- Bitcoin price today trades near $101,760, sitting just above the $100,000 support band after losing its multi-month trendline.
- Spot data shows $53.96M in net outflows, signaling distribution rather than dip-buying as sellers maintain control.
- A daily close below $98,500 exposes the next support at $92,000, while recovering $107,000–$111,200 is required to flip momentum.
Bitcoin price today trades near $101,760, sitting just above the psychological $100,000 level after a steady decline from early November highs. The market continues to show weakness as sellers dominate order flow and spot outflows accelerate across major exchanges. The drop below a multi-month rising trendline has shifted the structure from controlled pullback to potential correction.
Sellers Hold Control As Support Levels Narrow
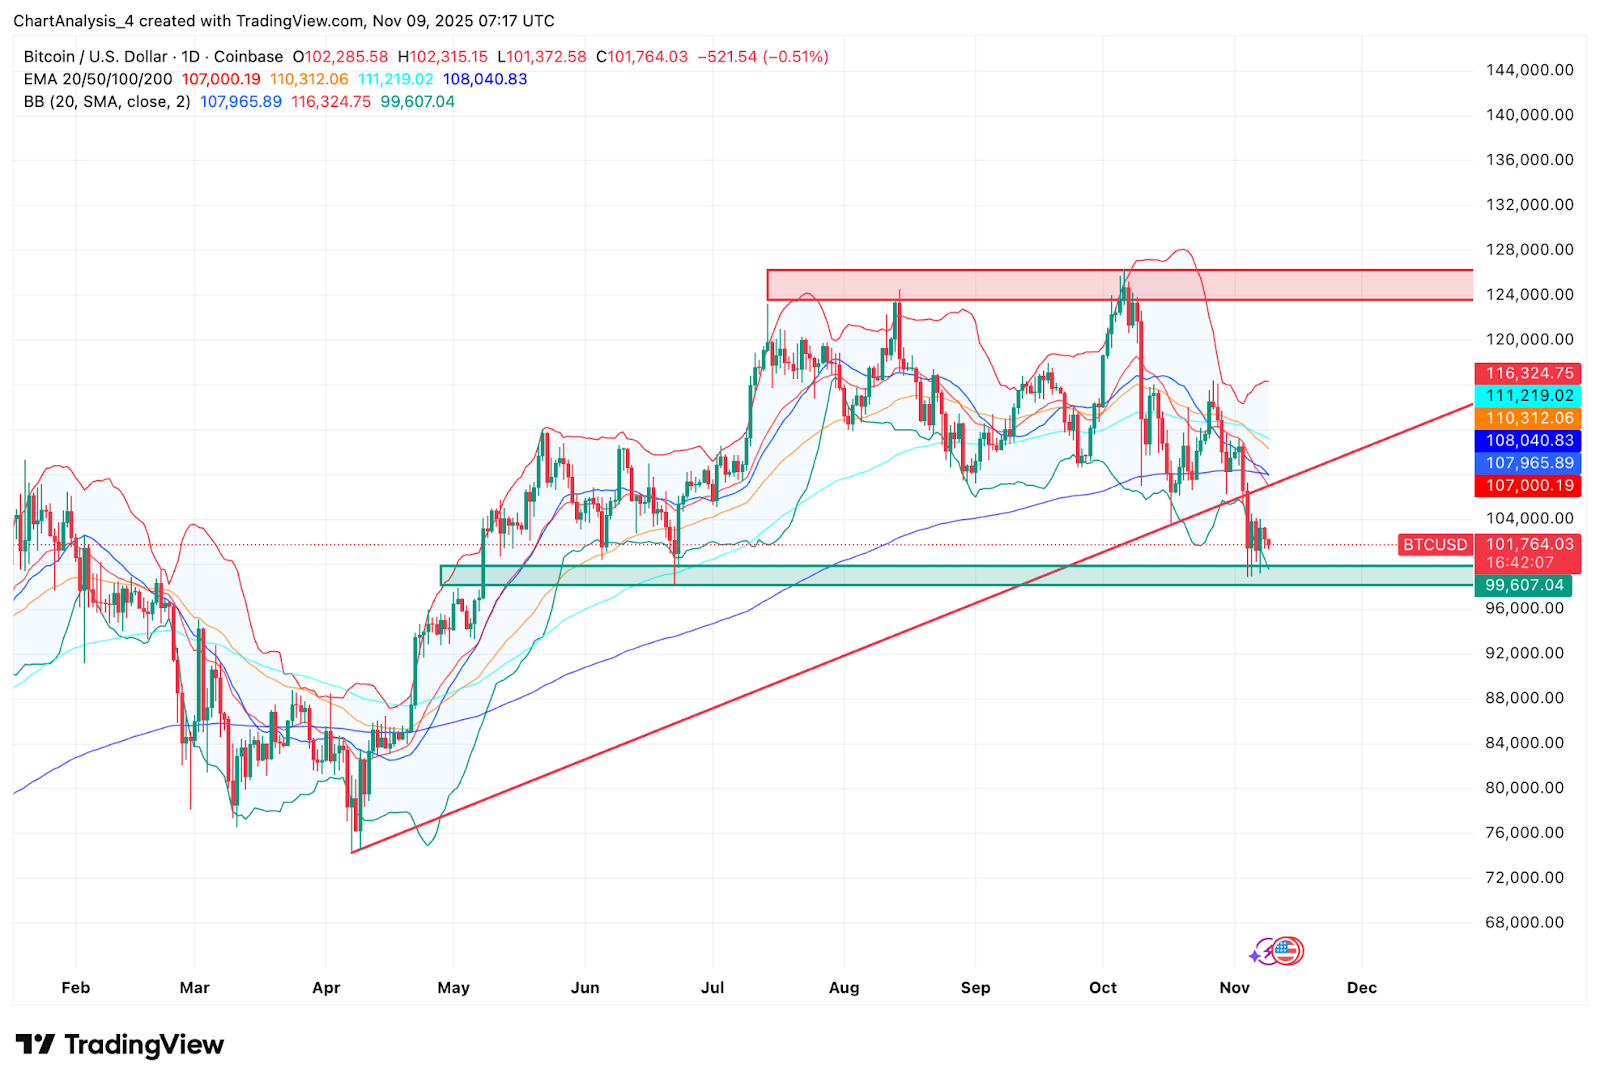
The daily chart shows Bitcoin losing the rising trendline that supported the entire 2025 advance. Price now trades below the 20, 50, and 100 day EMAs at $107,000, $110,312, and $111,219, with all three acting as resistance. The 200 day EMA sits near $108,040, reinforcing the overhead ceiling.
The most important level on the chart is the support shelf between $100,000 and $98,500, which has halted every breakdown attempt since September. If this zone breaks, the next volume pocket does not appear until $92,000, a level visible from prior consolidation.
Daily chart structure shows:
- Immediate resistance: $107,000 to $111,200 (EMA cluster)
- Immediate support: $100,000 to $98,500
- Breakdown target: $92,000
- Macro demand zone: $88,000
Bollinger Bands on the daily chart are widening downward as price rides the lower band. That expansion often leads to continuation rather than reversal.
Spot Outflows Show Real Distribution
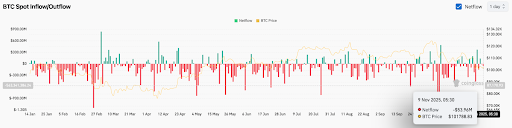
On chain flows mirror the weakness. Data from Coinglass confirms $53.96 million in net outflows on November 9, continuing a multi-week streak of sellers moving BTC from cold storage back to exchanges. Persistent red bars on the spot flow chart show that investors are not accumulating the dip.
When outflows continue while price sits on support, it signals that long term holders are reducing risk, not positioning for upside.
Analyst James Lavish highlighted that long-term holders have sold more than 400,000 BTC in the past month, saying market confidence has collapsed even though Bitcoin is still above $100,000.
Analyst Warnings Intensify
Bloomberg senior strategist Mike McGlone issued a direct caution this week, noting Bitcoin’s inability to hold above key technical levels
He said, “In my opinion, Bitcoin won’t stay above $100,000 for long. BTC opened below the 200 day moving average. This level is now strong resistance around $110,000.”
McGlone believes the market has shifted from accumulation to risk reduction and added:
“Bitcoin could wake up below $100,000 on Monday, November 10th.”
Supertrend And Channel Confirm Short Term Weakness
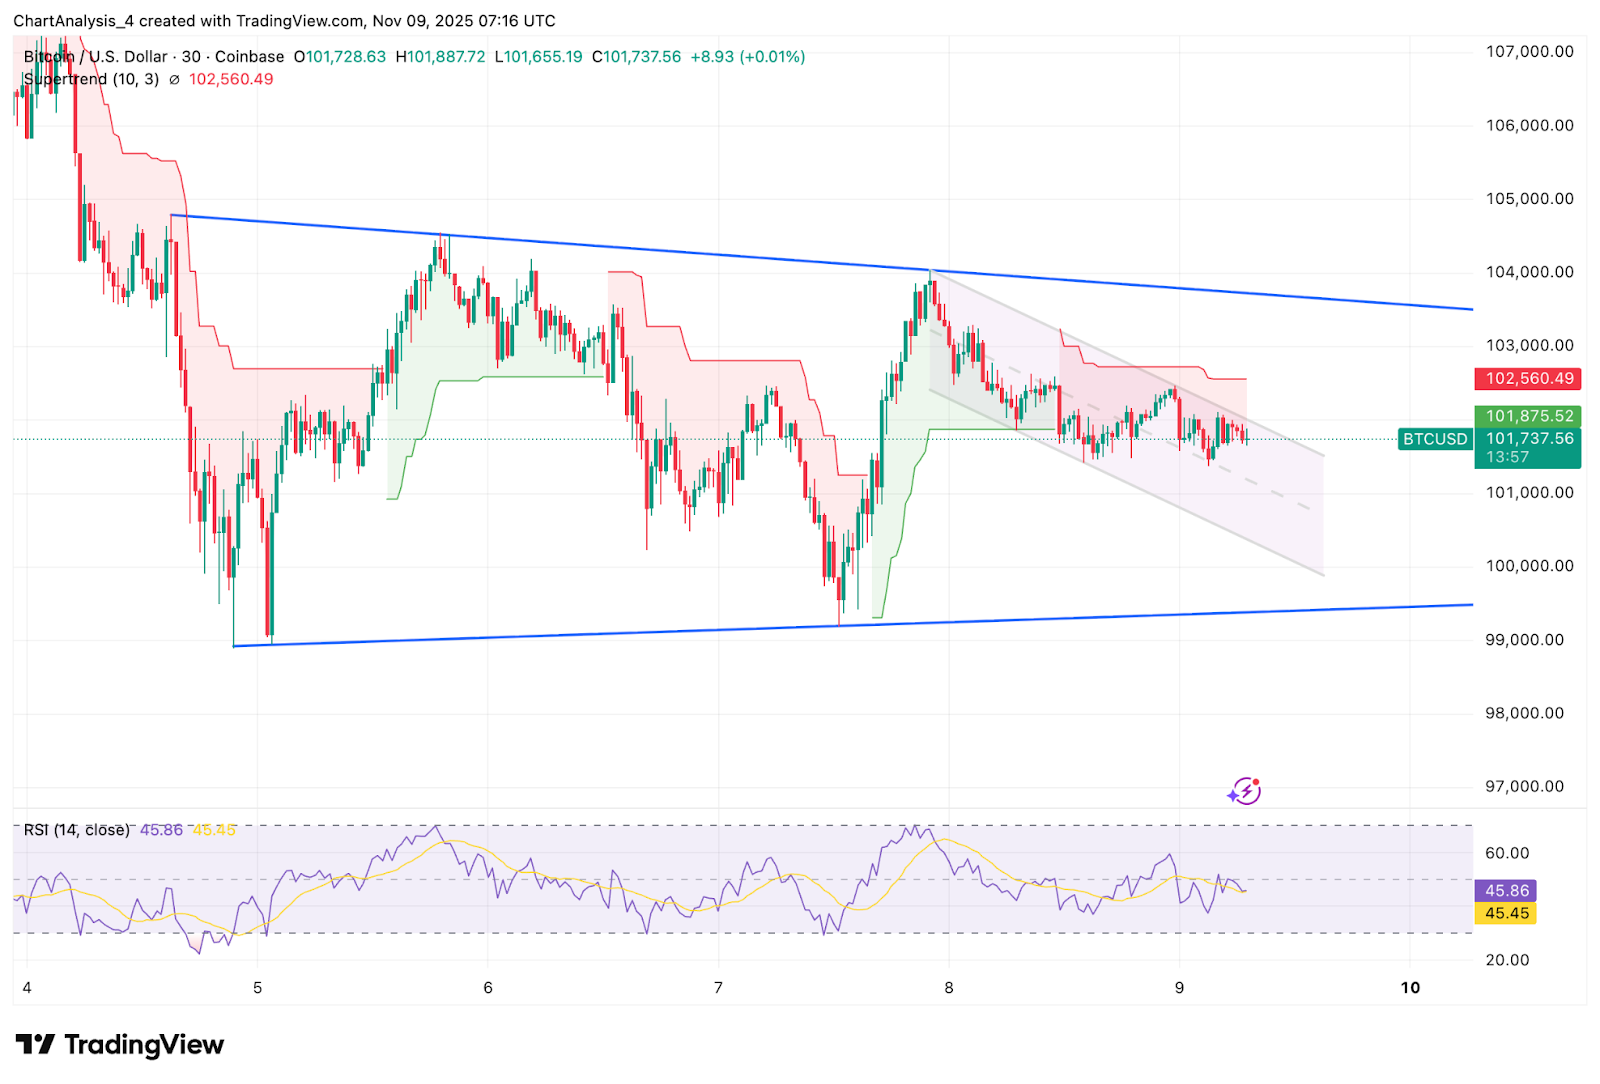
Attempts to bounce have repeatedly failed at the declining trendline on the lower timeframes.
On the lower timeframe structure:
- Bitcoin is trading inside a falling channel
- Price remains below Supertrend resistance at $102,560
- RSI is stuck below 50 at 45, showing a lack of momentum from buyers
Every short term recovery attempt stalls before reaching the midline of the descending channel.
Unless Bitcoin breaks above the Supertrend and clears $103,000, rallies remain reactionary inside a downtrend.
Outlook. Will Bitcoin Go Up?
The next move depends entirely on the $100,000 support zone. It is the final structure preventing a deeper decline.
- Bullish case: A close above $107,000 flips the short term trend and signals that buyers reclaimed control. A break above the EMA cluster near $111,200 would confirm strength and open a path back toward $120,000.
- Bearish case: A daily close below $98,500 confirms a breakdown and exposes the $92,000 level, with extended downside toward $88,000 if outflows accelerate.
Disclaimer: The information presented in this article is for informational and educational purposes only. The article does not constitute financial advice or advice of any kind. Coin Edition is not responsible for any losses incurred as a result of the utilization of content, products, or services mentioned. Readers are advised to exercise caution before taking any action related to the company.


