
- Bitcoin trades at $74,141, down 1%, after briefly hitting a six-week high of $75,912 before sellers stepped in at $74,400 resistance.
- The rally was driven by closure of large $60,000 put options and market maker rehedging, not fresh buying, according to 10x Research.
- US Bitcoin spot ETFs recorded $201.62M in daily inflows on March 16, marking six consecutive days of positive flows.
Bitcoin hit $75,912 in early Asian trading, the highest price since February 4, then gave it all back within hours. The spike was real. The buying behind it was not. That gap between price action and conviction is exactly what makes today’s session important to understand before reading anything bullish into yesterday’s move.
Daily Chart: $74,014 Is The Level Everyone Is Watching
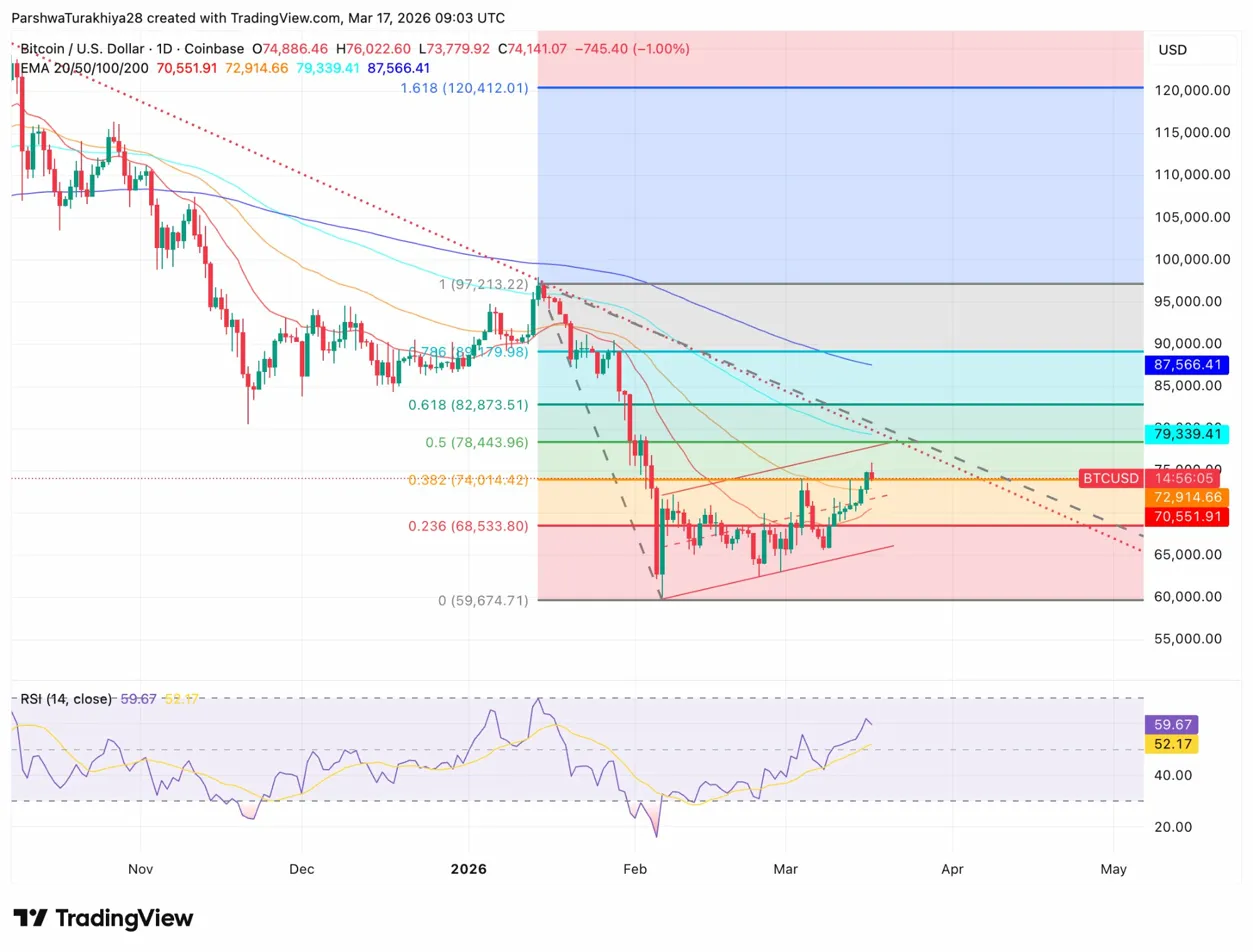
The daily chart shows BTC sitting right on the 0.382 Fibonacci retracement at $74,014, with RSI at 59.67 above the signal line at 52.17. The Fibonacci grid drawn from the February low near $59,674 to the recent swing high maps the recovery road clearly. The 0.382 at $74,014 has now been tested twice in the past 48 hours. Price briefly broke above it to tag the 0.5 level at $78,443 and the 0.618 at $82,873 as the next targets on any sustained continuation.
The four EMAs are stacked between $70,551 and $87,566, all below current price except the 200-day at $87,566. That is meaningful. Price trading above the 20, 50, and 100-day EMAs for the first time since October is a structural shift, but the 200-day at $87,566 is the ceiling that defines whether this is a genuine trend reversal or a corrective bounce.
Key levels:
- 0.382 Fibonacci support: $74,014
- 0.236 Fibonacci support: $68,533
- 0.5 Fibonacci resistance: $78,443
- 0.618 Fibonacci resistance: $82,873
- 200-day EMA: $87,566
The $75,912 Spike Was A Derivatives Squeeze, Not A Breakout
10x Research identified the catalyst clearly. Large bearish put positions tied to $60,000 strike prices were closed in bulk, and as those puts unwound, market makers who had taken the other side needed to rebalance by buying spot BTC. That buying flow pushed price above $75,000 mechanically rather than organically.
The tell was in the options market. No significant upside call buying accompanied the move, which is what you would expect to see if traders were genuinely positioning for continuation above $75,000. Without that, the spike was a squeeze event. Once the rebalancing flows finished, price had nothing to hold it up and fell back below $74,400 within the same session.
That $74,400 level matters specifically because it was a former support from early April 2025 that held selling and preceded the rally to all-time highs above $126,000. Now it has flipped to resistance, and the market is remembering it.
ETF Flows Stay Strong Despite Price Fragility
US Bitcoin spot ETFs recorded $201.62M in net inflows on March 16, the sixth consecutive positive day. BlackRock’s IBIT led with $139.40M, followed by Fidelity’s FBTC with $64.53M. Cumulative net inflows now stand at $56.34B with total net assets at $95.77B, representing 6.45% of Bitcoin’s total market cap.
The ETF flow streak is the most consistent institutional demand signal BTC has had since February. Six straight positive days means institutional buyers are accumulating through the $70,000 to $75,000 range rather than waiting for a breakout to chase. CryptoQuant flagged $80,000 as a key cost basis level for ETF holders, noting resistance should be expected around that zone.
Derivatives: Longs Dominate But Positioning Is Thin
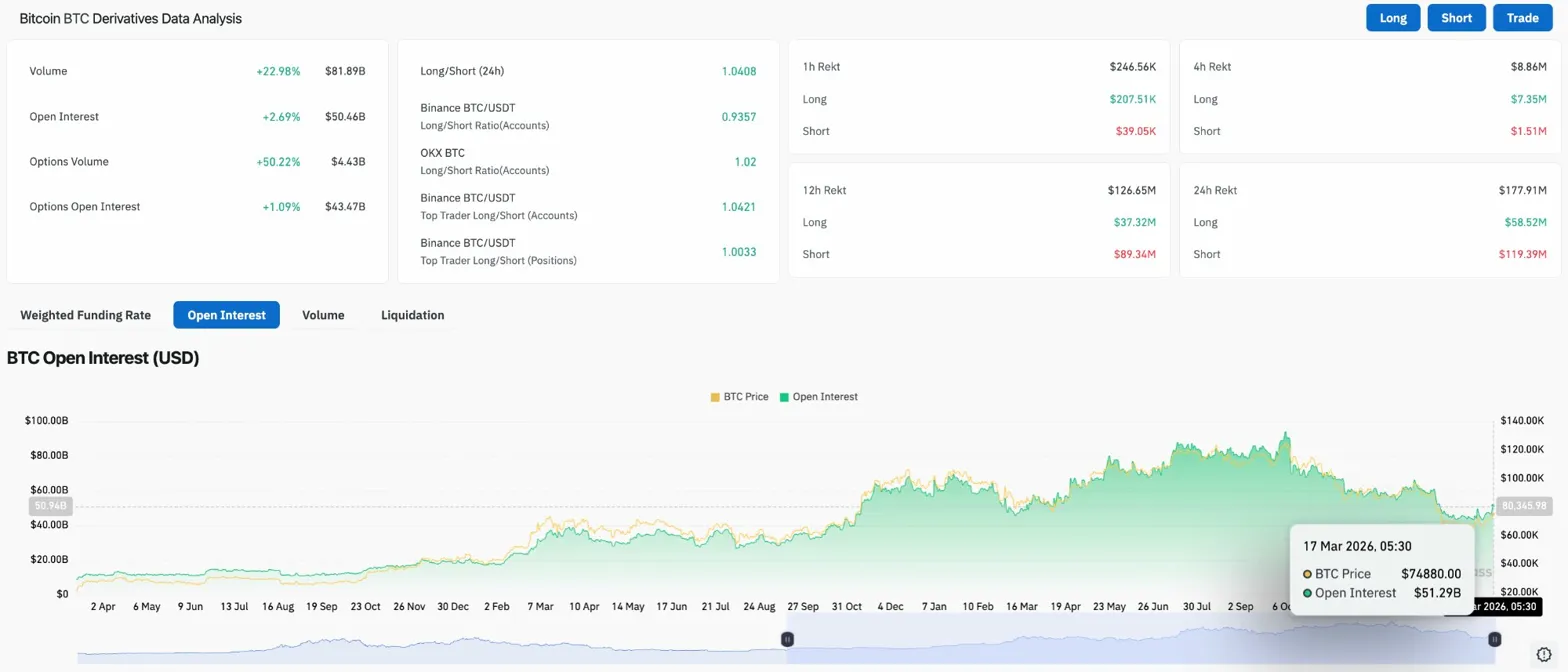
Open interest grew 2.69% to $50.46B as volume rose 22.98% to $81.89B. Options volume jumped 50.22% to $4.43B reflecting heavy activity around the squeeze event. The Binance long/short ratio sits at 0.9357 for accounts and 1.04 for top trader accounts, nearly flat on both sides. Top trader positions at 1.0033 shows institutional positioning is essentially neutral despite the retail long bias visible in the account ratios.
Over 24 hours, longs absorbed $58.52M in liquidations against $119.39M for shorts. Shorts took the bigger hit, but longs were not unscathed when the $75,912 spike reversed. The two-sided liquidation picture is consistent with a choppy, indecisive session rather than a trending one.
Outlook: Will Bitcoin Go Up?
- Bullish case: BTC holds the 0.382 Fibonacci at $74,014 on a daily close, consolidates above $74,400, and pushes toward the 0.5 level at $78,443. Continued ETF inflows above $150M per day and a dovish signal from the Fed on March 18 would give this another leg. The 0.618 at $82,873 and the 200-day EMA at $87,566 are the sequential targets above.
- Bearish case: Failure to reclaim $74,400 on a sustained basis sends price back toward the 0.236 Fibonacci at $68,533. A hawkish Fed outcome or fresh Hormuz escalation would accelerate the move, putting the February lows near $59,674 back in play.
Disclaimer: The information presented in this article is for informational and educational purposes only. The article does not constitute financial advice or advice of any kind. Coin Edition is not responsible for any losses incurred as a result of the utilization of content, products, or services mentioned. Readers are advised to exercise caution before taking any action related to the company.


