
- BTC holds short-term bullish structure with higher highs and rising averages.
- Key resistance clusters near $92.5K–$95K could trigger heightened volatility.
- Spot inflows and steady futures OI support recovery and buyer momentum.
Bitcoin extended its recovery into early January 2026 as buyers defended higher levels on the four-hour chart. Market data shows BTC holding a short-term bullish structure after rebounding from late-December weakness.
Besides price strength, derivatives and spot flow metrics now support the recovery narrative. Consequently, traders are watching whether Bitcoin can sustain momentum near a critical resistance cluster.
Short-Term Structure Signals Buyer Control
Bitcoin continues to post higher highs and higher lows on the four-hour timeframe. This structure confirms that buyers regained control after reclaiming mid-range Fibonacci levels. Moreover, price remains above rising short-term averages, reinforcing trend stability.
The market now approaches a dense resistance area where reactions often intensify. Hence, traders expect increased volatility as BTC tests overhead supply.
Resistance remains layered rather than isolated. The first barrier sits near $92,460, where the 0.786 Fibonacci retracement converges.
Additionally, the $94,650 region marks a prior swing high that capped earlier advances. A sustained push beyond that level could expose the $95,000 psychological zone. However, rejection near current levels would not immediately break the broader structure.
On the downside, Bitcoin holds several well-defined supports that preserve the bullish bias. The $90,700 to $90,400 area combines former resistance and rising exponential averages.
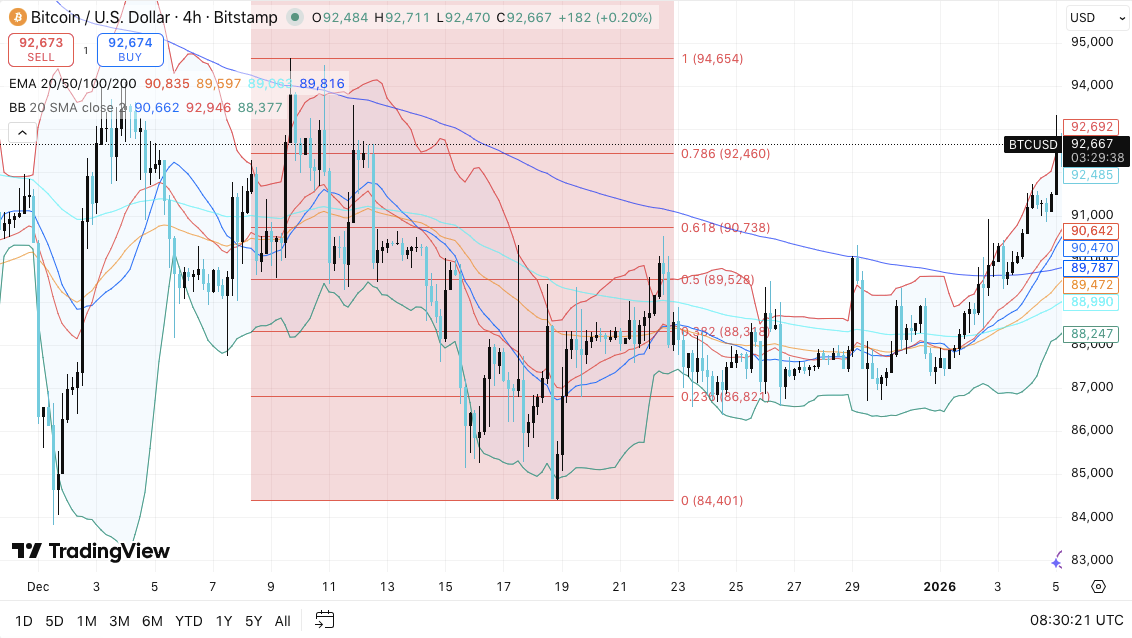
Moreover, the $89,500 level aligns with the 0.5 Fibonacci retracement and short-term structure. Hence, this zone carries technical importance for momentum traders.
Related: Ethereum Price Prediction: ETH Maintains Bullish Structure While Network Vision Expands
Failure to defend $89,500 would shift focus toward the $88,300 to $88,000 region. That area represents a prior breakdown level. Consequently, a deeper pullback could test the $86,800 to $86,400 range low. A move below that zone would invalidate the current bullish setup.
Derivatives and Spot Flows Add Context
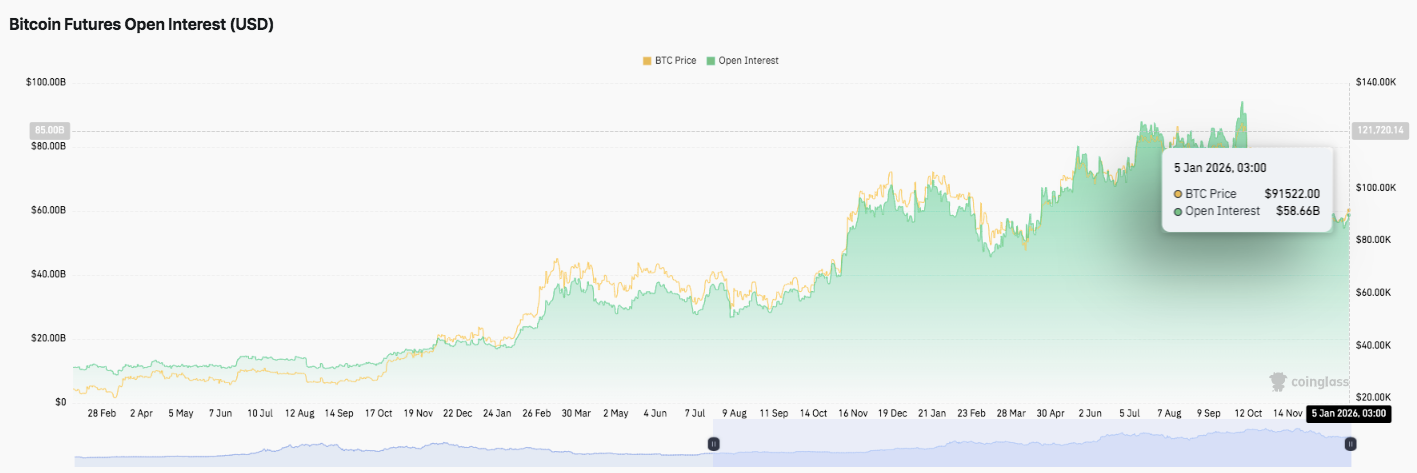
Derivatives data shows Bitcoin futures open interest trending higher alongside price. Open interest climbed steadily into early 2026, reflecting growing trader participation. Significantly, increases remained orderly rather than vertical.
This pattern suggests leverage buildup without excessive liquidation risk. Brief open interest pullbacks aligned with shallow price corrections, indicating routine position resets.
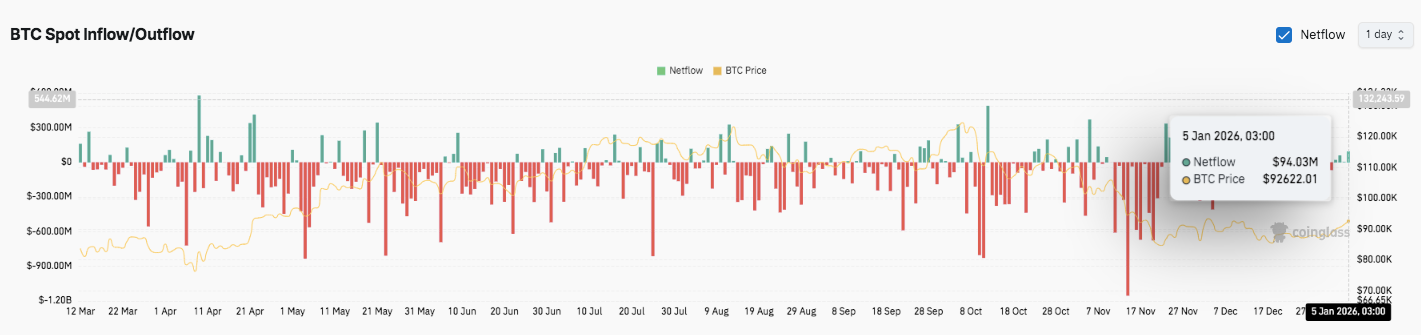
Spot flow data adds further nuance. For much of the period, outflows dominated, reflecting distribution during rallies. However, intermittent inflows emerged near consolidation zones.
Related: Shiba Inu 2026 Prediction: Q2 Privacy Upgrade Battles Meme Stigma After $4M Exploit
Additionally, early January recorded mildly positive netflows near $94 million. This shift signals improving demand and reduced selling pressure. Hence, spot activity now supports short-term price stability.
Technical Outlook for Bitcoin Price
Key levels remain clearly defined for Bitcoin heading into the near term, as price consolidates below a major resistance band.
Upside levels to watch include $92,460 as the first hurdle, followed by $94,650 as the prior swing high. A sustained breakout could extend toward the $95,000 psychological zone if momentum accelerates.
On the downside, immediate support sits at $90,700–$90,400, where short-term EMAs and prior resistance converge. Below that, $89,500 marks a critical structure level aligned with the 0.5 Fibonacci retracement. A loss of this level would expose $88,000, with deeper risk toward $86,800–$86,400 as the broader range low.
The technical picture suggests Bitcoin is consolidating within a rising structure rather than topping. EMAs continue to align bullishly, while Bollinger Bands point to potential volatility expansion.
Will Bitcoin Push Higher?
Bitcoin’s near-term outlook depends on whether buyers can defend $89,500 and force acceptance above $92,460. Stronger inflows and steady open interest growth support the bullish case.
However, failure to hold key support would delay upside continuation and shift focus toward lower range support. For now, Bitcoin remains in a pivotal zone where confirmation will shape the next leg.
Related: Chainlink 2026 Prediction: Institutional RWA Push And CCIP v1.5 Target $45-$75
Disclaimer: The information presented in this article is for informational and educational purposes only. The article does not constitute financial advice or advice of any kind. Coin Edition is not responsible for any losses incurred as a result of the utilization of content, products, or services mentioned. Readers are advised to exercise caution before taking any action related to the company.


