
- Bitcoin struggles under $69K, limiting recovery despite rebounding from $60K macro support.
- Derivatives open interest dropped sharply, signaling deleveraging and cautious market sentiment.
- Spot flows show sustained outflows, reinforcing distribution pressure and short-term weakness.
Bitcoin continues to trade under pressure after failing to hold gains near the $97,970 swing high, leaving the market in a fragile short-term structure. The 4-hour chart shows a decisive rejection at the top, followed by a deep retracement into the Fibonacci range.
Although price rebounded from the $60,104 macro support, buyers have yet to reclaim key resistance. Consequently, momentum remains limited as BTC hovers around $66,900 to $67,000.
Resistance Levels Cap Recovery Attempts
Bitcoin currently trades below the 0.236 Fibonacci level at $69,040, which now acts as immediate resistance. This zone serves as the first breakout trigger for any sustained upside move. If buyers push above $69,000 with conviction, price could target $74,569, the 0.382 retracement and a known supply area.
Moreover, the $79,037 level aligns with the 0.5 retracement and would confirm a broader trend shift. Above that, $83,505 at the 0.618 Fibonacci level stands as strong structural resistance.
However, until BTC clears $69,000 decisively, sellers retain short-term control. The Donchian Channel reinforces this caution, as price continues to hug the lower boundary.
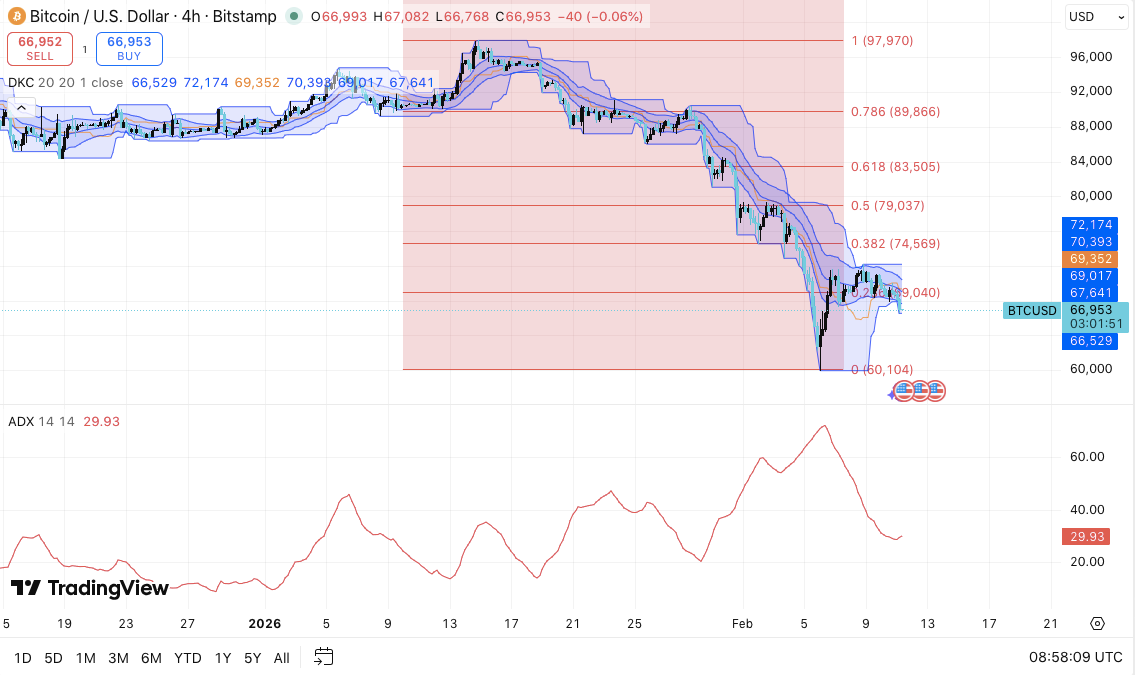
On the downside, the $65,000 to $66,000 range provides immediate short-term demand. This area recently helped stabilize price action.
Related: LayerZero (ZRO) Price Prediction: Can LayerZero Clear $2.46 and Extend Rally?
Nevertheless, the larger macro support at $60,104 carries greater importance. A breakdown below $60,000 could trigger accelerated downside momentum.
Additionally, the Average Directional Index near 30 suggests the prior downtrend held strength. However, trend momentum now cools, indicating possible consolidation rather than immediate continuation.
Open Interest and Spot Flows Signal Caution
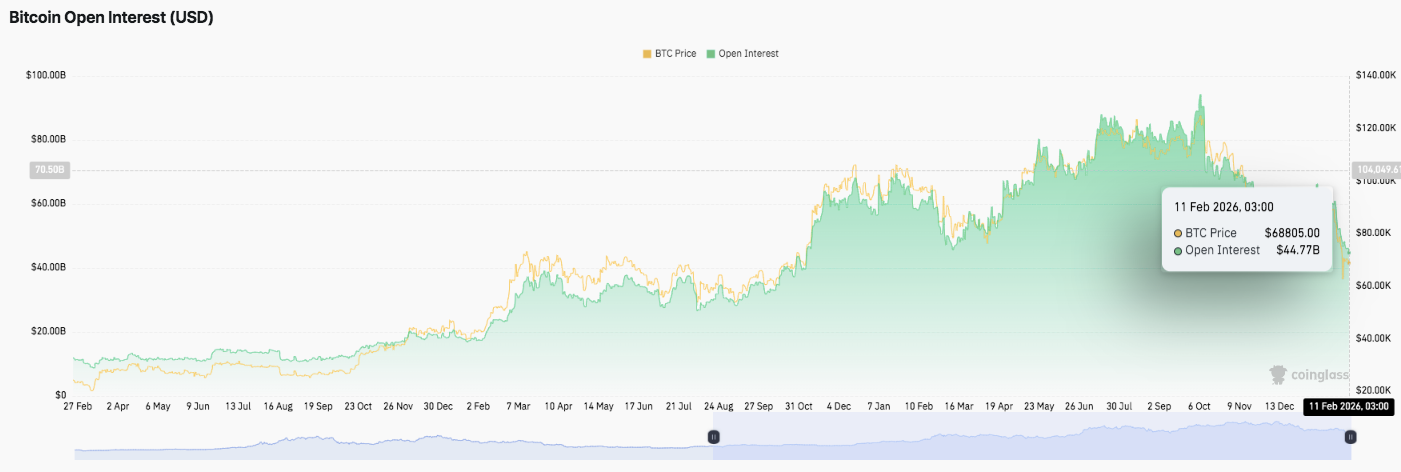
Derivatives data supports a more defensive outlook. Bitcoin open interest recently declined to around $44.7 billion after peaking above $80 billion during earlier rallies. This contraction reflects deleveraging and reduced speculative exposure. Each prior expansion phase ended with sharp unwinds, signaling forced liquidations.
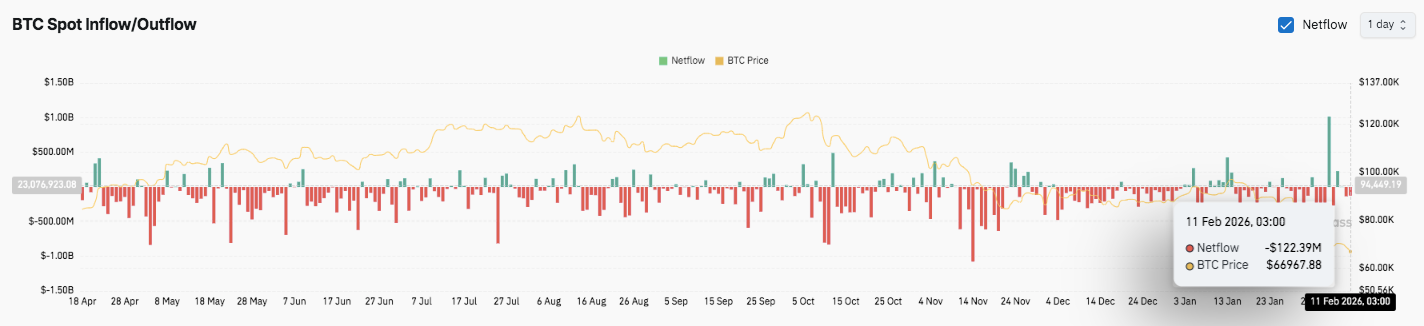
Besides that, spot flow data shows persistent net outflows across several months. Red bars consistently outweigh green inflows, reflecting distribution pressure. Significantly, February 11 recorded a $122 million net outflow, reinforcing cautious sentiment.
Related: Cardano Price Prediction: ADA Tests Multi-Month Lows as Open Interest Drops & Outflows Continue
Technical Outlook for Bitcoin (BTC)
Key levels remain clearly defined as Bitcoin trades below short-term resistance near $69,000. Price continues to recover from the $60,104 macro support, but structure still reflects lower highs on the 4H chart.
Upside levels: $69,040 (0.236 Fib) stands as the immediate hurdle. A clean breakout could open the door toward $74,569 (0.382 Fib). Above that, $79,037 (0.5 Fib) becomes the key trend-shift level. If momentum strengthens, BTC could extend toward $83,505 (0.618 Fib), where major structural resistance sits.
Downside levels: $65,000–$66,000 remains the first short-term demand zone. Below that, $60,104 acts as critical macro support. A decisive break under $60,000 could expose Bitcoin to deeper retracement levels and accelerate selling pressure.
The broader technical picture shows Bitcoin compressing after a strong directional move. The Donchian Channel reflects price hugging the lower boundary, signaling lingering weakness. Meanwhile, ADX previously signaled trend strength but now shows cooling momentum.
From a derivatives perspective, declining open interest suggests leverage reduction rather than aggressive accumulation. Spot outflows also reflect cautious positioning.
Will Bitcoin Break Higher?
Bitcoin’s near-term direction depends on whether buyers reclaim $69,000 with conviction. Sustained strength above this level could trigger a relief rally toward $74,500 and potentially $79,000. However, failure to flip $69,000 into support keeps the broader bearish bias intact.
For now, BTC trades in a pivotal zone. Volatility compression suggests a larger move may follow. Confirmation from volume, inflows, and momentum indicators will determine the next leg.
Related: River Price Prediction: Spot Listing Sparks 33% Rally As RIVER Tests Triangle Resistance
Disclaimer: The information presented in this article is for informational and educational purposes only. The article does not constitute financial advice or advice of any kind. Coin Edition is not responsible for any losses incurred as a result of the utilization of content, products, or services mentioned. Readers are advised to exercise caution before taking any action related to the company.


