
- Bitcoin holds near $70K as support at $68K faces pressure in a tightening range.
- Fibonacci and Ichimoku resistance near $75K keeps broader bearish structure intact.
- Open interest drop to $46.8B signals leverage reset despite active market activity.
Bitcoin trades near $70,000 after a turbulent stretch that erased gains from the previous rally. The market now enters a critical consolidation phase between major support and resistance zones. Traders watch this range closely because it could define Bitcoin’s next macro direction.
Price Structure Signals a Decision Zone
Bitcoin still trades below key Fibonacci retracement levels following the sharp decline from the $126,000 swing high. Consequently, the overall market structure still favors a broader corrective trend. The current price sits close to $70,600 after bouncing from the $60,000 region earlier this year.
Immediate support lies between $68,300 and $68,556, where Ichimoku Tenkan and Kijun lines intersect. This zone currently anchors the market’s consolidation. A decisive break below this range could quickly push Bitcoin toward $65,000. Moreover, that level marks the next minor support formed during the previous rebound attempt.
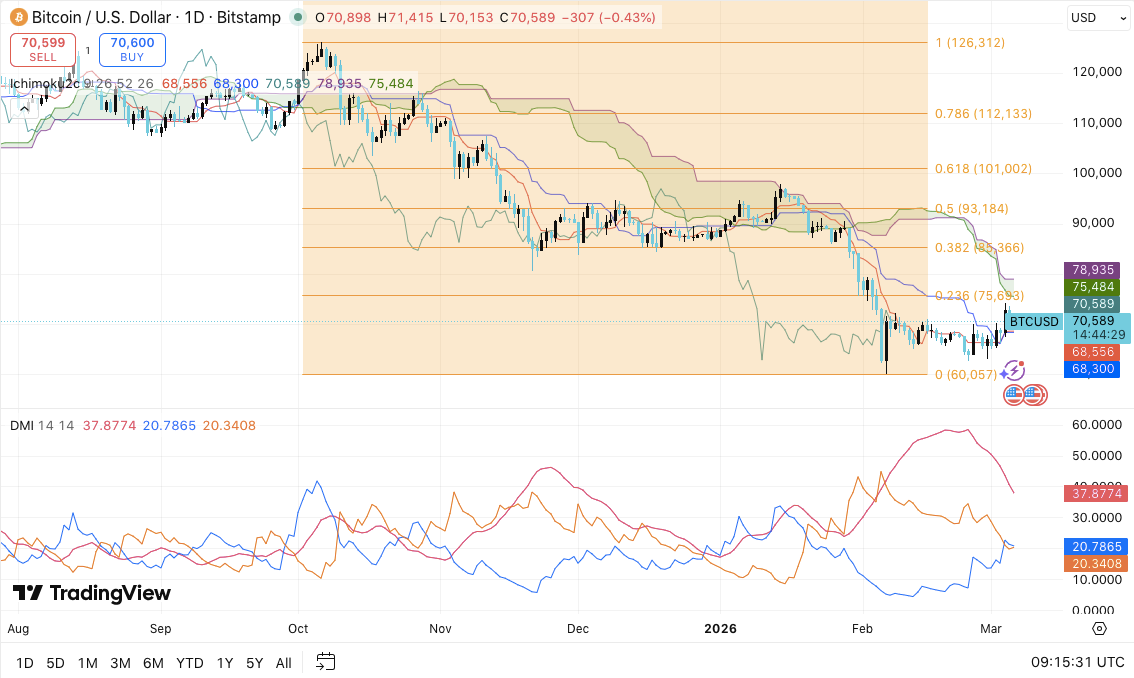
The strongest defense remains near $60,057, which represents the February bottom and the 0 Fibonacci retracement level. Consequently, losing this level could expose deeper downside toward $55,000 or even $50,000.
Related: XRP Price Prediction: First ETF Outflows In Weeks Hit as XRP Tests Resistance
On the upside, resistance appears near $75,693, which aligns with the 0.236 Fibonacci retracement. Additionally, the lower edge of the Ichimoku cloud sits in this area. Bulls must reclaim this zone to shift momentum. A breakout above $75,000 could open the path toward $85,366 and eventually $93,184.
Indicators Suggest Weakening Downtrend
The Ichimoku structure still shows a bearish bias because price remains below the cloud. However, the gap between price and resistance continues to narrow. Hence, a stronger upward push could test cloud resistance soon.
Directional Movement Index data provides additional context. The ADX indicator stands near 37, which reflects strong trend conditions.
However, the positive and negative directional lines now converge. This convergence signals fading bearish dominance rather than confirmed bullish momentum.
Derivatives Activity and Exchange Flows
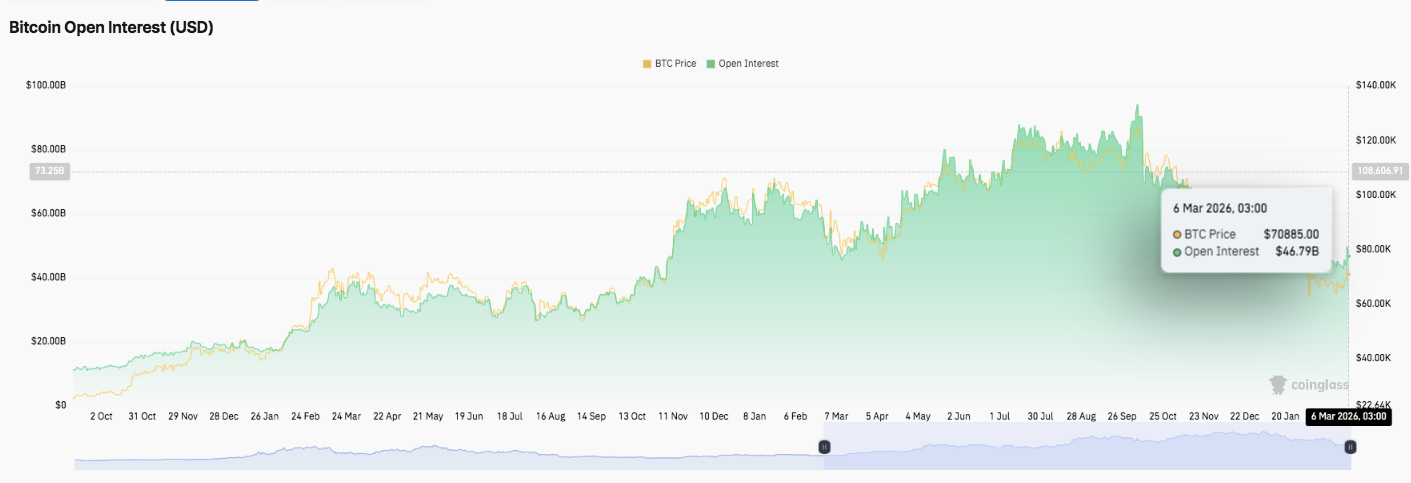
Open interest data highlights how leverage cycles shape Bitcoin’s price behavior. During the latest rally phase, open interest climbed above $80 billion. Consequently, the derivatives market expanded rapidly alongside price appreciation.
Recently, open interest declined to roughly $46.8 billion while Bitcoin trades near $70,000. This drop indicates traders reduced leverage after the previous correction. Nevertheless, participation remains elevated compared with earlier cycles.
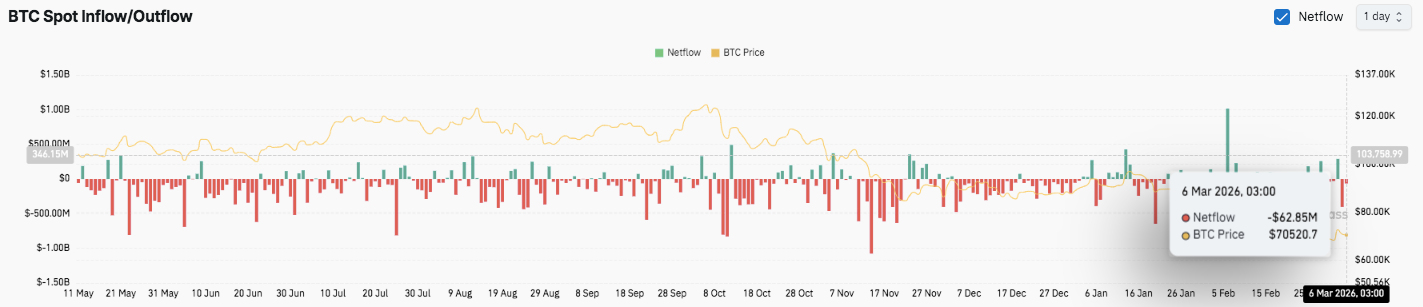
Spot exchange flow data reveals mixed investor sentiment across the past year. Several months recorded persistent outflows from exchanges, particularly during late July and November. Moreover, those outflows suggest long-term holders moved assets into cold storage.
Related: Ethereum Price Prediction: ETH Stabilizes After February Drop but Bears Still Control the Trend
However, inflow spikes appeared periodically, including a major surge close to $1 billion in early February. Consequently, these inflows often coincide with short-term selling pressure.
Technical Outlook for Bitcoin Price
Key levels remain clearly defined as Bitcoin trades inside a narrow consolidation range near $70,000. The market currently balances between recovery momentum and broader corrective pressure. Traders now focus on whether Bitcoin can reclaim higher resistance levels or revisit deeper support zones.
Upside levels: $75,693 stands as the first major resistance and the key level to break for renewed bullish momentum. A successful breakout could open the door toward $85,366, followed by the $93,184 region, which represents the 0.5 Fibonacci retracement and a potential trend reversal zone.
Downside levels: Immediate support sits between $68,300 and $68,556, where short-term indicators converge. If this support fails, Bitcoin could quickly slide toward the $65,000–$66,000 area. Below that, the $60,057 level remains the most critical structural support for the current cycle.
Resistance ceiling: The $75,000–$78,000 region aligns with the lower boundary of the Ichimoku cloud and currently acts as a major technical barrier. Bitcoin must reclaim this zone to confirm a shift back toward bullish structure.
Overall, the technical structure shows Bitcoin compressing within a defined decision range between $68,000 and $75,000. This consolidation follows a strong correction from the previous peak near $126,000 and reflects a market searching for direction.
Will Bitcoin Go Up?
Bitcoin’s short-term outlook depends heavily on whether buyers can defend the $68,000 support zone while building enough momentum to challenge the $75,700 resistance area. If bullish pressure strengthens and price closes above this level, the market could quickly extend toward $85,000 and possibly $93,000.
However, failure to hold the $68,000 region could revive selling pressure. In that scenario, Bitcoin may revisit the $65,000 zone before testing the major $60,000 support again.
Related: OKB Price Prediction: OKB Eyes $128 Rally After Strong Bounce from February Bottom
For now, Bitcoin remains in a pivotal phase. The broader correction appears to be stabilizing, yet clear technical confirmation is still required. Consequently, the next breakout above resistance or breakdown below support will likely determine the market’s next major trend.
Disclaimer: The information presented in this article is for informational and educational purposes only. The article does not constitute financial advice or advice of any kind. Coin Edition is not responsible for any losses incurred as a result of the utilization of content, products, or services mentioned. Readers are advised to exercise caution before taking any action related to the company.


 Price Prediction: Canton Eyes Key Break After Market Activity Spike")

