
- Bitcoin nears $71.5K, testing critical resistance at the Ichimoku cloud.
- Derivatives open interest stabilized near $47B after major liquidation cycles.
- Net exchange outflows signal ongoing long-term Bitcoin accumulation by investors.
Bitcoin trades near $71,540 as the market navigates a critical technical zone that could shape the next major move. Recent price action shows the asset recovering after a sharp correction, yet several indicators suggest the broader trend remains fragile. Traders now watch whether Bitcoin can reclaim higher resistance levels or face renewed selling pressure.
Technical Structure Points to a Decision Zone
Bitcoin’s daily chart reveals a market attempting to regain momentum after a corrective phase. Price currently approaches the lower boundary of the Ichimoku cloud, which often acts as resistance during bearish conditions. However, the market has not yet reclaimed this zone, leaving the broader trend uncertain.
Momentum indicators also highlight the delicate balance. The Bollinger Band percentage sits near 0.88, suggesting price trades close to the upper volatility range. Consequently, short-term traders may expect temporary pullbacks before any sustained upward move.
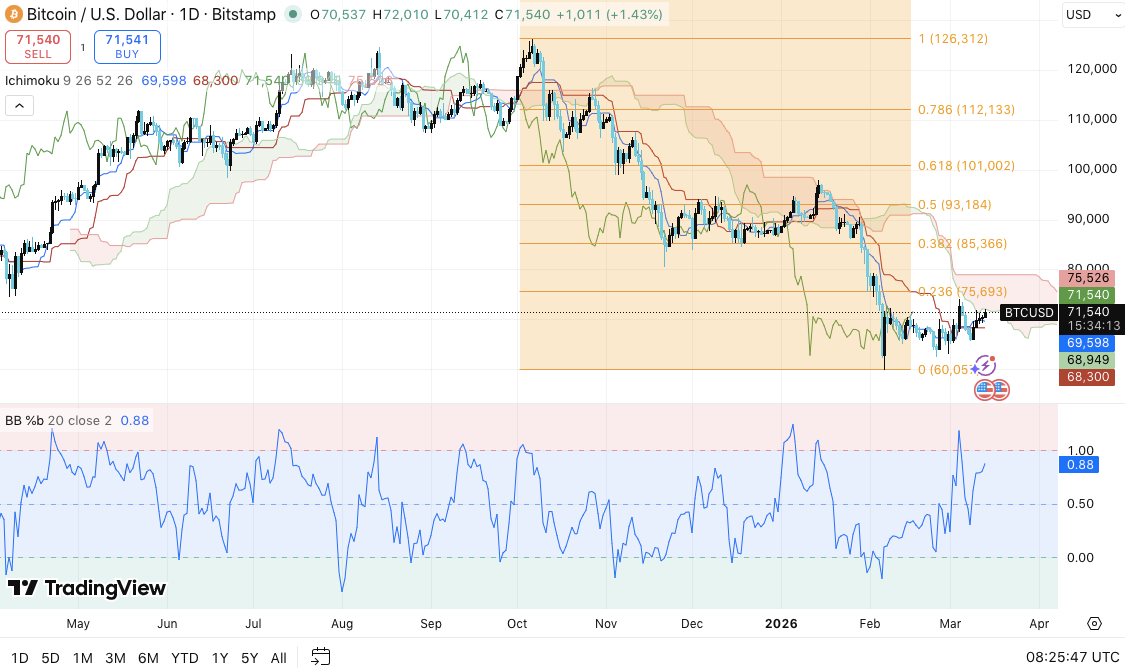
Key Fibonacci retracement levels outline the most important resistance areas ahead. The first major barrier stands near $75,693, representing the 0.236 retracement level.
If buyers break that zone, the next targets appear around $85,366 and $93,184. These levels historically attract strong selling pressure during corrective cycles.
However, downside risks remain present. Immediate support sits near $70,000. A decisive break below that area could push Bitcoin toward the $67,000–$65,000 region. Moreover, analysts view $60,000 as a critical structural support level that protects the broader market structure.
Derivatives Activity Shows Cycles of Leverage
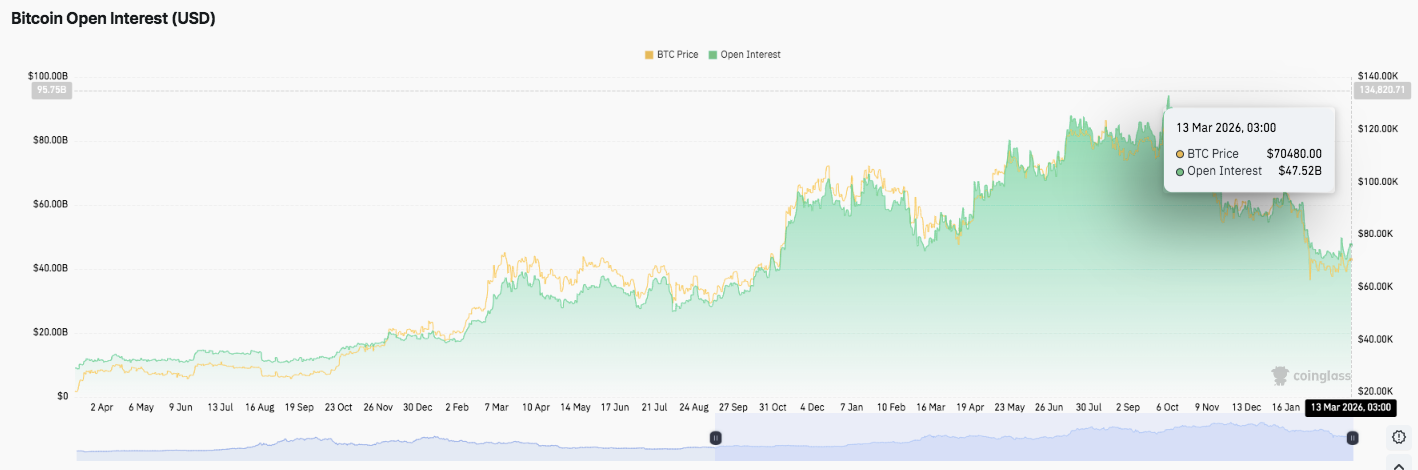
Open interest trends reveal how traders have positioned themselves during recent market swings. At the start of the observed period, Bitcoin derivatives exposure remained relatively modest near $10 billion. However, leverage steadily expanded as price momentum strengthened during late spring and summer.
Significantly, open interest surged during the major rally and approached the $80 billion to $90 billion range. This rapid growth reflected aggressive speculative participation across futures markets.
Volatility later triggered large liquidations, which forced a sharp reduction in leveraged positions. Consequently, open interest declined and eventually stabilized near $47 billion by March 2026. This reset suggests the market removed excessive leverage before potential new positioning.
Exchange Flows Suggest Ongoing Accumulation
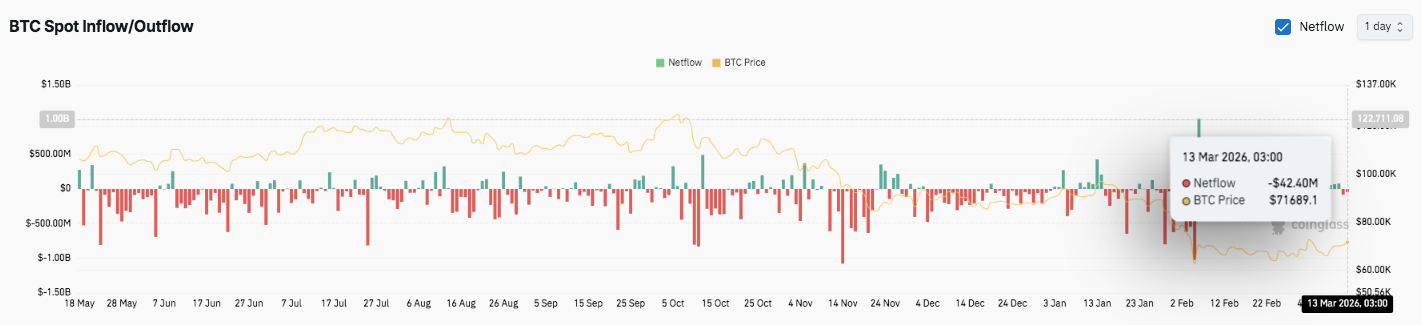
Spot exchange flows add another layer to the current market narrative. Data shows consistent Bitcoin outflows across much of the timeline, indicating investors frequently move coins off exchanges. Such activity often signals long-term accumulation or transfers into cold storage.
Related: Pi Network Price Prediction: PI Jumps Toward $0.3 Ahead Of PiDEX Launch
Additionally, the strongest outflow periods occurred while price moved higher. This pattern implies demand absorbed available supply during rallies. However, inflows appeared more frequently as prices softened toward early 2026.
Even so, the latest data still shows net outflows. Hence, many investors continue withdrawing Bitcoin rather than preparing to sell.
Technical Outlook for Bitcoin Price
Key levels for Bitcoin remain clearly defined as the market approaches a decisive resistance zone near $75,000.
Upside levels: $72,000–$75,000 stands as the immediate resistance cluster where price currently faces pressure. A confirmed breakout above $75,693, which aligns with the 0.236 Fibonacci level, could open the path toward $85,366. Beyond that, the next upside barriers appear at $93,184 and $101,002, where broader bullish confirmation may emerge.
Downside levels: $70,000 remains the first important support zone in the current structure. If sellers push price below that level, Bitcoin may revisit the $67,000–$65,000 demand area that previously stabilized corrections. A deeper breakdown could expose the larger structural support around $60,000.
Resistance ceiling: The $75,000–$76,000 region currently acts as the key resistance to flip for sustained bullish momentum. This level also aligns with the Ichimoku cloud boundary, making it a crucial technical threshold for trend reversal signals.
The broader chart structure suggests Bitcoin trades within a recovery phase after a recent downtrend. Price continues to move beneath the Ichimoku cloud, which indicates that the larger trend still leans cautious. However, tightening price action near resistance hints at a potential volatility expansion if buyers regain control.
Will Bitcoin Go Up?
Bitcoin’s short-term outlook largely depends on whether buyers can hold the $70,000 support zone while attempting another move toward $75,000. Technical compression near resistance, combined with strong accumulation signals from exchange outflows, suggests market participants continue positioning for potential upside.
If momentum strengthens and price secures a breakout above $75,000, Bitcoin could gradually advance toward $85,000 and $93,000 in the coming weeks. Continued outflows from exchanges also indicate investors may prefer long-term holding strategies rather than immediate selling pressure.
However, failure to defend $70,000 could shift sentiment quickly. A breakdown below this level may trigger renewed selling pressure toward $67,000 or even $60,000.
Related: Solana Price Prediction: SOL Targets $94 Supertrend After Mastercard Partnership
Disclaimer: The information presented in this article is for informational and educational purposes only. The article does not constitute financial advice or advice of any kind. Coin Edition is not responsible for any losses incurred as a result of the utilization of content, products, or services mentioned. Readers are advised to exercise caution before taking any action related to the company.


 Price Prediction: Bulls Drive Rally Toward $1 After 967% Surge")

