
- Bitcoin holds above $67,000 after falling 47% from October all-time high near $126,000, testing the critical support zone.
- Open interest rises 1.47% to $45.41B as volume surges 27%, signaling renewed position building after recent liquidations.
- Analysts predict Bitcoin could drop to $50,000 in summer as four-year halving cycle enters bearish phase.
Bitcoin price today trades near $67,082, down 0.48% in the past 24 hours as the market remains trapped in a tight range between $66,000 and $72,000. The consolidation comes after a sharp recovery from the February 5 crash below $60,000, with buyers and sellers locked in a standoff as the debate over Bitcoin’s four-year cycle intensifies.
Open Interest Climbs As Traders Rebuild Positions
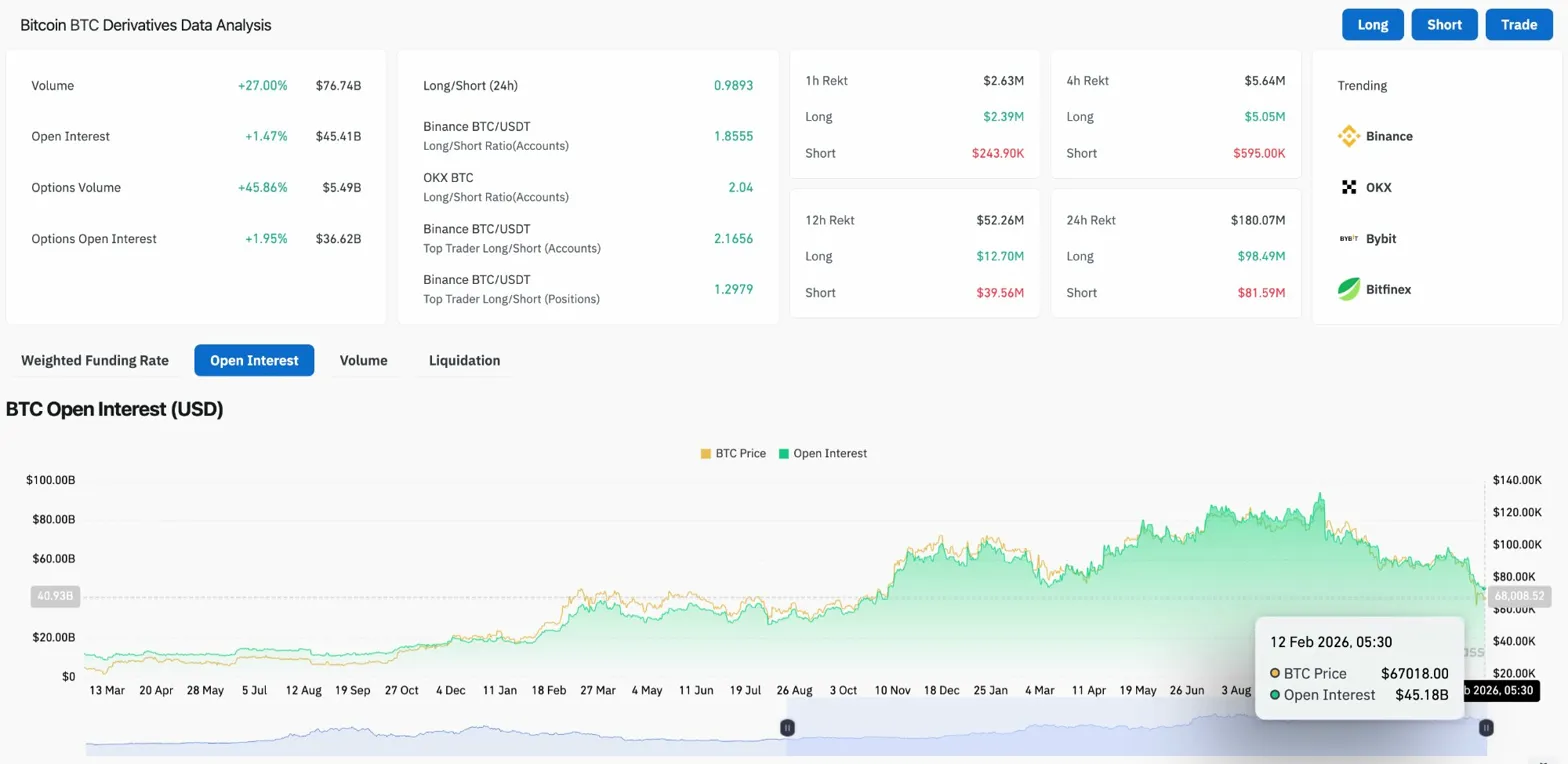
BTC Derivative Analysis (Source: Coinglass)
According to Coinglass, Bitcoin’s open interest increased 1.47% to $45.41 billion, suggesting traders are re-entering the market after the liquidation cascade that hit on February 5. Volume surged 27% to $76.74 billion, the highest level in weeks, confirming that participation has returned.
Long/short ratios remain elevated at 1.86 on Binance and 2.04 on OKX, indicating that leverage still skews bullish despite the 47% drawdown from the October highs. Top trader positioning shows long bias across exchanges, with accounts holding $2.39 million in longs versus $243,900 in shorts on 1-hour timeframes.
The liquidation event on February 5 forced traders to close positions as Bitcoin broke below $70,000, triggering a cascading effect that pushed price down to $60,000. Those liquidations have since slowed, allowing the market to stabilize in the current range.
Price Trapped Below All Major EMAs
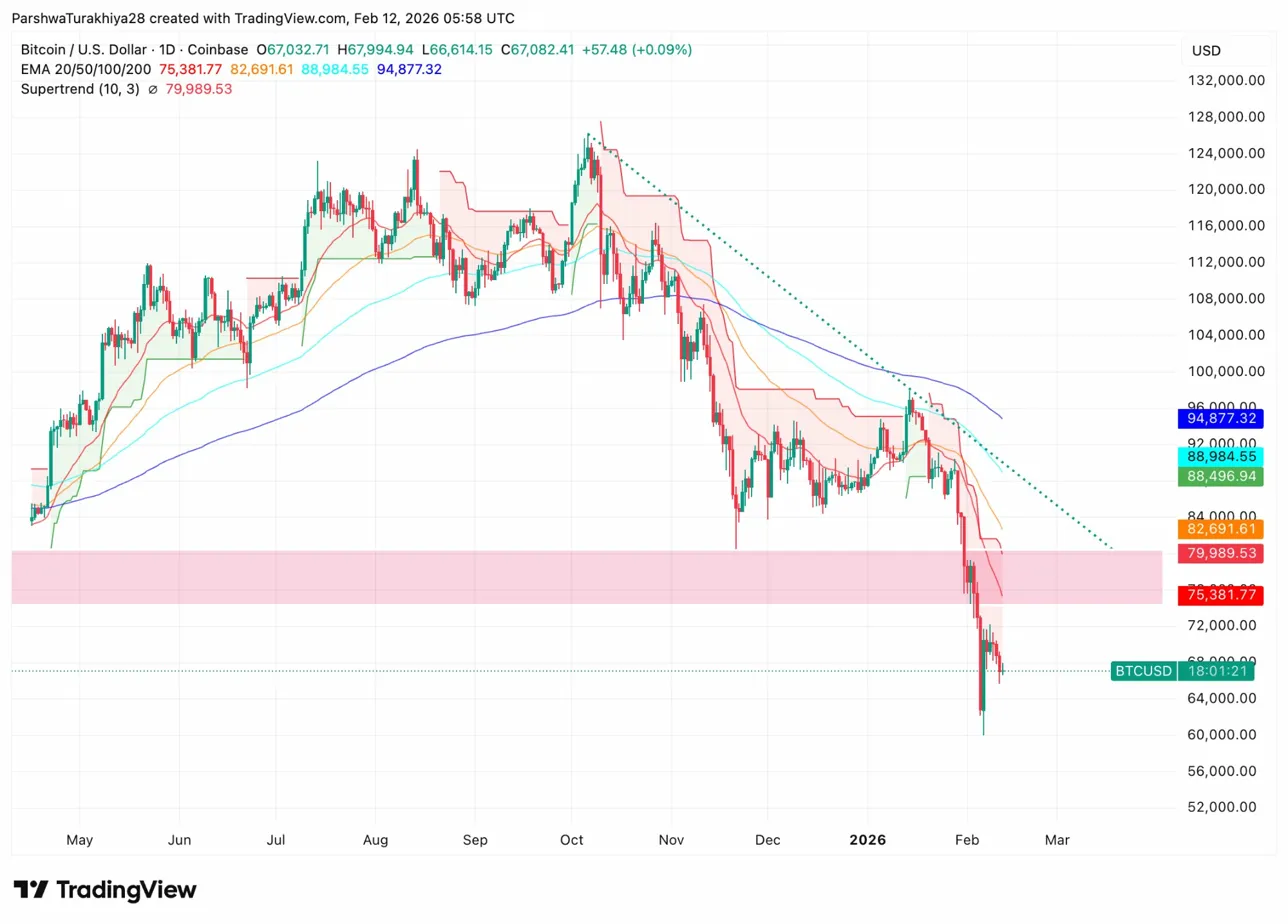
On the daily chart, Bitcoin trades below all major moving averages. The 20-day EMA sits at $75,381, the 50-day at $82,691, the 100-day at $88,984, and the 200-day at $94,877. All four EMAs are stacked downward, forming a clear resistance ceiling.
The chart shows:
- Supertrend indicator bearish at $79,989, confirming downside pressure
- Price testing the $75,000 to $80,000 support zone
- Descending trendline from October highs capping rallies
- $60,000 acting as critical psychological support
Bitcoin lost the 20-day EMA in late January and has failed multiple attempts to reclaim it. The structure has shifted from higher lows to lower highs, placing the market in a corrective phase. A daily close above $75,381 would flip the 20-day EMA and signal the first sign of trend exhaustion.
Related: Berachain (BERA) Price Prediction: Can Bulls Flip $1.42 After $0.35 Base?
The $60,000 level, tested on February 5, represents a key demand zone. A breakdown below that level would expose the $50,000 target that analysts like Markus Thielen of 10X Research and Steven McClurg of Canary Capital expect to hit during the summer.
Four-Year Cycle Debate Shapes Market Outlook
Market participants are divided on whether Bitcoin’s typical halving cycle remains intact. The pattern historically shows a rally to new all-time highs following the halving event, followed by a crash and subsequent consolidation before the next cycle.
The most recent halving occurred in April 2024. Bitcoin rallied to $126,000 in October, then dropped 47%. McClurg told CNBC he expects 2026 to be the “bear leg” of the four-year cycle, with Bitcoin potentially falling to $50,000 in summer before turning around in the fall.
The consolidation between $66,000 and $72,000 reflects this uncertainty. Bulls argue that the cycle is intact and Bitcoin will eventually break higher. Bears point to the breakdown below major EMAs and the failure to reclaim $75,000 as evidence that the correction has further to run.
Intraday Action Shows Consolidation At Range Lows
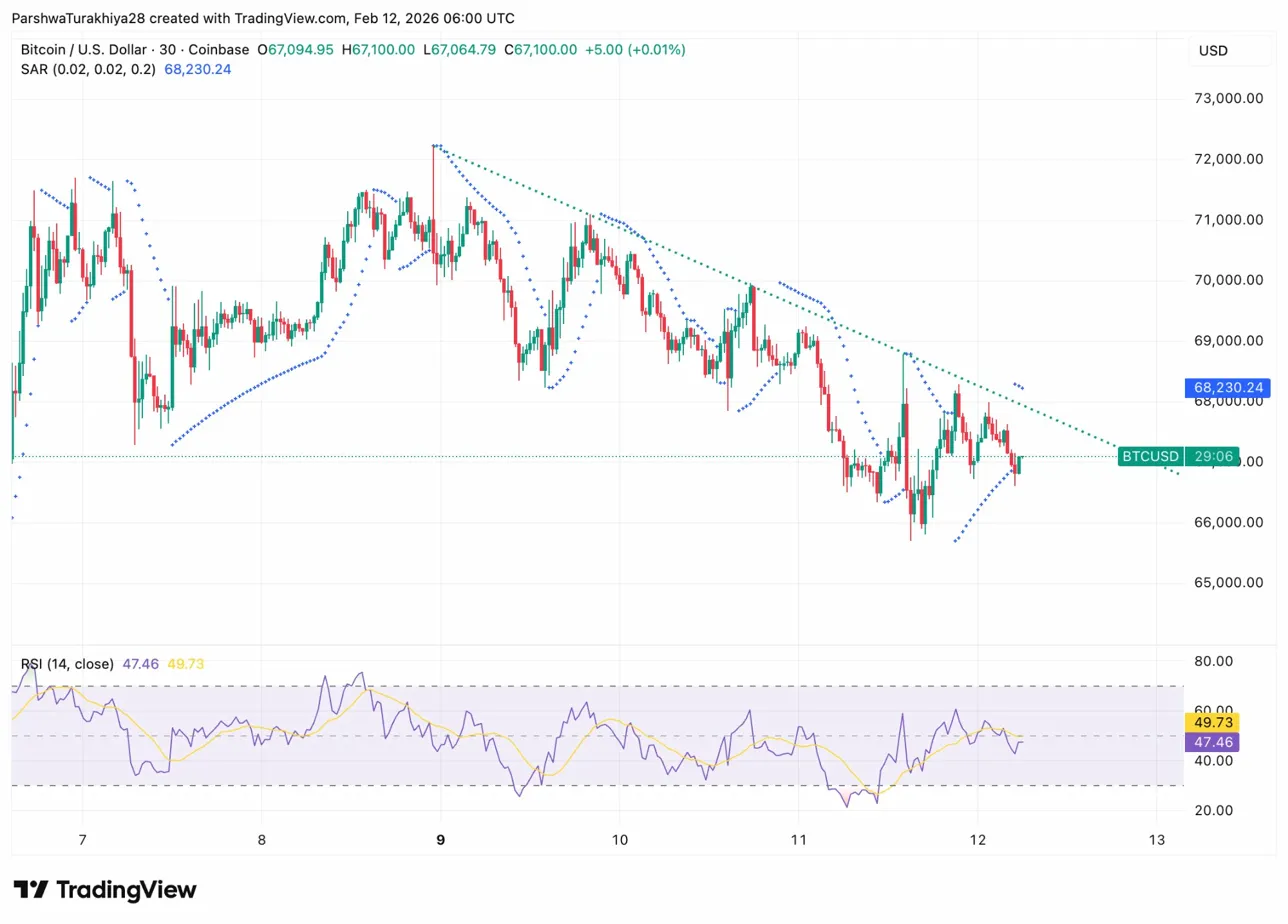
The 30-minute chart reveals Bitcoin consolidating near $67,100 after failing to break above $72,000. Parabolic SAR sits at $68,230, acting as immediate resistance. RSI holds at 47.46, neutral but declining as sellers defend each rally attempt.
The structure shows:
- Price trapped inside a descending channel
- Higher lows forming from the $66,000 base
- SAR flipping bearish after rejection at $70,000
Buyers need to reclaim $68,230 and break above $70,000 to shift momentum back toward neutral. Until that happens, every bounce remains a relief rally inside a bearish trend. A breakdown below $66,000 would trigger another leg down toward the $60,000 support zone.
Outlook: Will Bitcoin Go Up?
The next move depends on whether Bitcoin can hold $66,000 and reclaim the 20-day EMA at $75,381.
- Bullish case: A close above $75,381 with strong volume and sustained ETF inflows would flip the 20-day EMA and place $82,691 back in range. That would invalidate the breakdown and signal the corrective phase is ending.
- Bearish case: A breakdown below $66,000 exposes $60,000, with further downside toward $50,000 if the four-year cycle bear leg plays out as expected.
If Bitcoin reclaims $75,381 and breaks the descending trendline, momentum shifts. Losing $66,000 turns the move into a deeper correction toward $50,000.
Related: Linea Price Prediction: LINEA Surges 35% After Social Engagement Dominance Shifts Sentiment
Disclaimer: The information presented in this article is for informational and educational purposes only. The article does not constitute financial advice or advice of any kind. Coin Edition is not responsible for any losses incurred as a result of the utilization of content, products, or services mentioned. Readers are advised to exercise caution before taking any action related to the company.
 Price Prediction: XRP Stuck in Tight Range as Traders Watch $1.40 Support")
 Price Prediction: BTC Consolidates as Bulls Eye Breakout Above 72K")

 Price Prediction: Will Bulls Break Above 0.0635?")
