
- BTC trades near $87,050 as buyers defend the $86,000 trendline that anchors the long-term structure.
- Spot and ETF outflows exceed $270M across two sessions, keeping pressure on every rebound attempt.
- Price remains below all major EMAs, leaving BTC trapped between rising long-term support and a falling channel.
Bitcoin price today trades near $87,050 after defending the $86,000 support zone for a second session. The rebound comes as sellers continue to pressure the market with heavy spot and ETF outflows, leaving buyers to protect a narrow range while the broader trend stays tilted lower.
Price sits below the 20 day EMA at $93,937, the 50 day EMA at $101,716 and the 200 day EMA at $105,813. This alignment keeps the structure bearish despite the latest bounce. The chart shows Bitcoin caught between a rising long term trendline and a descending short term channel, creating a compressed setup ahead of November’s final trading days.
Spot Outflows Rise As Buyers Slow Participation
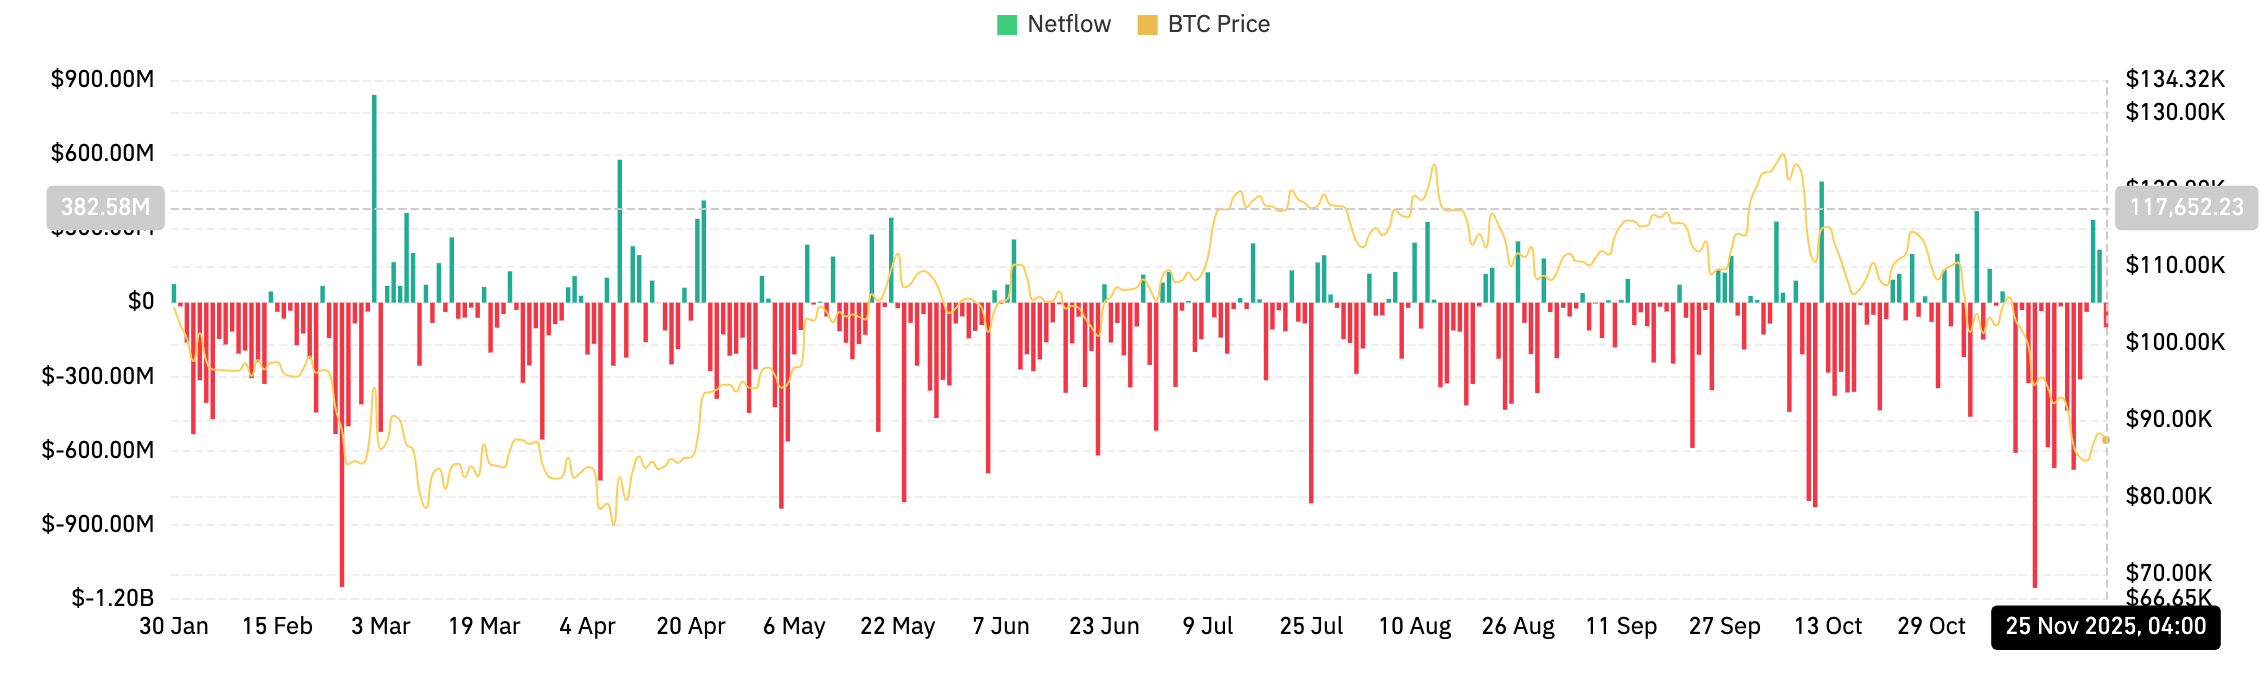
Coinglass data shows $122.39 million in net outflows on November 25, one of the larger exit days this month. The red streak in recent sessions reflects consistent selling pressure as coins move back to exchanges instead of cold wallets. Traders continue to unwind exposure rather than add size, which removes upward momentum from the tape.
This distribution bias has been visible since early November. Each attempt to recover above $90,000 has been met with renewed outflows, showing that sentiment remains cautious.
ETF Outflows Reinforce Downside Pressure
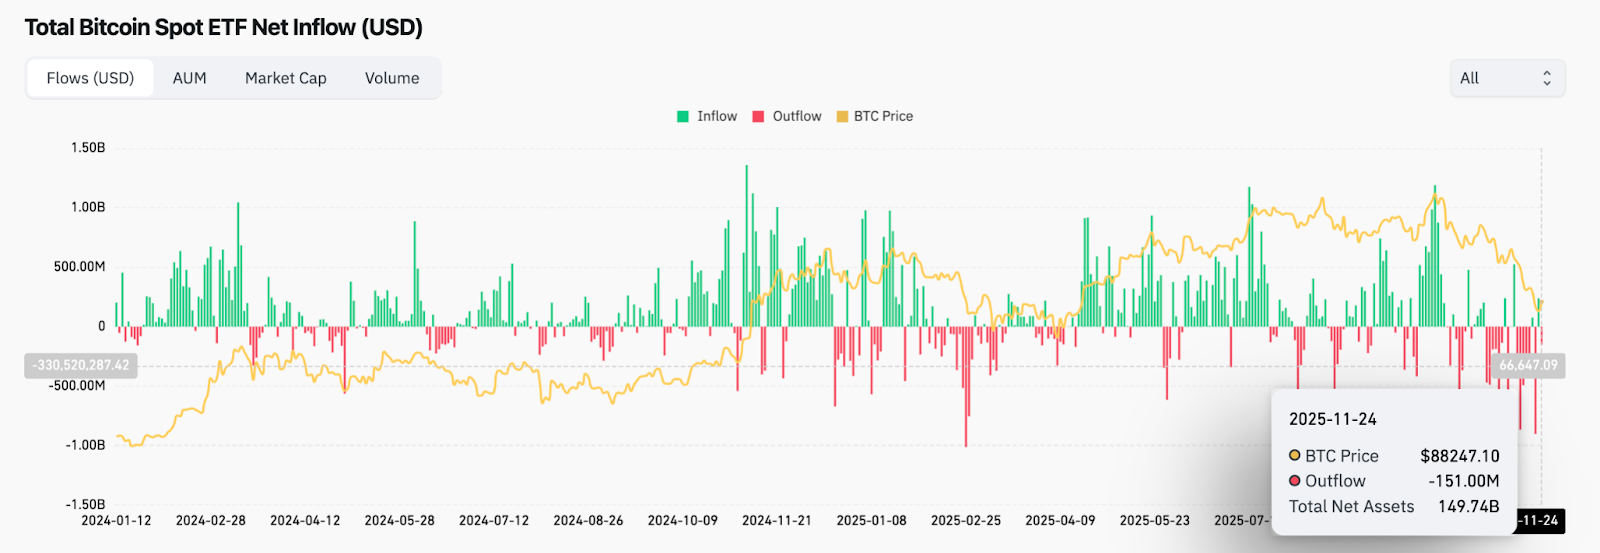
Bitcoin spot ETF flows add another layer of pressure. On November 24, ETFs recorded $151 million in outflows. That aligns with the broader two week trend where redemptions have exceeded inflows, pulling liquidity away from the spot market.
Related: Ethereum Price Prediction: ETH Struggles in Downtrend While BitMine Grows to 3% Supply Share
With total ETF net assets sitting near $149.74 billion, the latest exits show funds reducing risk instead of adding to positions at lower prices.
Trendline Retest Defines The Medium Term Structure
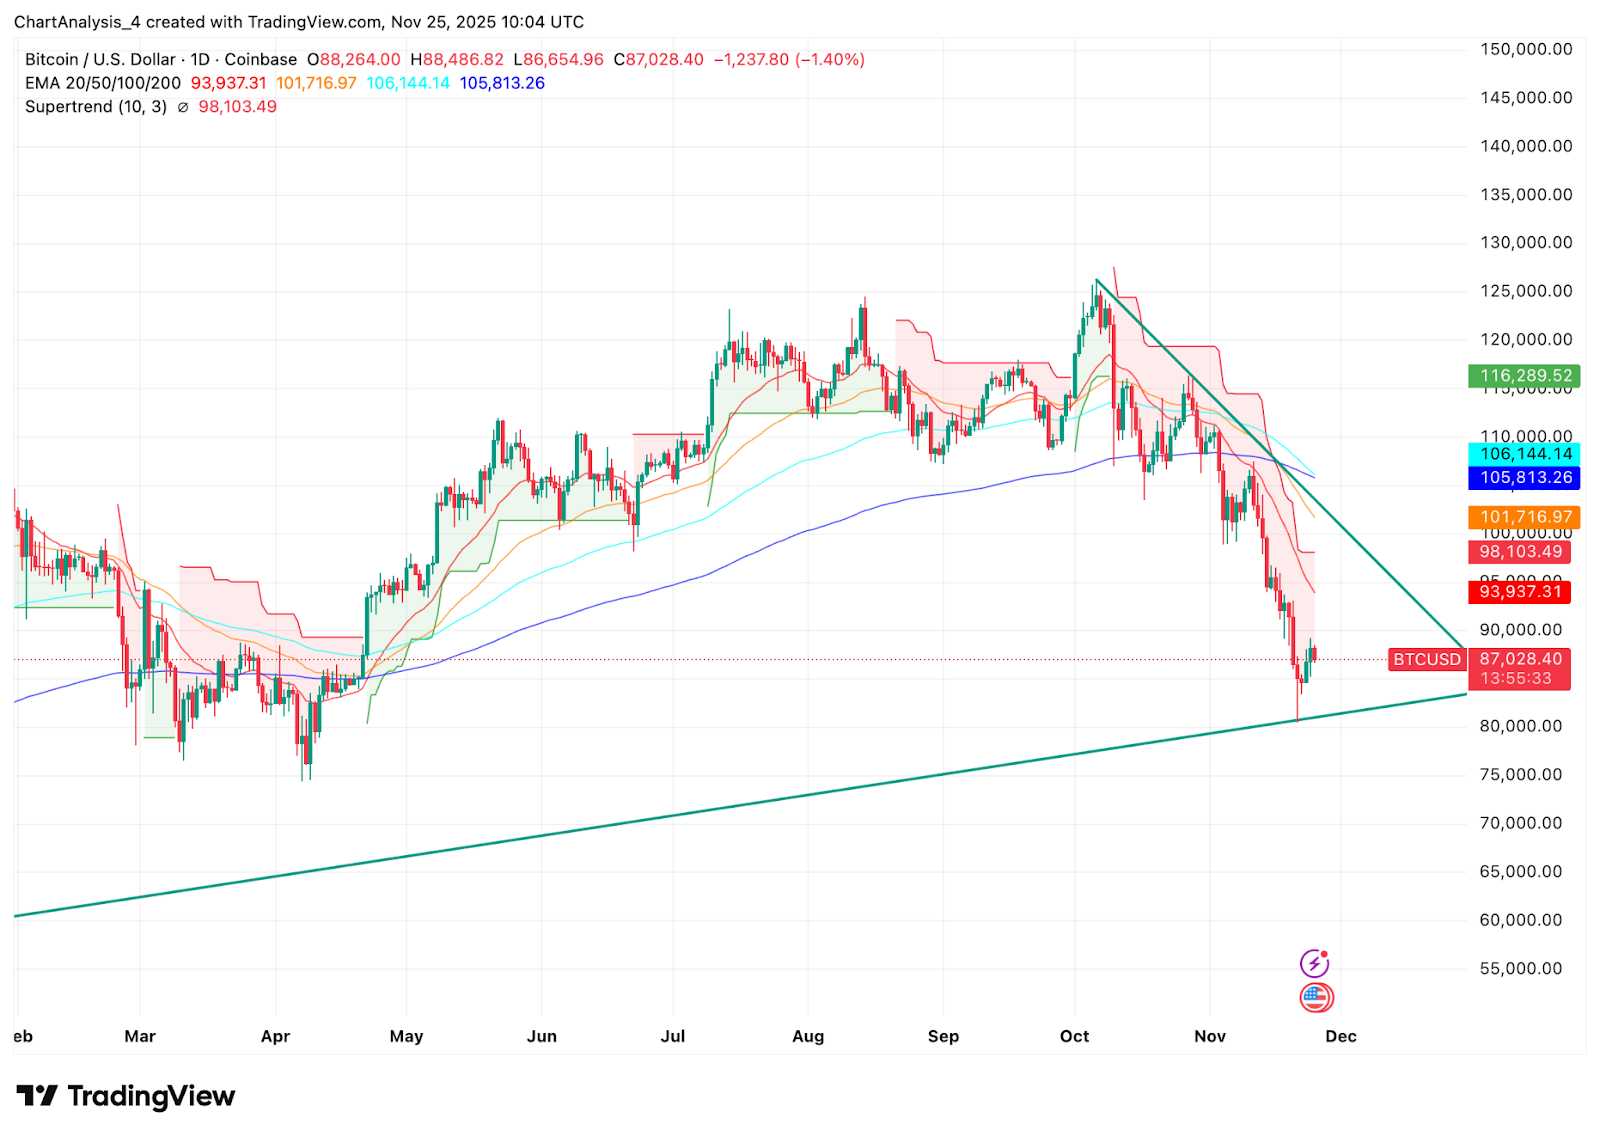
On the daily chart, Bitcoin trades below the entire EMA cluster. The failure to reclaim the 20 day EMA at $93,937 keeps short term momentum firmly with sellers. The Supertrend indicator sits at $98,103 and remains red, reinforcing the downtrend.
The long term rising trendline from early 2023 is now the key support. Price recently bounced from this zone near $86,000. If buyers defend this line, Bitcoin can maintain a broader uptrend even if short term momentum stays weak. A clean break below the trendline would shift the medium term structure into a deeper corrective phase.
Related: Solana Price Prediction: SOL Attempts Rebound While ETF Expansion Signals Market Interest
The descending resistance from the $124,000 peak continues to cap rallies. Every rejection along this line has resulted in lower highs, showing sellers still control the pattern.
Intraday Momentum Shows Early Stabilization
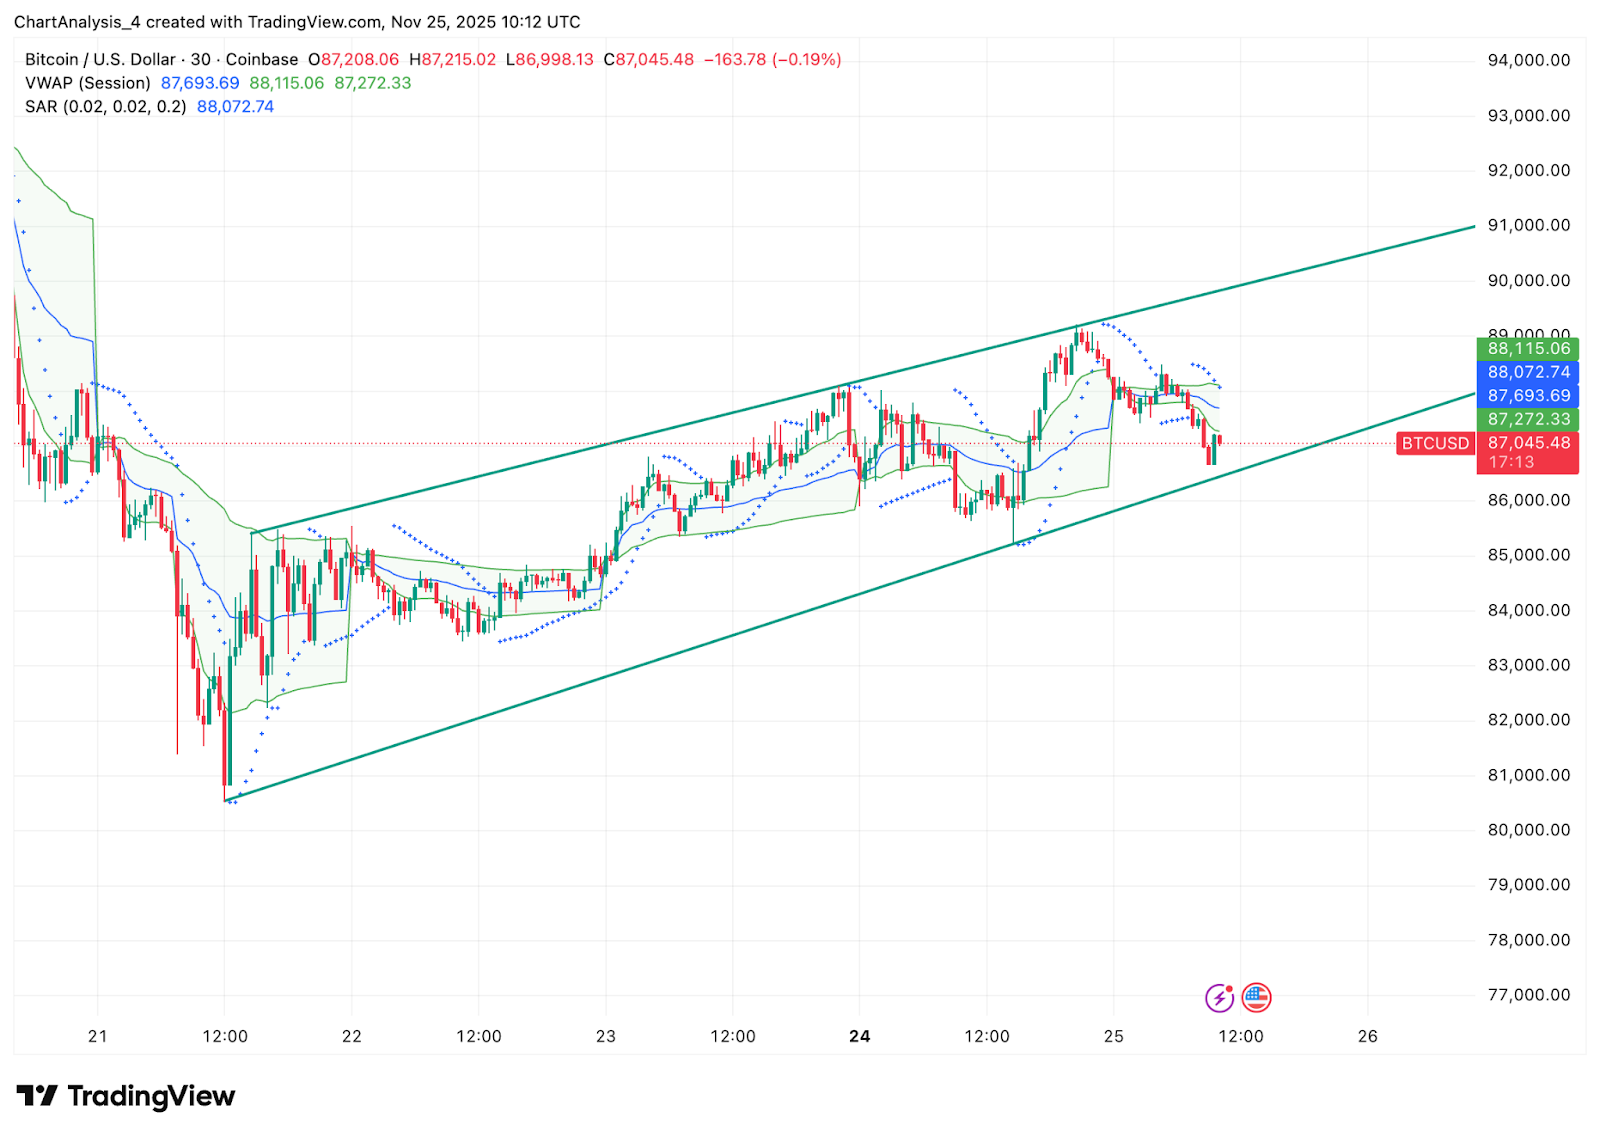
The 30 minute chart provides a closer view of short term behavior. Price is trading inside a rising channel that started after the plunge into the $82,000 region. The channel support near $86,500 has held through several tests, showing intraday buyers remain active at this level.
VWAP sits near $87,693 and price is slightly below it, signaling mild downside pressure during the current session. The SAR dots have flipped above price, showing a temporary shift against buyers. For a stronger recovery, Bitcoin must break above $88,272 and reclaim the upper channel resistance near $90,500.
If the channel holds into the U.S. session, Bitcoin can attempt another push toward the $89,500 area. If price loses the lower channel boundary, the market will likely revisit $85,500 and test deeper liquidity pockets.
Outlook. Will Bitcoin Go Up?
Bitcoin now sits on a crucial support that will decide the next major swing.
- Bullish case: A close above $93,937 followed by strong volume through $101,716 would signal buyers regaining control. Clearing the EMA cluster opens the path toward $110,000 and weakens the downtrend that has dominated November.
- Bearish case: A daily close below $86,000 breaks the long term trendline and exposes the $82,000 region. Losing that level invites deeper pressure toward $78,500 as liquidity shifts lower.
If Bitcoin reclaims the 20 day EMA, momentum begins to stabilize. If it loses $86,000, the corrective phase deepens into December.
Related: Monad (MON) Price Prediction 2025, 2026, 2027, 2028–2030
Disclaimer: The information presented in this article is for informational and educational purposes only. The article does not constitute financial advice or advice of any kind. Coin Edition is not responsible for any losses incurred as a result of the utilization of content, products, or services mentioned. Readers are advised to exercise caution before taking any action related to the company.

 Price Prediction: Canton Eyes Key Break After Market Activity Spike")


