
- Bitcoin remains below key EMAs, keeping sellers in structural control of price action.
- Derivatives open interest dropped sharply, signaling reduced leverage and weaker conviction.
- Spot flows show mixed accumulation, highlighting inconsistent buying and profit-taking swings.
Bitcoin continues to struggle under mounting technical pressure as price action remains trapped below key resistance levels. Although buyers defended the $60,000 region and sparked a short-term rebound, the broader structure still favors sellers. Market data shows weakening derivatives activity and inconsistent spot demand.
Consequently, traders now watch whether Bitcoin can reclaim critical Fibonacci and EMA barriers. The current setup suggests caution dominates sentiment despite the recent bounce.
Technical Structure Remains Bearish
On the 4-hour chart, Bitcoin maintains a broader downtrend. Price rejected sharply near the 0.786 Fibonacci retracement at $89,866. That rejection reinforced strong overhead resistance.
Moreover, the decline accelerated after losing the 0.618 level at $83,505. Sellers also pushed price below the 0.5 retracement at $79,037.
Additionally, Bitcoin failed to sustain momentum above the 0.382 level at $74,569. That area now acts as firm resistance. The market then formed a swing low near $60,104, marking a temporary capitulation zone. Buyers stepped in aggressively at that level. However, the rebound stalled near $68,000.
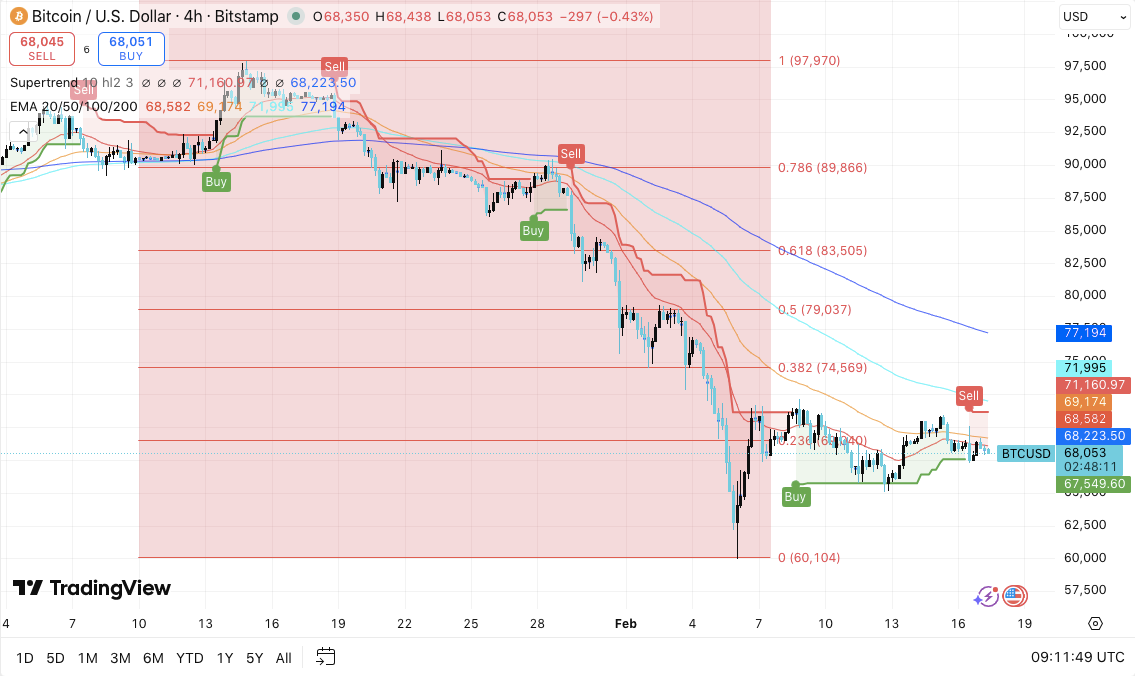
Significantly, Bitcoin trades below the 20, 50, 100, and 200 EMAs. These moving averages cluster between $69,000 and $77,000. This alignment creates a heavy resistance ceiling. As long as price remains beneath $71,000 to $74,500, sellers retain structural control.
Key resistance stands at $69,100 to $71,200, followed by $74,569 and $79,037. On the downside, support rests at $66,000 and $63,500. The major swing low at $60,104 remains critical. A decisive break below $60,000 could trigger renewed downside momentum.
Open Interest Signals Reduced Leverage
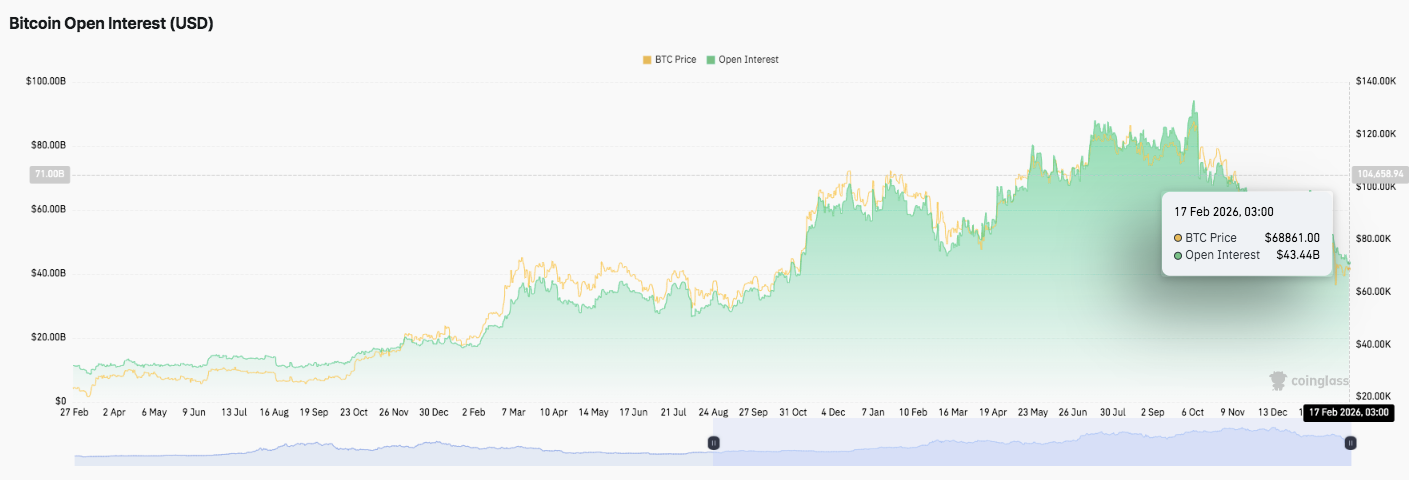
Bitcoin’s derivatives market reflects a cooling phase. Open interest previously surged above $80 billion during the major rally. That expansion signaled aggressive leverage and rising speculative appetite. However, volatility later forced heavy liquidations and position closures.
Open interest now sits near $43 billion. This sharp contraction shows traders reduced leverage exposure. Consequently, the market appears less overheated than during prior peaks. Lower leverage often reduces forced liquidations. Nevertheless, it also signals weaker conviction among speculative participants.
Spot Flows Show Mixed Conviction
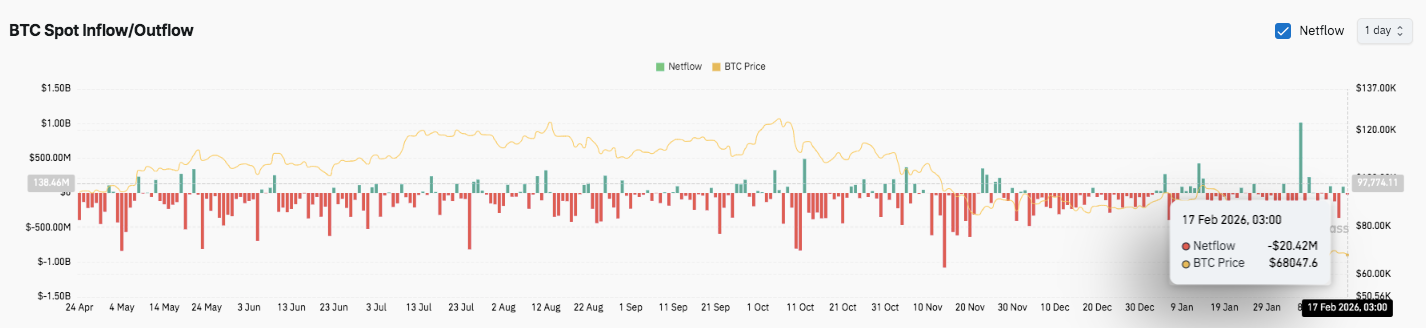
Spot flow data reveals persistent volatility. Early periods showed dominant outflows, indicating distribution during price strength. Moreover, large red spikes appeared during major pullbacks. These prints confirmed reactive selling pressure.
Mid-cycle inflows improved temporarily. However, profit-taking frequently followed rallies. Recently, inflows strengthened around late January and mid-February. Green spikes suggested renewed accumulation. Yet flows remain inconsistent overall.
Technical Outlook for Bitcoin Price
Key levels remain clearly defined as Bitcoin consolidates near the $68,000 zone. The broader structure still leans bearish on the four-hour chart. However, price continues to defend the major swing low at $60,104, keeping relief potential alive.
Upside levels: $69,100–$71,200 stands as the first resistance cluster, aligning with short-term EMAs and a prior breakdown zone. A decisive push above this range could open the path toward $74,569 (0.382 Fibonacci). Beyond that, $79,037 (0.5 Fibonacci) becomes the next major hurdle. A sustained breakout above $79,000 would shift short-term momentum and expose $83,505.
Downside levels: Immediate support sits at $66,000, followed by $63,500, which marks a recent consolidation base. The critical structural floor remains $60,104. A breakdown below $60,000 would invalidate the current stabilization attempt and likely accelerate downside momentum.
Resistance ceiling: The EMA cluster between $69,000 and $77,000 forms a heavy supply zone. Bitcoin must reclaim this region to restore medium-term bullish momentum. Until then, rallies may face selling pressure.
The technical picture suggests Bitcoin trades within a broader corrective phase after rejecting higher Fibonacci retracements. Price compression beneath the EMA cluster signals building pressure. A decisive breakout above $74,500 could trigger short covering and volatility expansion. However, continued rejection below $71,000 would reinforce bearish structure.
Will Bitcoin Move Higher?
Bitcoin’s near-term direction depends on whether buyers can defend $66,000 and build momentum toward $71,000. Strong inflows and rising open interest would support a recovery scenario. If bulls reclaim $74,500, price could extend toward $79,000 and possibly $83,500.
Conversely, failure to hold $60,000 would shift focus to deeper downside levels. For now, Bitcoin remains in a pivotal zone where confirmation, not anticipation, will determine the next major move.
Disclaimer: The information presented in this article is for informational and educational purposes only. The article does not constitute financial advice or advice of any kind. Coin Edition is not responsible for any losses incurred as a result of the utilization of content, products, or services mentioned. Readers are advised to exercise caution before taking any action related to the company.


 Price Prediction: Canton Eyes Key Break After Market Activity Spike")

