
- Bitcoin spot ETFs record $100.18 million in daily inflows, marking four consecutive days of institutional accumulation led by BlackRock.
- Spot exchange outflows hit $126.52 million, signaling that retail and shorter-term traders are distributing into ETF-driven strength.
- Price remains capped below the 100-day EMA at $95,981, with bulls needing a close above $99,500 to shift momentum.
Bitcoin price today trades near $95,676 after failing to reclaim the 100-day EMA for the third consecutive session. The move comes as institutional and retail flows diverge, creating a tug-of-war between ETF accumulation and spot distribution.
ETF Inflows Continue For Fourth Straight Day
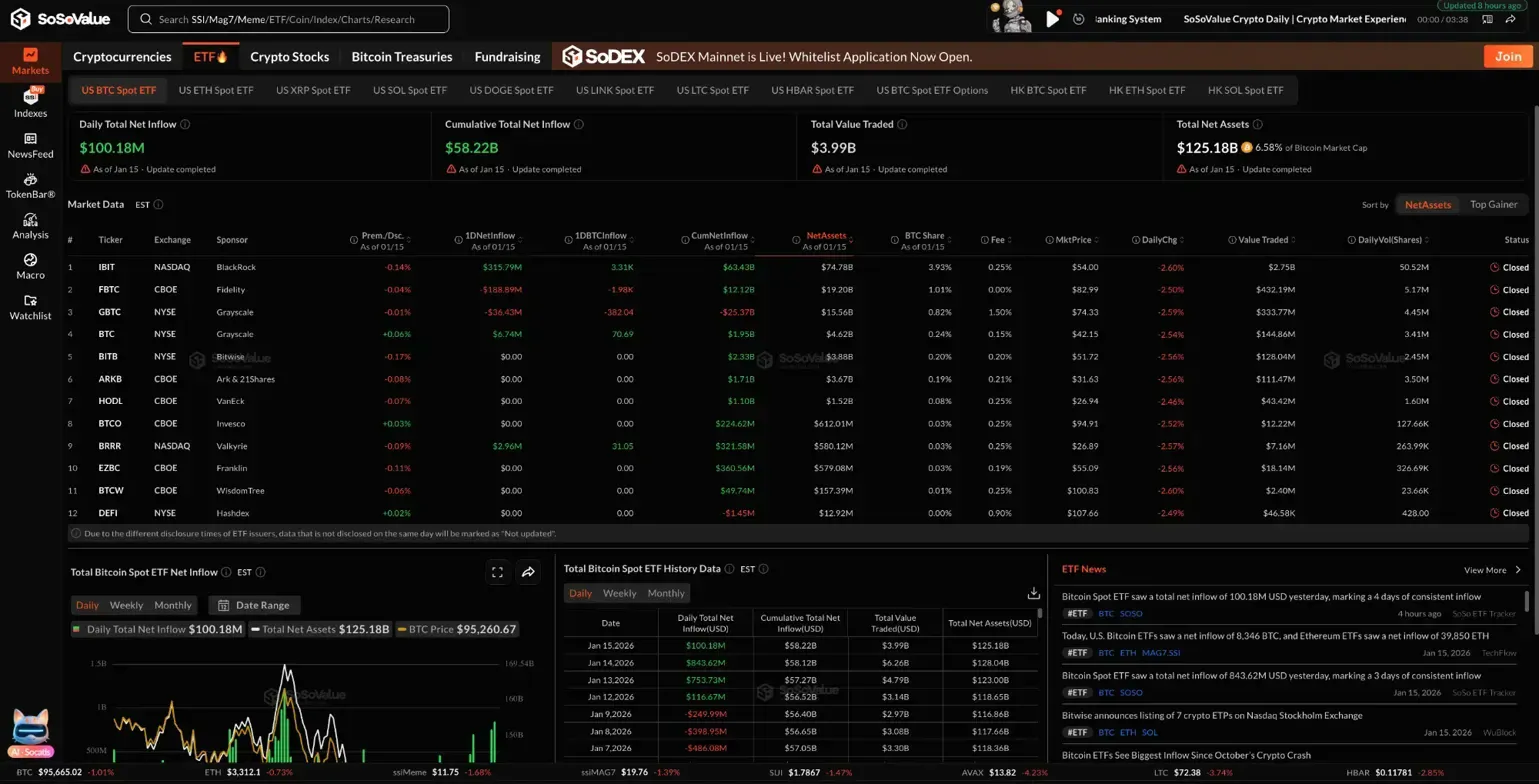
Institutional demand remains intact despite the choppy price action. According to SoSoValue, Bitcoin spot ETFs recorded $100.18 million in net inflows on January 15, extending the streak to four consecutive days of accumulation.
BlackRock’s IBIT led the session with $315.79 million in fresh capital. Fidelity’s FBTC followed with $188.89 million. Grayscale’s GBTC continued its bleed, shedding another $36.43 million as legacy holders rotate into lower-fee products.
Total ETF assets under management now sit at $125.19 billion. The cumulative net inflow since launch has reached $58.22 billion, reflecting sustained institutional conviction even as price consolidates below key resistance.
Spot Outflows Signal Distribution
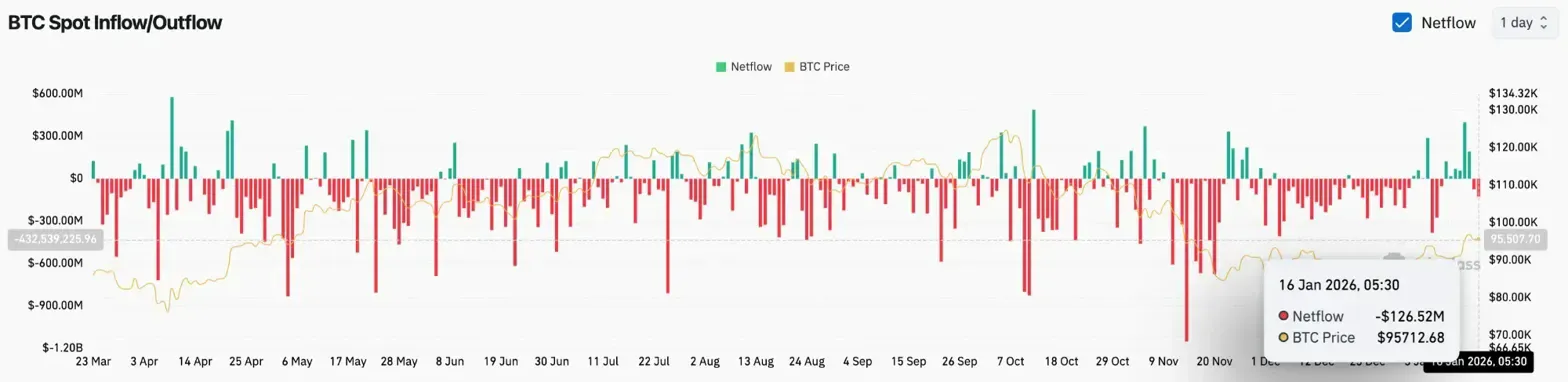
The spot market tells a different story. Coinglass data shows $126.52 million in net outflows from exchanges on January 16. Coins are moving back onto exchanges rather than into cold storage, a pattern typically associated with selling pressure.
Related: Shiba Inu Price Prediction: Burn Rate Collapses 87% As Only 550K SHIB…
This divergence matters. ETF buyers accumulate through regulated vehicles while spot holders distribute into that bid. The result is a market that absorbs selling without breaking down but lacks the momentum to push higher.
When flows conflict, price tends to range. That dynamic explains the tight consolidation between $94,000 and $98,000 over the past week.
Price Stalls Below The 100 Day EMA
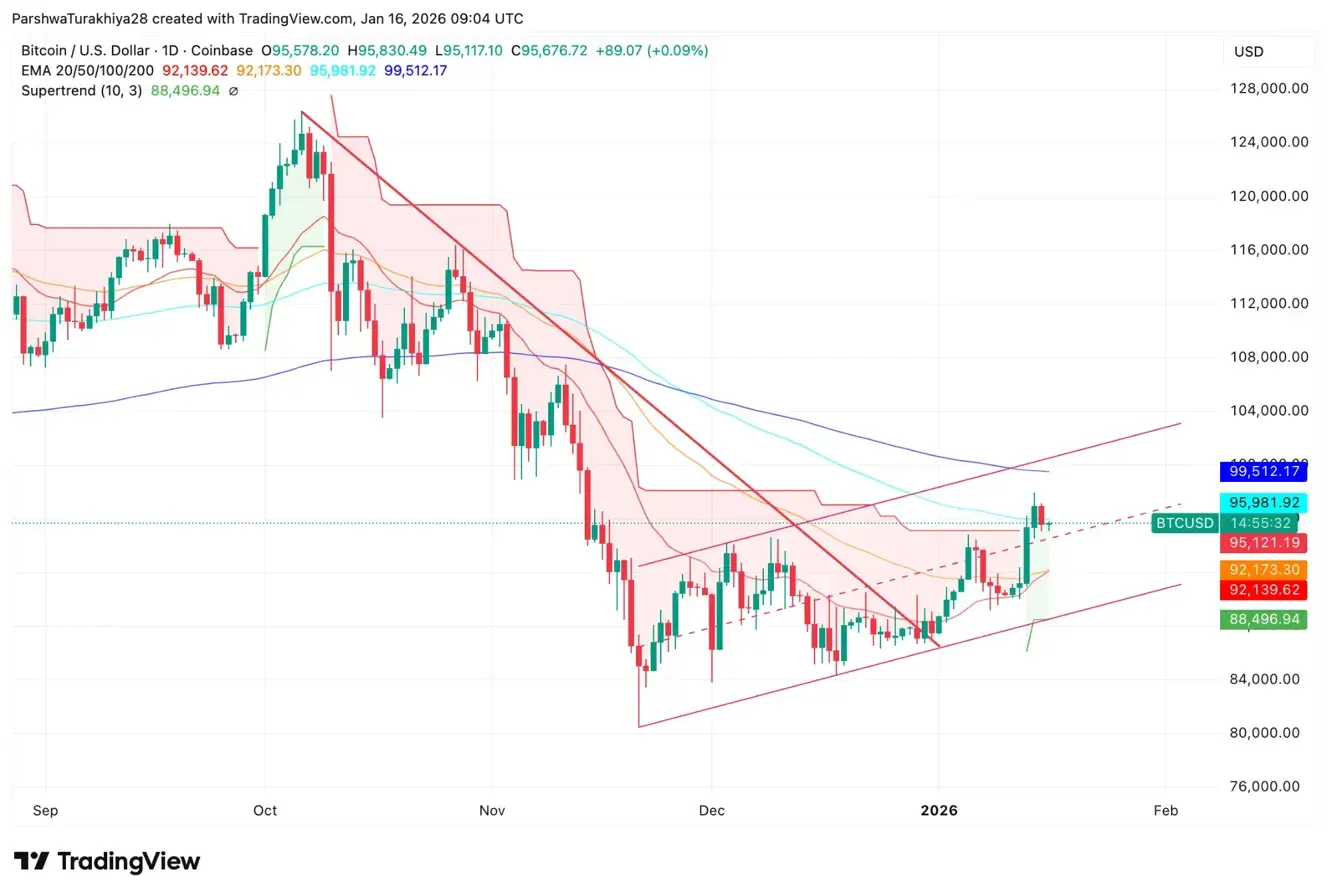
On the daily chart, Bitcoin remains trapped between the 50-day EMA at $92,173 and the 100-day EMA at $95,981. The 200-day EMA sits overhead at $99,512, marking the major resistance that bulls need to reclaim.
The recent structure shows a series of higher lows forming off the December bottom near $80,000. Price has recovered inside a rising channel but continues to face rejection at the upper boundary near $98,000.
Key levels now stand at:
- Immediate resistance: $95,981 (100 EMA)
- Major resistance: $99,512 (200 EMA)
- Near-term support: $92,139 to $92,173 (20/50 EMA cluster)
- Breakdown level: $88,496 (Supertrend)
The Supertrend indicator remains bullish on the daily timeframe, suggesting the broader recovery trend stays intact as long as price holds above $88,500.
Related: Dogecoin Price Prediction: DOGE Rebounds After Sharp Dip, but Resistance…
Hourly Chart Shows Consolidation Near Cloud Support
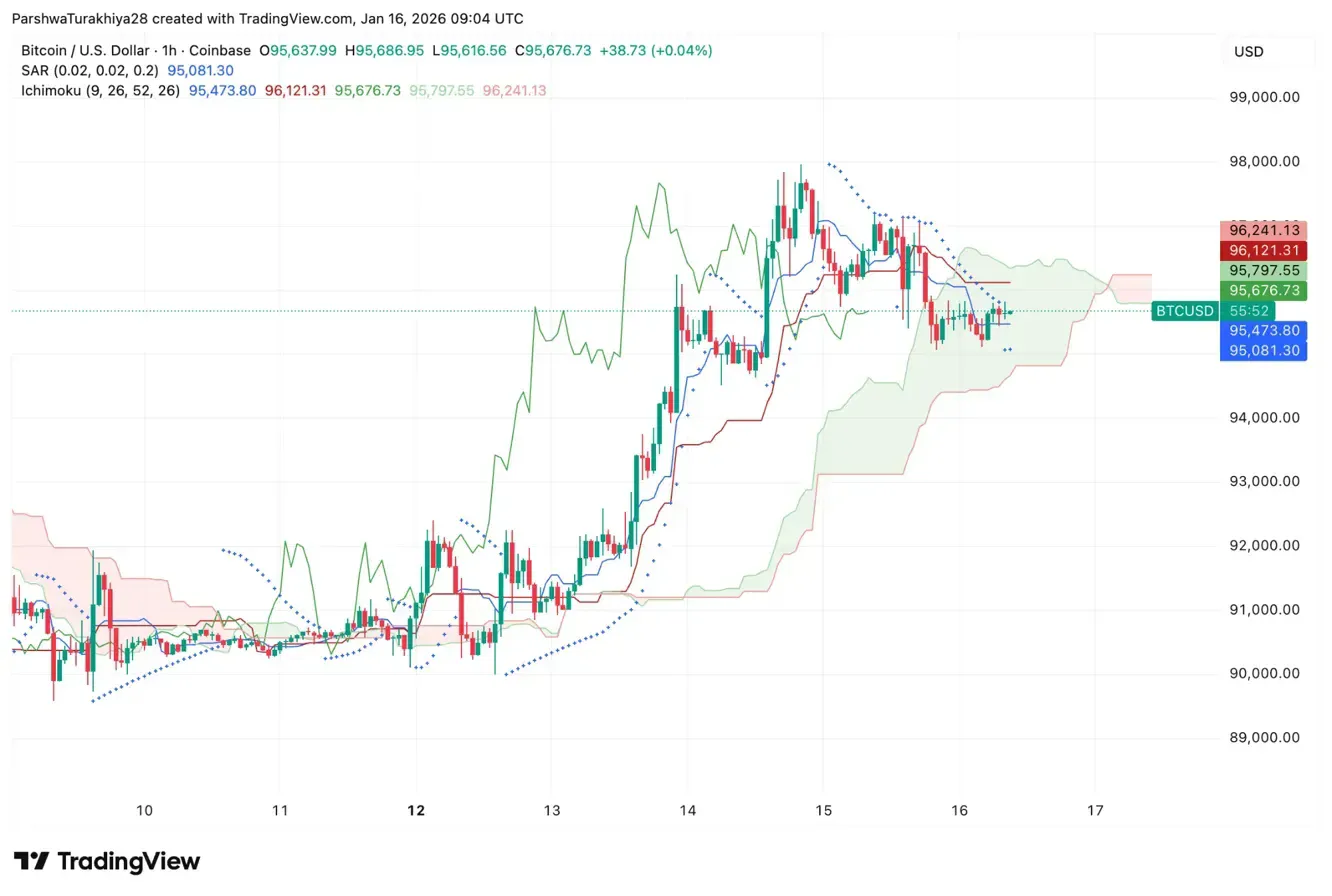
Shorter timeframes reveal a market searching for direction. On the hourly chart, Bitcoin trades inside the Ichimoku cloud, reflecting indecision between buyers and sellers.
The Parabolic SAR sits at $95,081, just below current price. A close beneath this level would flip short-term momentum bearish and open the door to a retest of $94,000.
Buyers have defended the $95,000 zone on multiple intraday tests. That level now acts as the line in the sand for short-term positioning.
Outlook: Will Bitcoin Break Higher?
The trend remains constructive but lacks confirmation. ETF flows support the bid, yet spot distribution caps upside momentum. Until one side overwhelms the other, range conditions persist.
- Bullish case: A daily close above $95,981 clears the 100 EMA and targets $99,500. Reclaiming the 200 EMA with volume confirms trend resumption toward $104,000.
- Bearish case: Losing $92,000 breaks the EMA cluster and exposes $88,500. A close below the Supertrend flips structure bearish and opens $85,000.
Bitcoin sits at an inflection point. The next sustained move depends on whether ETF accumulation can absorb spot selling pressure and drive price through overhead resistance.
Related: Internet Computer Prediction 2026: Mission70 Cuts Inflation 70% and AI Integration Target $8-$12
Disclaimer: The information presented in this article is for informational and educational purposes only. The article does not constitute financial advice or advice of any kind. Coin Edition is not responsible for any losses incurred as a result of the utilization of content, products, or services mentioned. Readers are advised to exercise caution before taking any action related to the company.

 Price Prediction: Can Bulls Sustain Above $2,100?")


