
- Bitcoin holds above $68,000 as Fidelity’s Jurrien Timmer calls $60K the four-year cycle bottom, predicting new highs after consolidation.
- Open interest rises 2.09% to $45.36B despite volume dropping 12.47%, showing traders rebuilding positions after recent volatility.
- Spot inflows of $12.90M on February 14 signal renewed demand as price attempts to stabilize in the $68,000-$70,000 range.
Bitcoin price today trades near $68,795, down slightly in the past 24 hours after testing the $69,400 resistance zone. The move comes as Fidelity’s director of global macro Jurrien Timmer called Bitcoin’s $60,000 low the cycle bottom, predicting a new bull market will begin after a consolidation period.
Fidelity’s Timmer Calls $60K The Cycle Bottom
Timmer wrote that Bitcoin’s drop to $60,000 last week fulfilled the support zone he predicted months ago when he identified the end of the four-year cycle bull market. “It’s anyone’s guess whether $60k is the low, but my guess is that it is, and that after a few months of backing and filling the next cyclical bull market will get underway,” Timmer stated on X.
He argued the decline to “only” $60,000 is relatively shallow for a Bitcoin winter, showing the asset is maturing. As Bitcoin becomes more institutionalized, volatility dampens and swings become less dramatic. In earlier analysis, Timmer noted the October high of $125,000 after 145 weeks of rallying “fits pretty well with what one might expect” based on past four-year cycles.
Timmer predicted subsequent bear markets tend to last about one year, making 2026 an “off year” with support in the $65,000-$75,000 range. Based on the mathematical harmony of past cycles, he believes future waves could eventually take Bitcoin to new highs after the current consolidation phase.
Open Interest Climbs As Spot Inflows Return
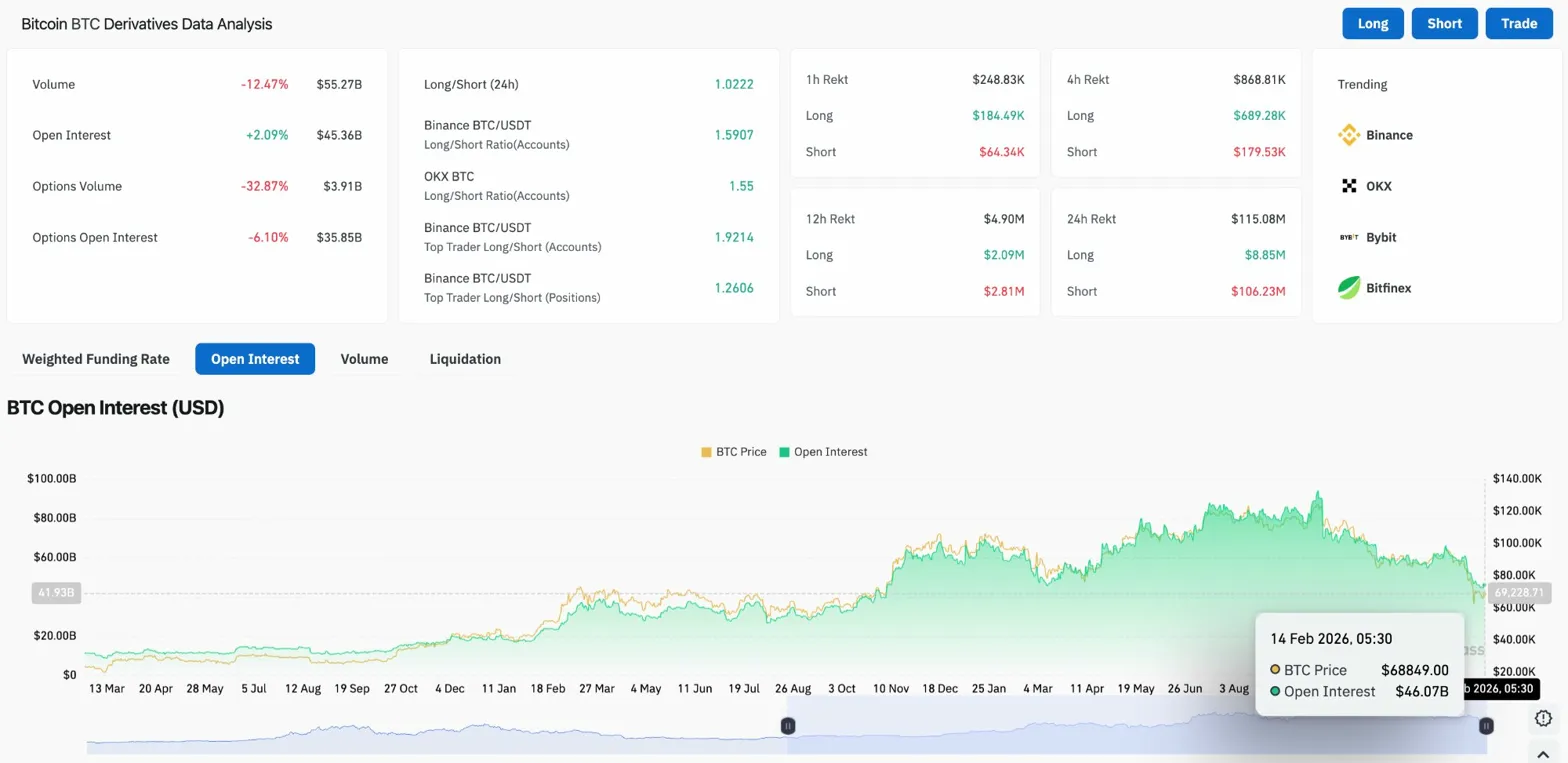
According to Coinglass, Bitcoin’s open interest increased 2.09% to $45.36 billion, suggesting traders are rebuilding positions after the February 5 liquidation event. Volume dropped 12.47% to $55.27 billion, indicating reduced participation but not panic selling. Spot flows show $12.90 million in net inflows on February 14, a reversal from the heavy outflows that pressured price earlier in the month.
Long/short ratios remain elevated at 1.59 on Binance and 1.55 on OKX, showing that leverage still skews bullish despite the 45% drawdown from October highs. Top trader positioning shows $184.69 million in longs versus $64.34 million in shorts on 1-hour timeframes, indicating large accounts are positioned for recovery.
The combination of rising open interest and spot inflows suggests the market is stabilizing after the sharp correction. When both metrics turn positive simultaneously, it typically indicates accumulation rather than distribution.
Price Consolidates Below All Major EMAs
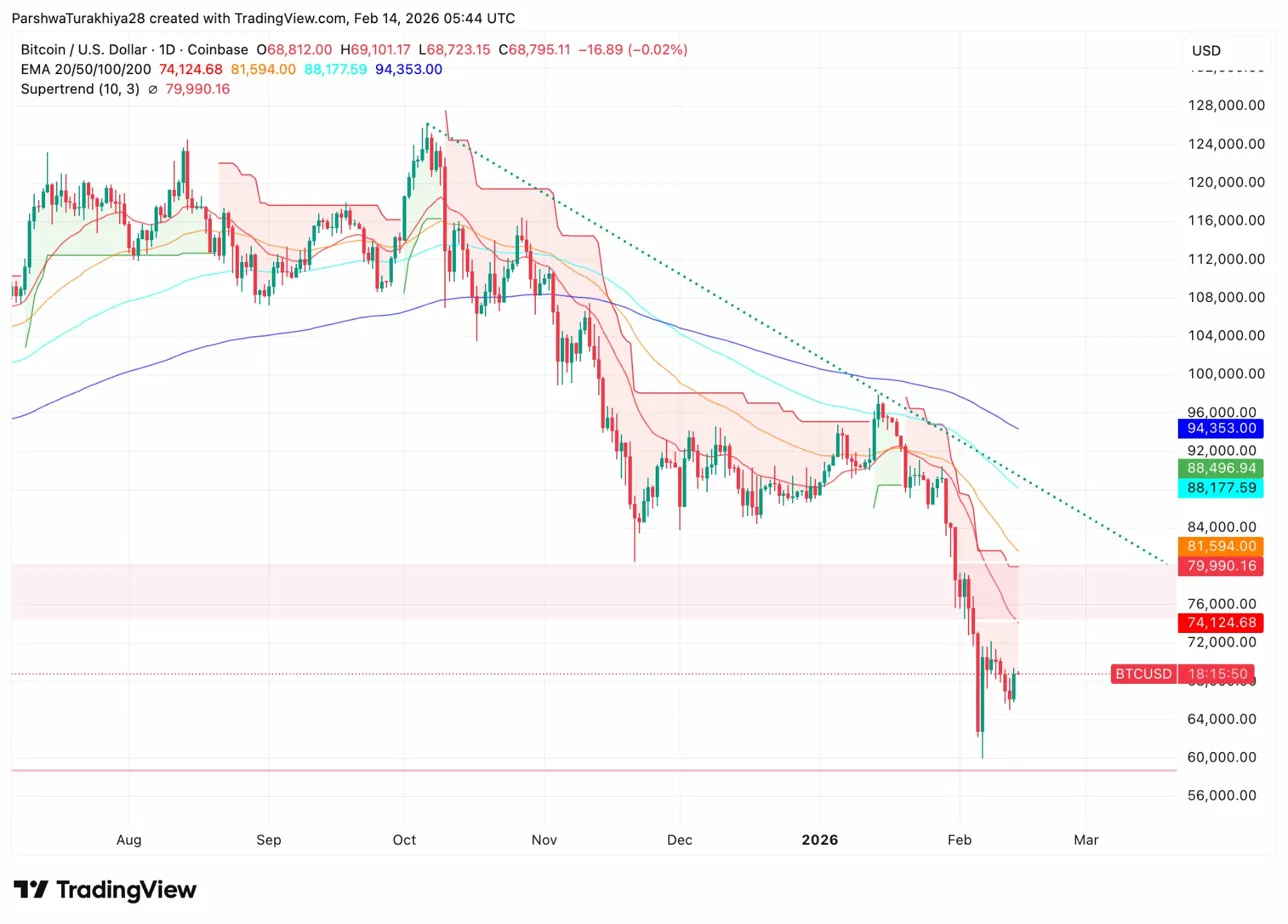
On the daily chart, Bitcoin continues to trade below all major moving averages. The 20-day EMA sits at $74,124, the 50-day at $81,594, the 100-day at $88,177, and the 200-day at $94,353. All four EMAs remain stacked downward, creating a clear resistance ceiling.
The chart shows:
- Supertrend bearish at $79,990, confirming downside trend
- Price consolidating in the $68,000-$70,000 range
- $74,124 resistance at 20-day EMA
- $60,000 support defended on February 5
Bitcoin tested Timmer’s predicted support zone at $60,000 and bounced sharply, gaining over 14% from those lows. The move confirms that demand exists at lower levels, validating the cycle bottom thesis. However, price remains firmly below the 20-day EMA, indicating the corrective phase is not yet complete.
A daily close above $74,124 would flip the 20-day EMA and signal the first sign of trend exhaustion. Until that happens, the structure remains bearish despite the stabilization. Timmer’s prediction of “a few months of backing and filling” aligns with the current price action, which shows consolidation rather than impulsive moves in either direction.
Hourly Chart Shows Range-Bound Trading
The 1-hour chart reveals Bitcoin trapped in a tight range between $68,000 and $70,000. Parabolic SAR sits at $69,395, acting as immediate resistance. RSI holds at 61.53, neutral and showing no clear directional bias as price oscillates within the consolidation zone.
The structure shows:
- Price forming higher lows from the $66,000 base
- Resistance at $69,395 capping upside attempts
- Range compression indicating consolidation
Buyers are defending the $68,000 level, creating a base after the sharp recovery from $60,000. Sellers continue to reject price above $69,400, preventing a breakout toward $70,000. The tight range reflects Timmer’s “backing and filling” prediction, with neither buyers nor sellers able to establish control.
A breakout above $69,395 would flip the SAR and place $70,000 back in range. A breakdown below $68,000 would retest $66,000 support and potentially challenge the $65,000 lower bound of Timmer’s predicted consolidation zone.
Outlook: Will Bitcoin Go Up?
The next move depends on whether Bitcoin can hold $68,000 and break above the 20-day EMA at $74,124.
- Bullish case: A close above $74,124 with sustained volume and continued spot inflows would flip the 20-day EMA and place $81,594 back in range. That would validate Timmer’s cycle bottom call and signal the start of the next accumulation phase.
- Bearish case: A breakdown below $68,000 retests $66,000, with further downside toward $60,000 if selling pressure returns. Losing $60,000 would invalidate Timmer’s cycle bottom thesis.
Disclaimer: The information presented in this article is for informational and educational purposes only. The article does not constitute financial advice or advice of any kind. Coin Edition is not responsible for any losses incurred as a result of the utilization of content, products, or services mentioned. Readers are advised to exercise caution before taking any action related to the company.
 Price Prediction: Canton Eyes Key Break After Market Activity Spike")


