- Bitcoin price today hovers near $91,450 after losing its multi-month trendline and slipping toward the $90,500 support zone.
- Daily EMAs have fully flipped bearish as persistent spot outflows hit $125.46 million on November 19.
- Bitwise CIO Matt Hougan says the “bottom is in,” but price action shows no confirmation as sellers eye $88,000 next.
Bitcoin price today trades near $91,450 after failing to defend the multi-month trendline that supported every rally since early 2024. The breakdown has shifted short-term momentum firmly toward sellers as spot outflows accelerate and daily EMAs flip into overhead resistance.
Weekly Trendline Break Signals Deeper Pressure

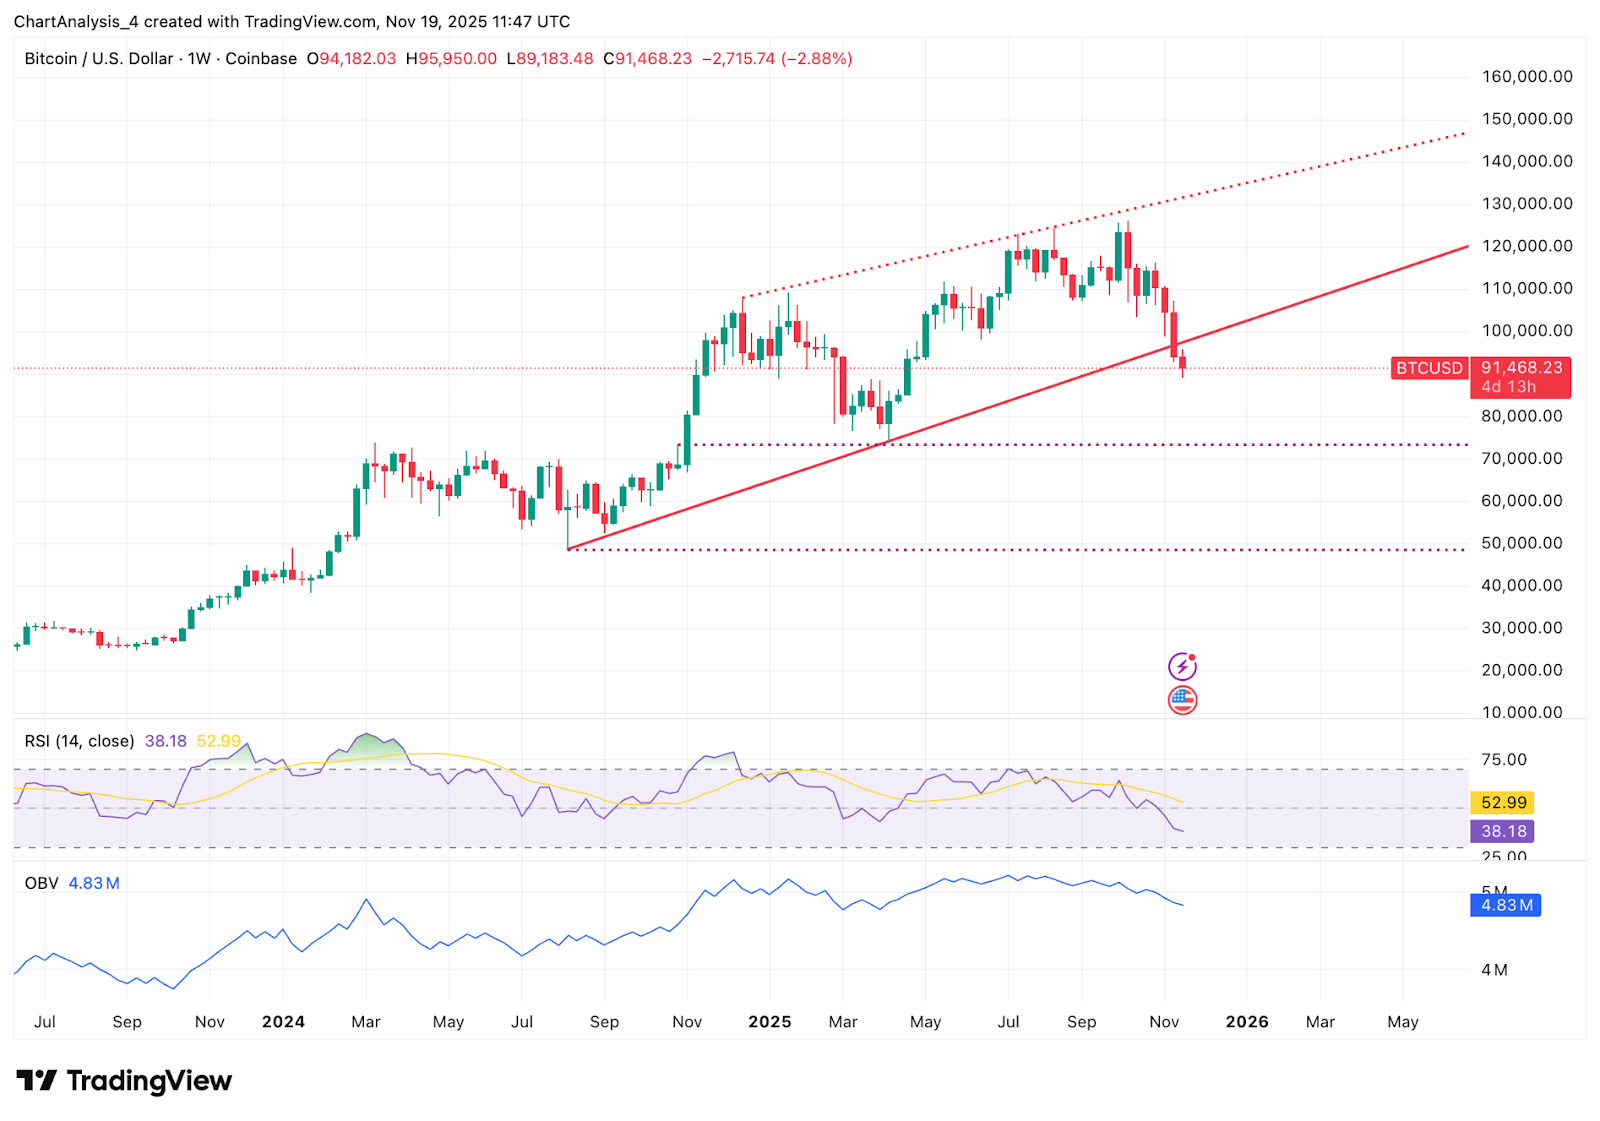
The weekly chart shows Bitcoin snapping the long-term ascending trendline that has held for more than a year. The candle closed decisively below this line, which previously acted as the backbone of the advance from $60,000 to $130,000. Momentum weakened after the $130,000 double-top in August, and price has now rolled over toward the midpoint of the broader rising wedge.
RSI on the weekly chart sits near 38, a level not seen since the mid-2023 retracement. This reflects a clear shift into a corrective phase. OBV has also started to roll over, indicating that volume participation has thinned during the decline rather than backing a reversal.
Related: Cardano Price Prediction: ADA Extends Its Downtrend as Exchange Outflows Build
The next major levels on the weekly timeframe sit at $88,000, followed by the deeper liquidity zone between $80,000 and $76,500. These regions align with former breakout supports from 2024 and represent the most important structural floors for buyers.
Daily EMAs Flip Bearish As Selling Extends

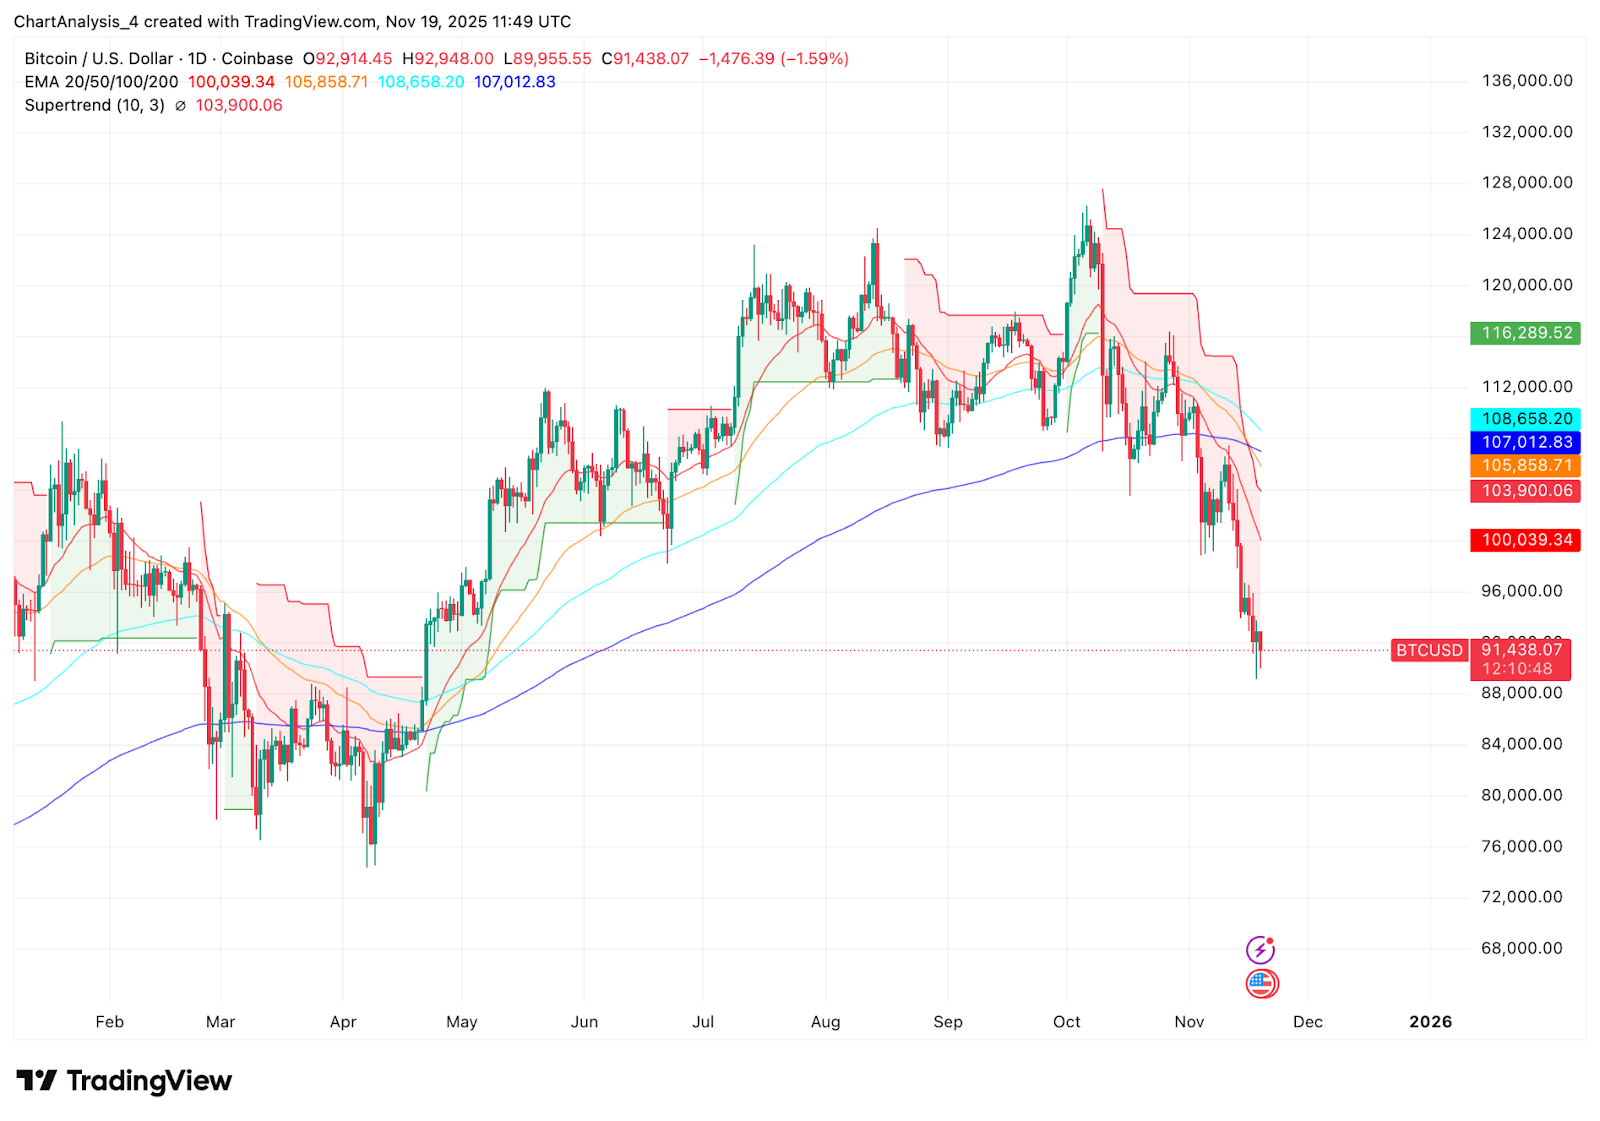
The daily chart reinforces the pressure. Bitcoin trades below the full EMA stack at $100,039, $105,858, $108,658, and $107,012. Each EMA has now turned downward, forming a bearish cluster that has rejected every recovery attempt since early November.
The Supertrend indicator flipped red at $103,900 and remains firmly bearish. Every rebound attempt toward $95,000 to $98,000 has faded quickly, showing how aggressively sellers are leaning on rallies.
The break below $92,000 changed the character of the market. Price is now testing the minor support at $90,500 and shows risk of extending toward $88,000 if flows do not improve. There is no trend reversal signal on the daily chart until Bitcoin reclaims at least the 20 EMA at $100,039.
Spot Outflows Intensify As Traders Pull Capital

Coinglass data shows another $125.46 million in net outflows on November 19. The pattern has been consistent for weeks. Red prints dominate the chart, with almost no sustained periods of inflows throughout October and November.
Related: XRP Price Prediction: ETF Hype Fades As Sellers Drive Price Toward Channel Support
The outflow structure mirrors the weakness seen during the mid-2021 and mid-2022 corrections, where persistent red bars foreshadowed deeper price retracements. Market participants continue to remove liquidity from exchanges instead of accumulating dips.
Sentiment Attempts To Stabilize As Institutions Speak Up
A notable development came from Bitwise CIO Matt Hougan, who stated live on CNBC that “the bottom is in” and described current valuations as a “generational opportunity.” Such comments often influence short-term sentiment, especially when the market is near key technical levels.
However, price action still reflects caution. The market has not responded to the CIO’s statement with any sustained buying, and the intraday structure remains heavy.
Related: Ethereum Price Prediction: ETH Faces Pressure as Outflows Rise and Channel Downtrend Deepens
If institutions begin positioning more visibly ahead of year-end, sentiment could stabilize. At the moment, the narrative is outpacing the flows.
Outlook. Will Bitcoin Go Up?
Bitcoin is testing major support after breaking its key trendline. The next move depends on whether price can hold $88,000 and whether flows begin to improve.
- Bullish case. A close back above $100,000 is required to regain momentum. Breaking $103,900 would flip Supertrend and allow Bitcoin to challenge $108,658 and then $112,000. Without a reclaim of the EMA cluster, upside remains capped.
- Bearish case. A daily close below $90,500 exposes $88,000. Losing $88,000 turns the decline into a broader correction toward $80,000 to $76,500, where the next major liquidity zones sit.
Disclaimer: The information presented in this article is for informational and educational purposes only. The article does not constitute financial advice or advice of any kind. Coin Edition is not responsible for any losses incurred as a result of the utilization of content, products, or services mentioned. Readers are advised to exercise caution before taking any action related to the company.


