
- Bitcoin fails to break $95,000 as price compresses inside a wedge, with sellers maintaining control at major resistance.
- Spot and ETF flows remain negative, with over $170M in recent outflows signaling weak demand and cautious positioning.
- Futures open interest and volume decline, showing lower conviction and reducing the probability of a sustainable breakout.
Bitcoin price today trades around $92,930 after failing to break above $95,000, a level that sellers have defended for nearly two weeks. The rejection keeps short term pressure on buyers, with price now moving inside a tightening wedge that usually leads to a sharp breakout. The market is waiting for a clear signal, but current flows and positioning still lean cautious.
Spot Outflows Keep Pressure On Price
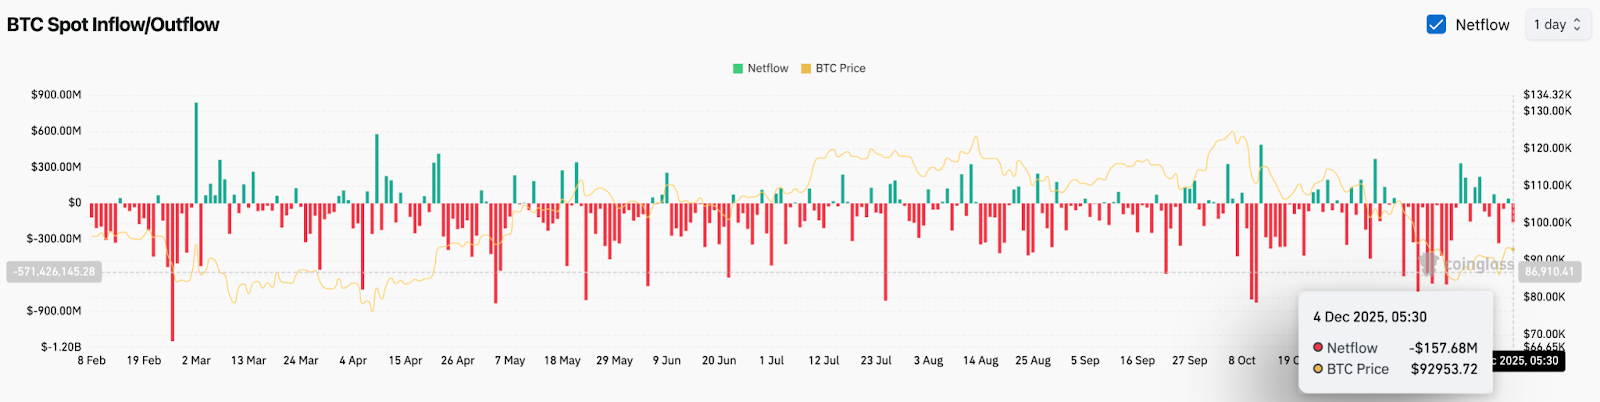
Spot data shows that investors are still taking money out of the market rather than adding to positions. Coinglass recorded about $157 million in net outflows on December 4. Continuous negative flows suggest traders are sending Bitcoin back to exchanges to sell or de-risk, not hold for upside.
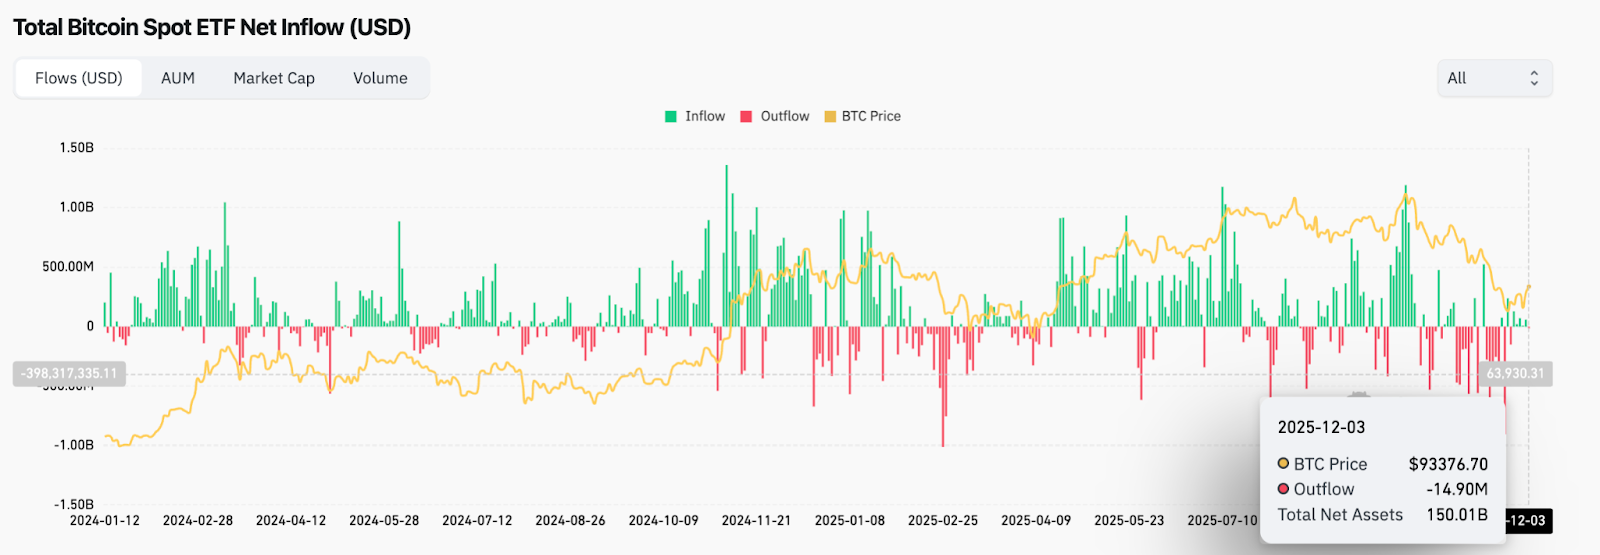
ETF flows offer the same message. Bitcoin spot ETFs saw a small net outflow of about $15 million on December 3. The number is not huge, but it continues a pattern of fading demand rather than aggressive accumulation.
When both spot flows and ETF flows turn soft at the same time, Bitcoin usually struggles to build momentum. That is what the chart looks like now. Short term rallies start strong, but they fade quickly because fresh capital is not entering the market.
Futures Market Shows Lower Confidence
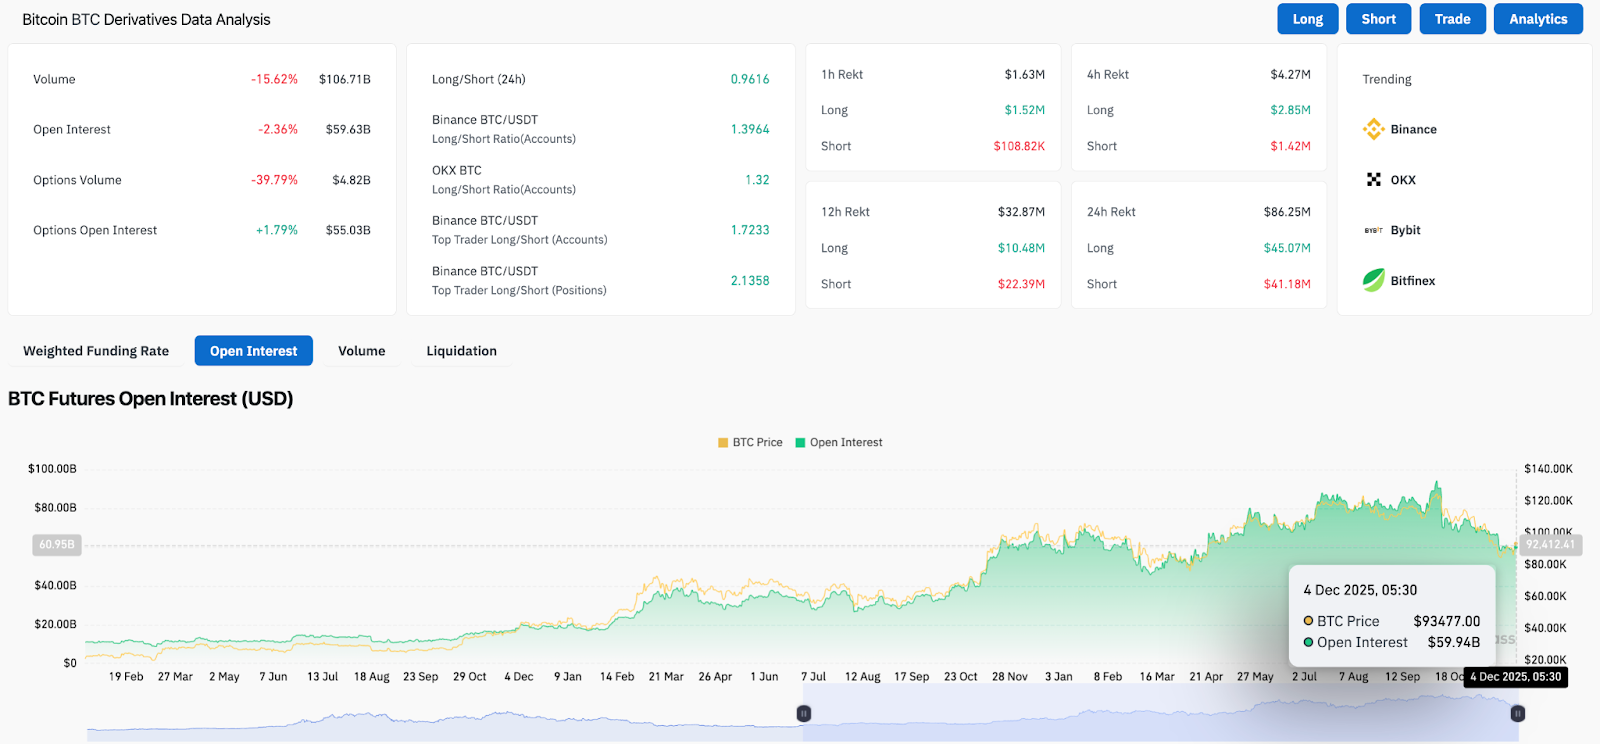
Derivatives positioning also shows a drop in confidence. Open interest fell more than 2 percent to around $59.6 billion, which means traders are closing positions rather than building new ones.
Volume also declined. It is not panic selling, but the data shows a lack of conviction from both sides. Long short ratios are slightly bullish across major exchanges, yet traders are using less leverage. That is normally a sign of waiting, not betting.
If Bitcoin breaks out of the wedge with rising open interest and volume, the move has a higher chance of continuation. A breakout without leverage support is often a fake move that reverses quickly.
Price Stalled Under Heavy Resistance
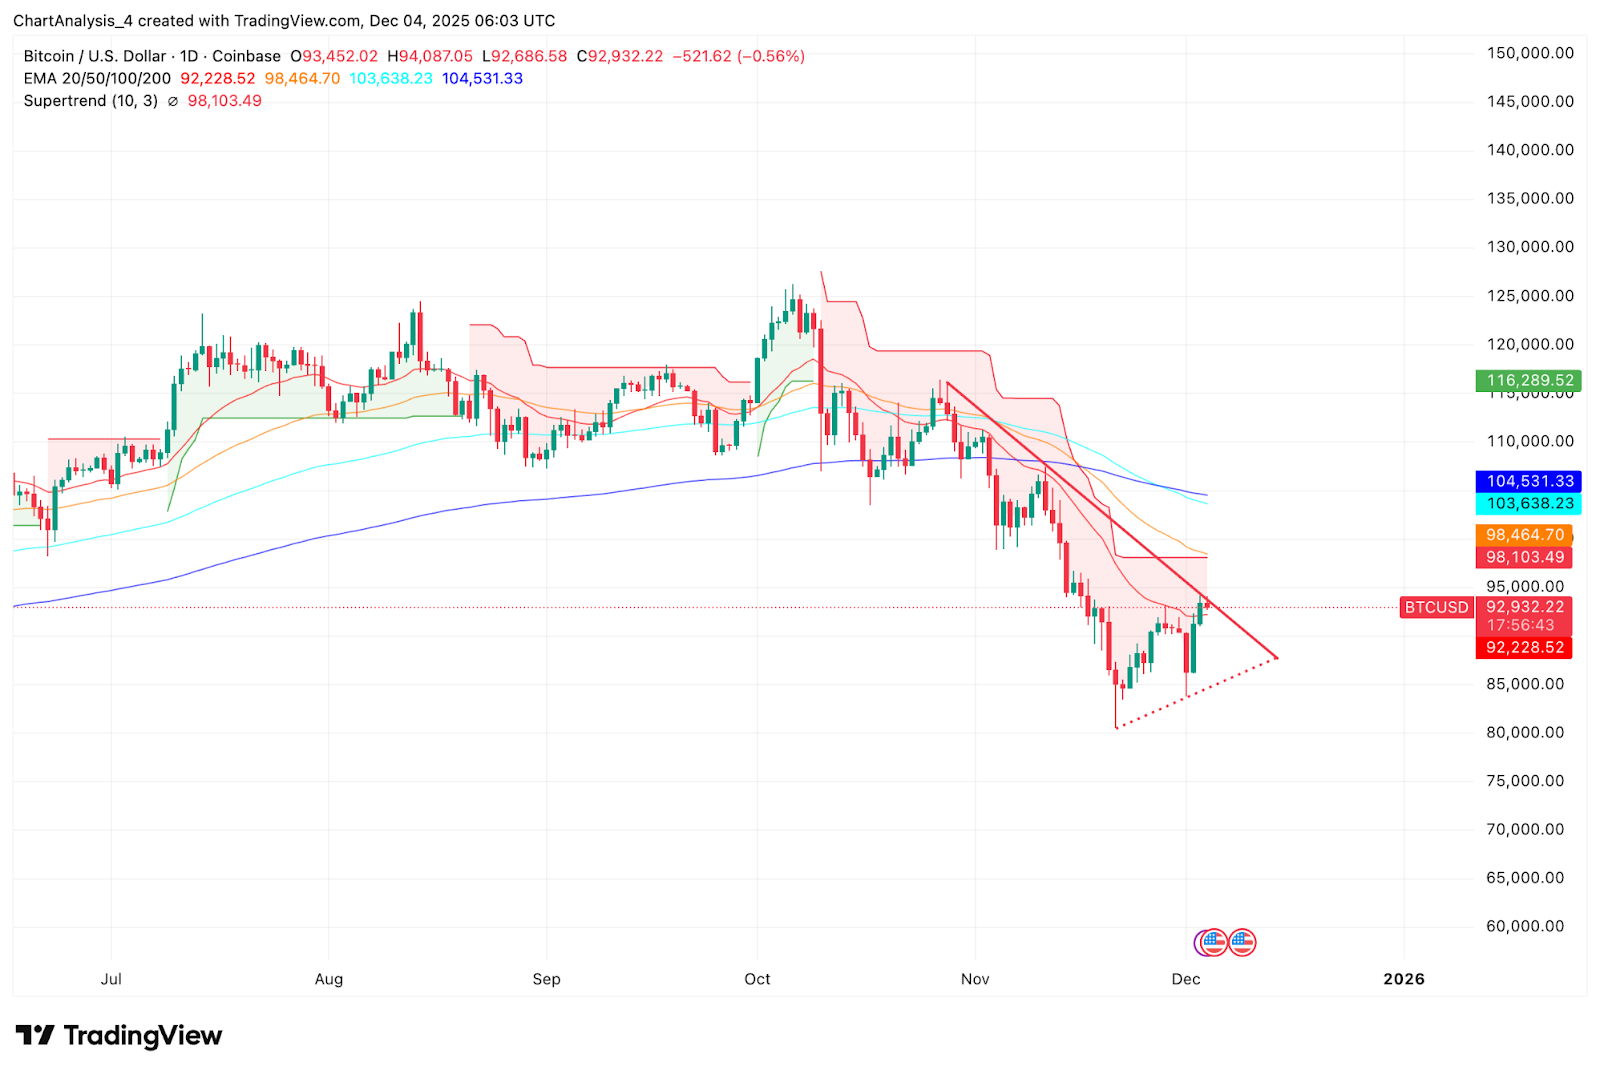
The market structure on the daily chart is still bearish. Bitcoin sits under the 20, 50, 100, and 200 day EMAs. When all major moving averages sit above price, they act like layers of resistance instead of support.
Important levels now:
- First resistance: $95,000
- 50 day EMA: $98,464
- 100 day EMA: $103,638
- 200 day EMA: $104,531
The supertrend indicator remains red and sits above price near $98,000. A close above that level would be the first sign of momentum shifting.
Support sits near $90,000 to $88,000, a zone that held during the last downturn. If this support fails, price likely visits the low $80,000s.
Outlook. Will Bitcoin Go Up?
Bitcoin is trapped between heavy resistance and important support, with flows and leverage showing hesitation.
- Bullish case: A breakout above $95,000, then $98,500, could build momentum toward $103,500 and $104,500. That would force shorts to cover and reset the trend.
- Bearish case: A close below $90,000 would expose $88,000, with risk of a slide toward $85,000 if selling pressure increases.
The next move depends on whether buyers or sellers break first. Right now, sellers still have the upper hand, and buyers need a clear breakout to shift control.
Related: BOB (Build on Bitcoin) Price Prediction 2025, 2026, 2027-2030
Disclaimer: The information presented in this article is for informational and educational purposes only. The article does not constitute financial advice or advice of any kind. Coin Edition is not responsible for any losses incurred as a result of the utilization of content, products, or services mentioned. Readers are advised to exercise caution before taking any action related to the company.


