
- Bitcoin surges to $65K, driven by U.S. and China interest rate cuts boosting investments.
- Analysts predict potential volatility, with targets ranging from $57K to $78K short-term.
- Technical indicators like MACD and RSI confirm strong bullish momentum for Bitcoin’s price.
Bitcoin’s price hit $65K, its highest point since August, and the latest price actions suggest a possible rally to $74K in coming weeks. Several key macroeconomic factors are at play in driving Bitcoin’s price rise, with a major contributor being the U.S. Federal Reserve’s interest rate cut.
This has renewed hope in the market, as investors started shifting their focus to risk assets, including Bitcoin. Lower interest rates of course make borrowing cheaper, which encourages investments in crypto assets that do well in flexible financial environments.
The People’s Bank of China (PBoC) also helped boost bullish sentiment by introducing interest rate cuts and easing policies to restore its economy. These global central bank moves have reignited interest in Bitcoin, with market participants speculating on even higher price targets.
$74K in the Coming Weeks?
Analysts such as Ali Charts have provided patterns that show Bitcoin may fluctuate before resuming its upward trend. He also suggests the projected Bitcoin market price could be as low as $60k, rise to $66k, drop to $57k, and then rally to $78k. While such volatility might concern investors, the general trend is up.
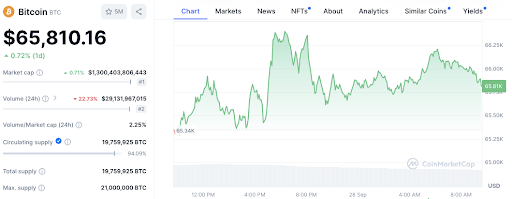
Bitcoin’s price increase in the last 24 hours also indicates stable market conditions. On September 28, Bitcoin’s price was $65,810, up by 0.72% from yesterday. Bitcoin has a total market capitalization of $1.3 trillion and a daily trading volume of $29.62 billion.
Read also: Fed Interest Rate Hike Confirmed: Will BTC Bounce Back?
Technically, certain signs, such as the Moving Average Convergence Divergence (MACD) and relative Strength Index (RSI), point to an evident bullish trend. The MACD line is upward, crossing above the orange line, and the histogram bars are green.
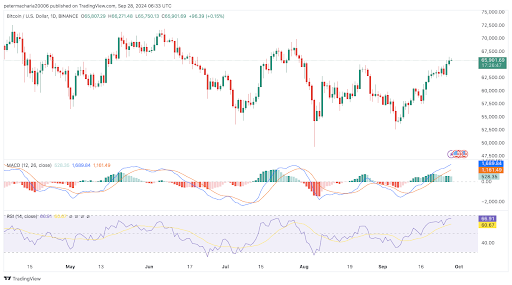
The RSI currently at 66.91 is approaching overbought levels but still suggest that Bitcoin could have room to run before facing any significant pullback.
Disclaimer: The information presented in this article is for informational and educational purposes only. The article does not constitute financial advice or advice of any kind. Coin Edition is not responsible for any losses incurred as a result of the utilization of content, products, or services mentioned. Readers are advised to exercise caution before taking any action related to the company.


