
The Bitcoin price today is trading near $118,400 after failing to hold above the $120,000 breakout level. While momentum from early July’s rally pushed BTC toward fresh 2025 highs, recent candles show signs of exhaustion below the upper boundary of a key ascending triangle. This structural slowdown is accompanied by mixed derivatives signals and fading dominance, suggesting bulls are facing increasing resistance.
What’s Happening With Bitcoin’s Price?
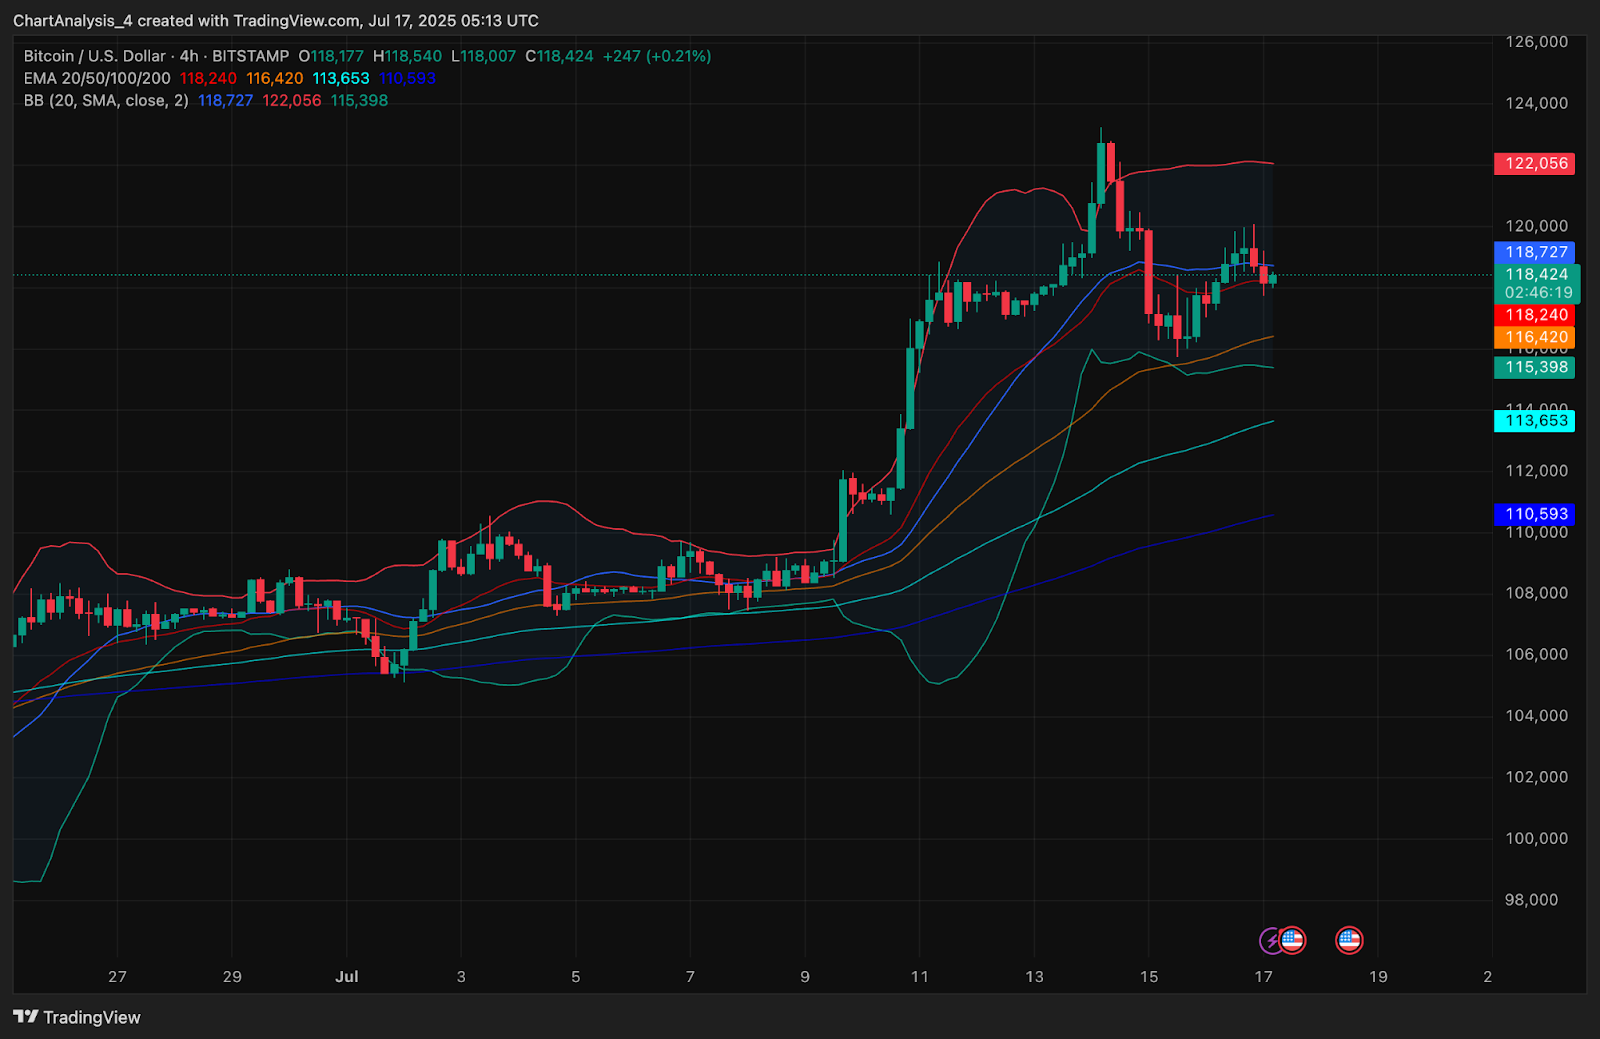
On the 4-hour chart, Bitcoin price action remains above the 20/50/100/200 EMA cluster, which now aligns between $116,420 and $113,653, suggesting buyers still have medium-term control. However, price is struggling to close above the Bollinger Band mid-line at $118,727, while the upper band near $122,056 continues to reject further upside. Recent candlesticks display lower wicks and reduced body size, a sign of buyer hesitation near key resistance.
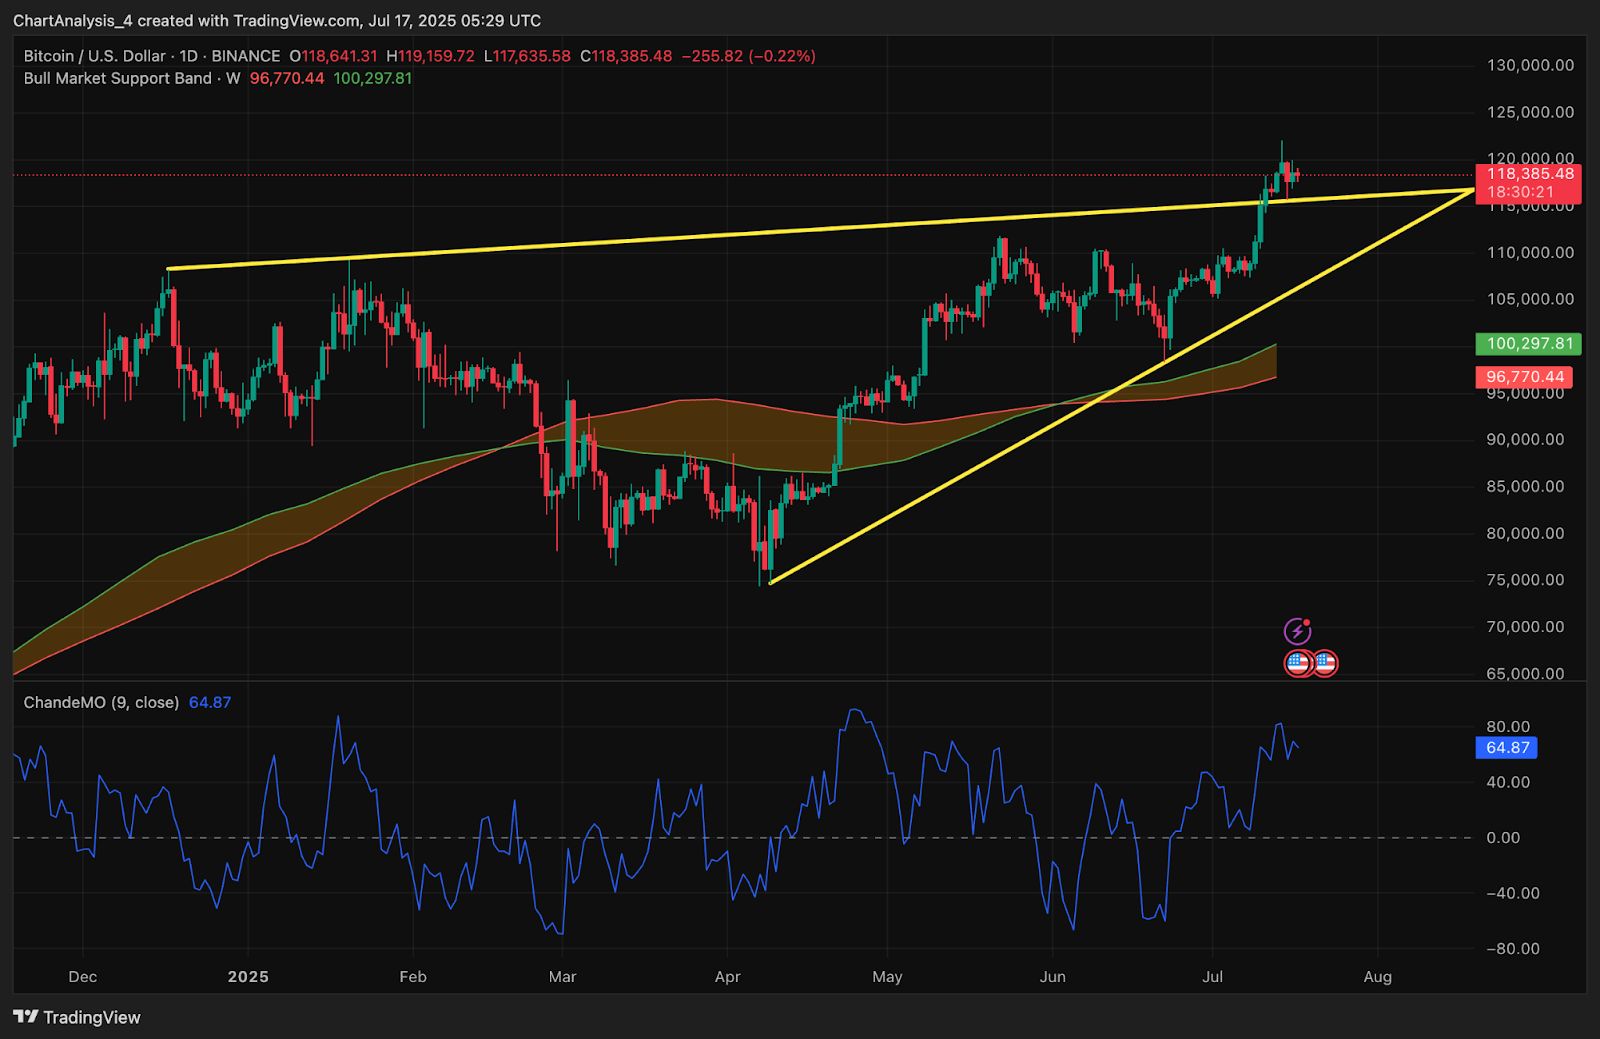
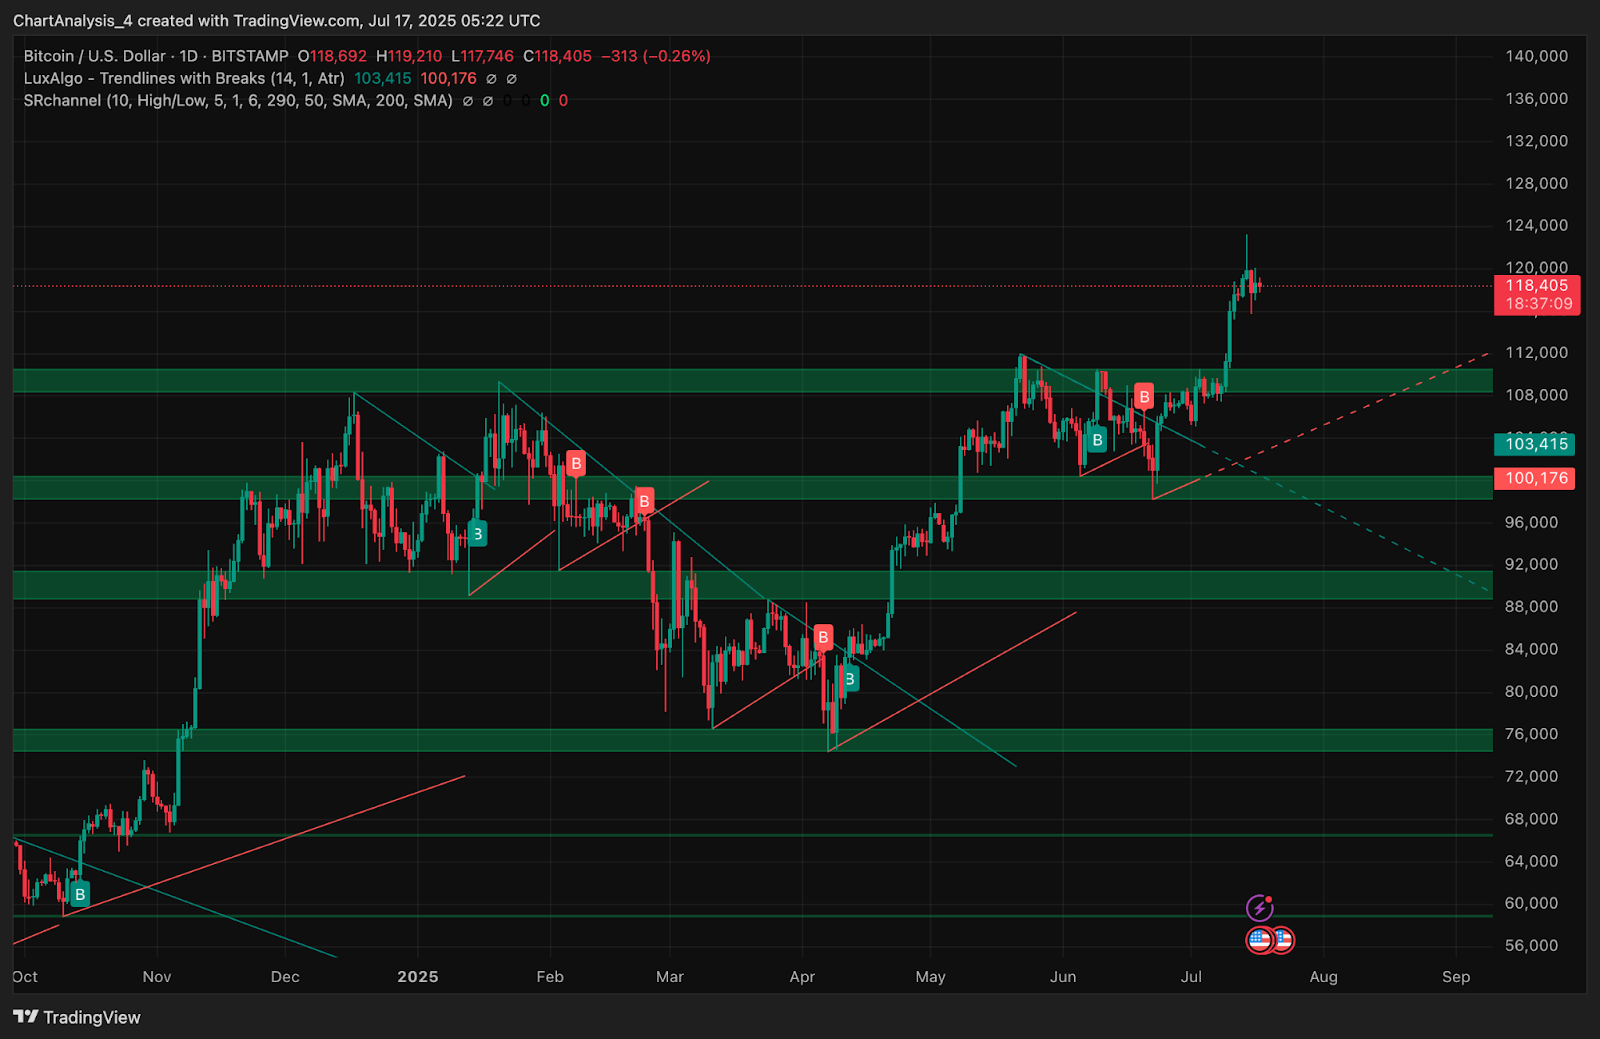
On the daily chart, BTC recently broke out from a long-term ascending triangle but is now stalling near the horizontal resistance at $120,000. This zone, previously untapped since December 2024, has triggered consolidation despite the clean trendline break. The apex compression pattern typically results in aggressive breakouts, but Bitcoin’s failure to extend beyond $120K weakens bullish momentum.
The Chande Momentum Oscillator shows values above 64.8 but has started to curve slightly downward, often an early warning of fatigue in strong trends. With price compressing between the Bull Market Support Band (now at $100,297) and rising wedge resistance, traders are watching closely for resolution.
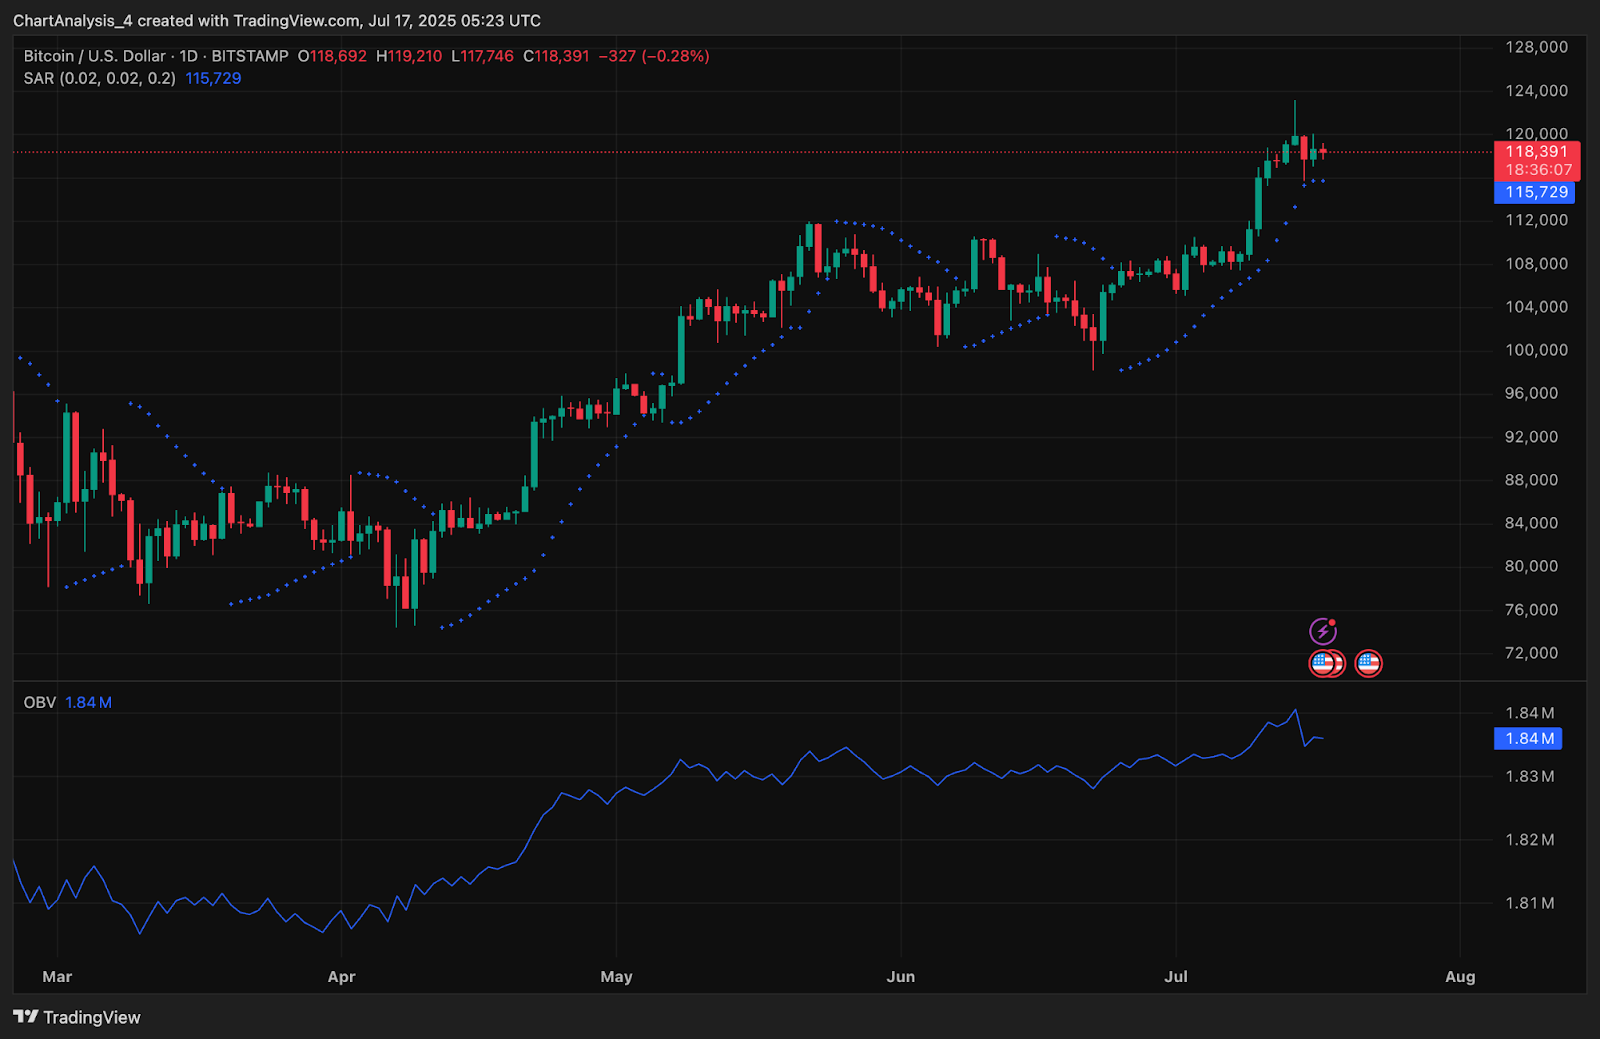
Meanwhile, the Parabolic SAR remains below the price, suggesting trend continuation. But the On-Balance Volume (OBV) indicator has flattened at 1.84M, reflecting stagnating inflow.
Why Is The Bitcoin Price Going Down Today?
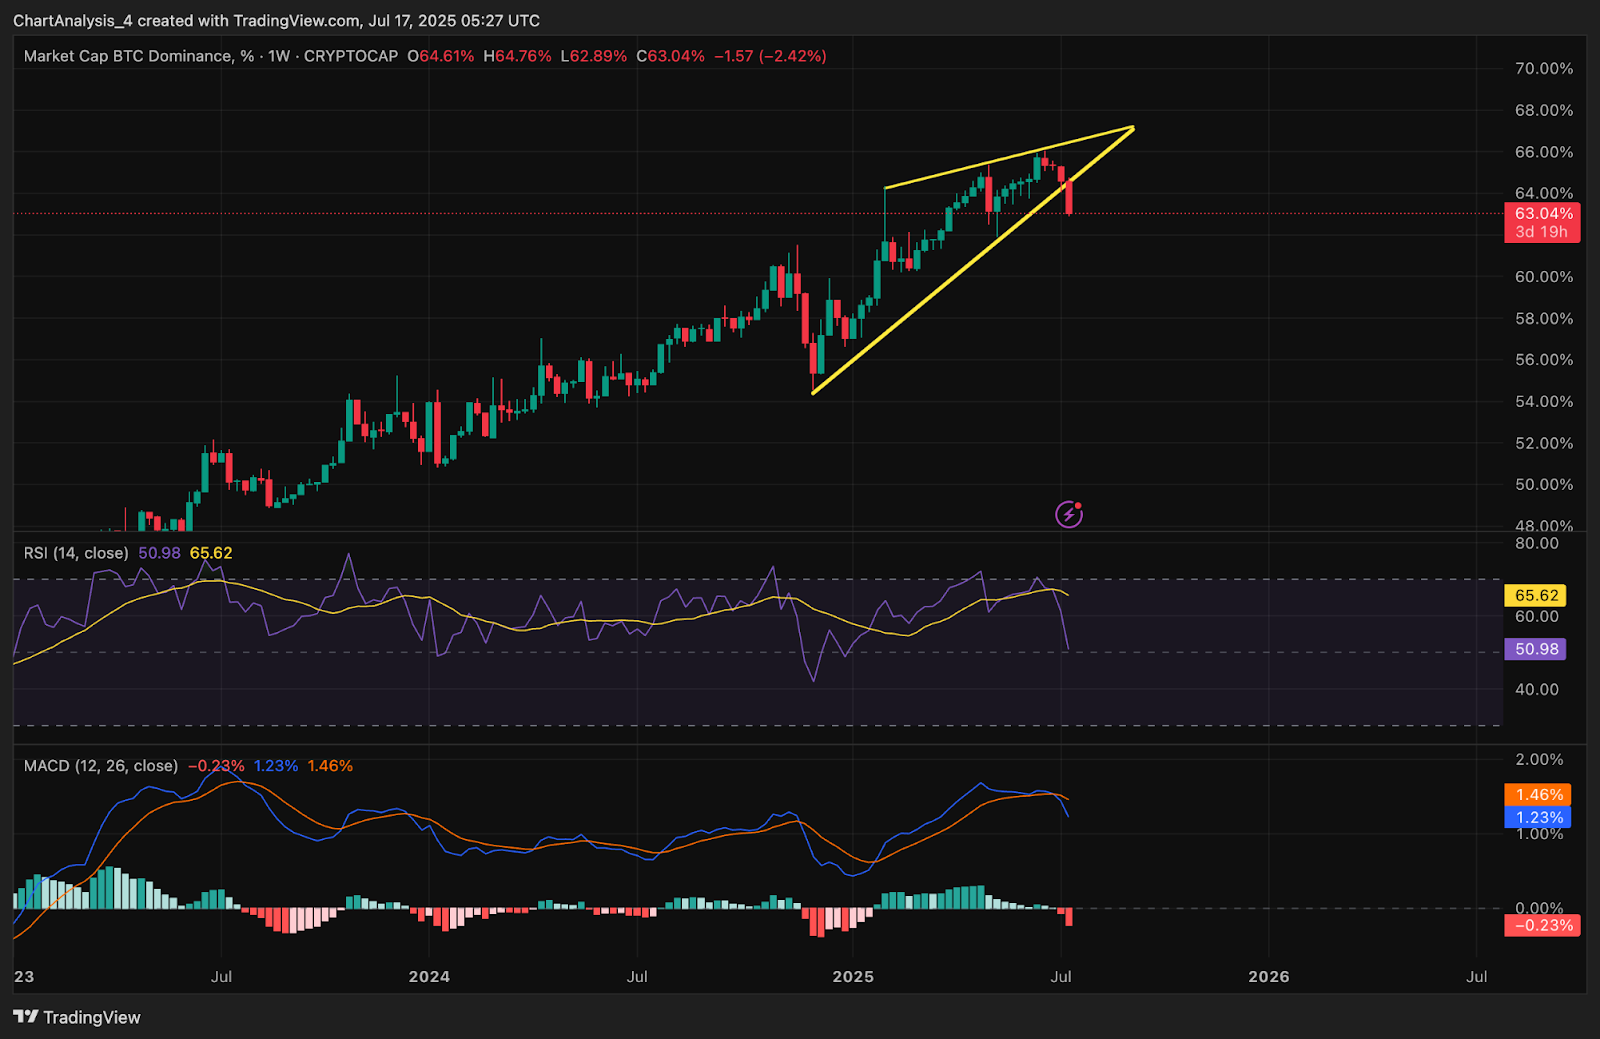
Why Bitcoin price going down today stems largely from fading momentum across multiple indicators and weakening BTC dominance. The weekly BTC dominance chart confirms a breakdown from a rising wedge, with RSI falling sharply to 50.98. MACD also confirms bearish crossover territory, suggesting a potential risk-off rotation away from BTC and into altcoins.
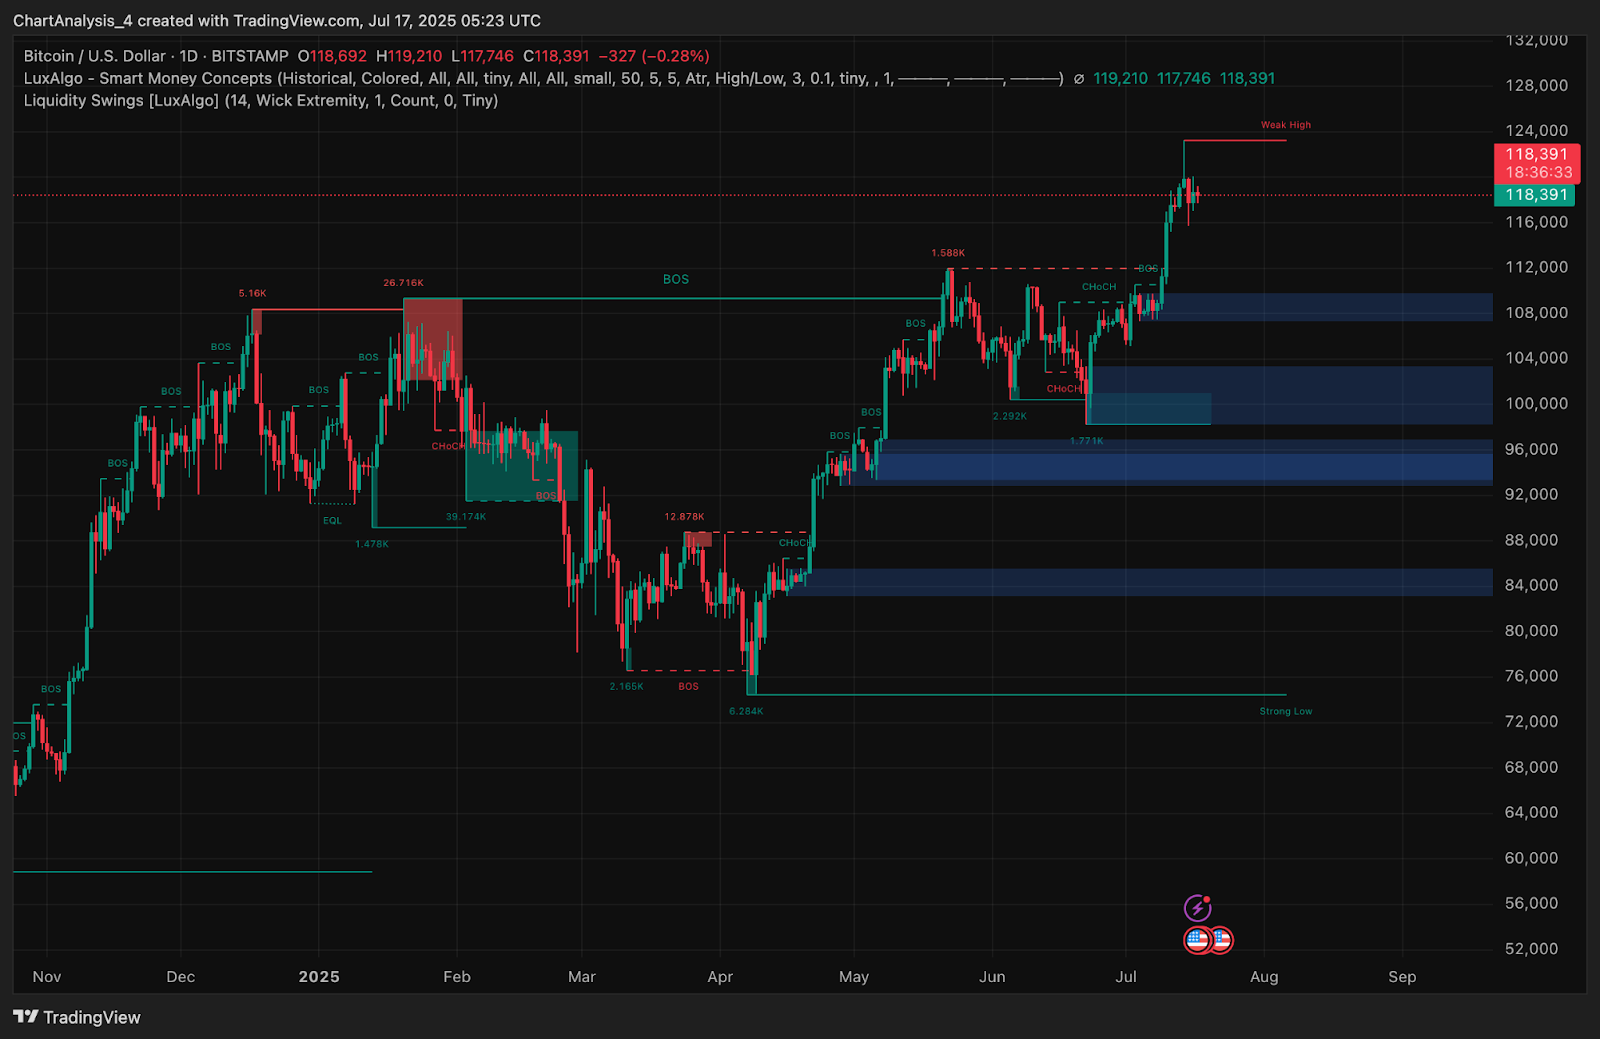
On the Smart Money Concepts (SMC) chart, a recent Break of Structure (BOS) was followed by a sweep of the $119.2K weak high. Price has since failed to hold above the liquidity zone and is consolidating just below, hinting that the latest high could be a trap for late longs. Key liquidity pools around $108K and $100K remain unmitigated, reinforcing downside risk if BTC loses its current structure.
Indicators and Derivatives Suggest Volatility Incoming
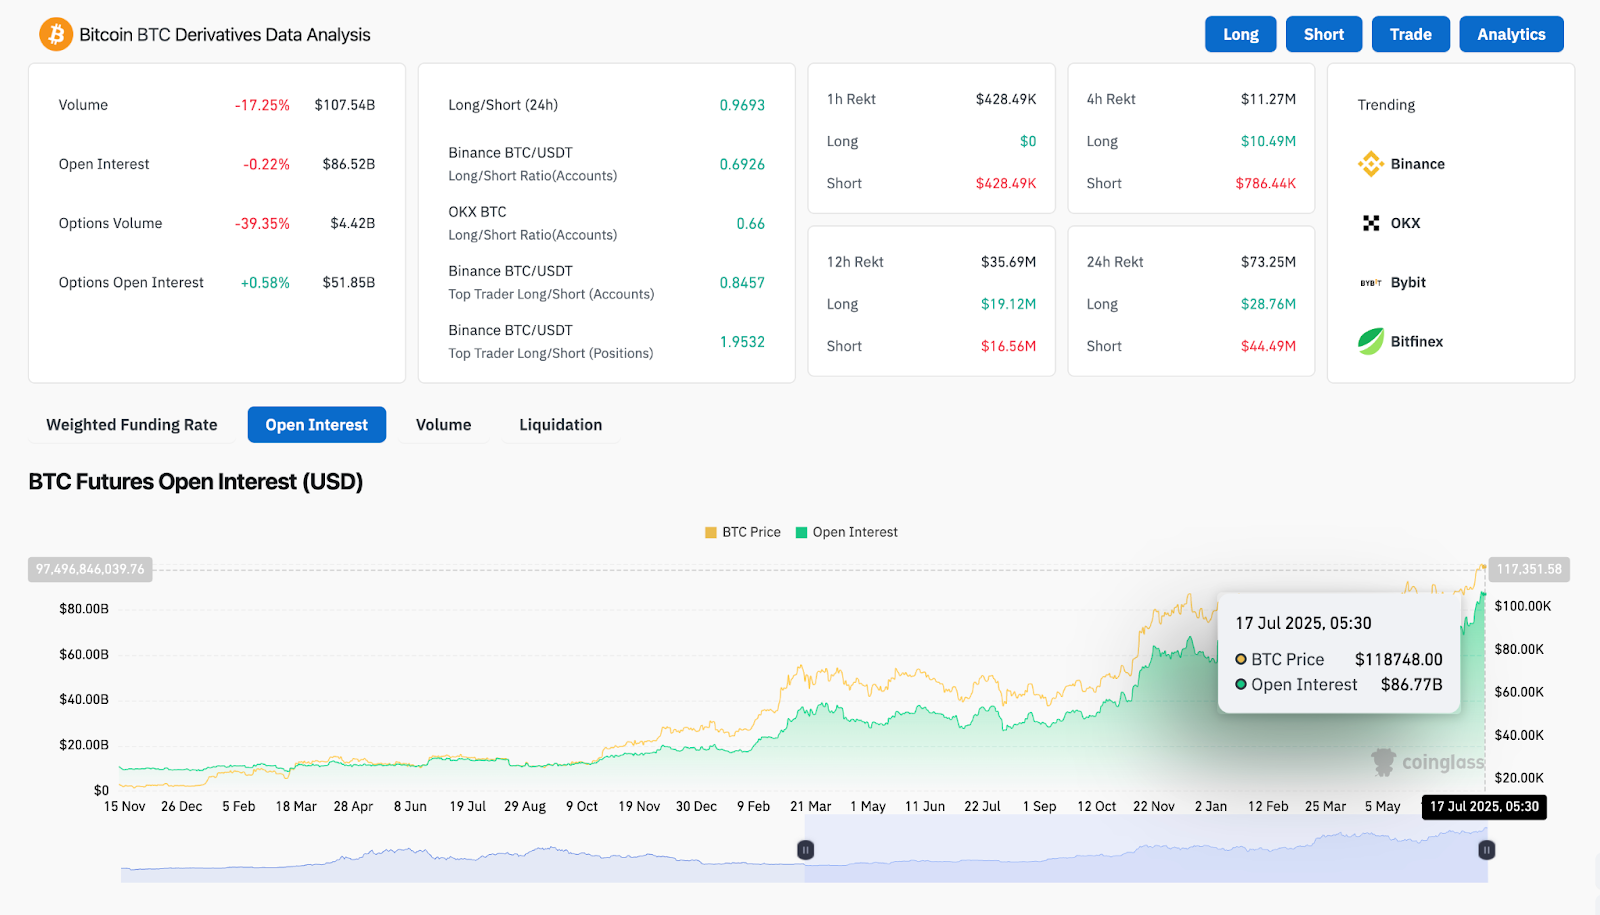
Derivatives data paints a mixed picture. According to Coinglass, Bitcoin’s 24-hour volume is down 17.25%, while options volume plunged by 39.35% to $4.42B. However, options open interest is up slightly at $51.85B, and futures open interest remains elevated at $86.77B.
The long/short ratio sits near parity (0.969), indicating market indecision. Notably, Binance top traders maintain a long-heavy bias (1.95), suggesting institutions may still be positioned for upside despite broader cooling.
Technical compression is also evident on the Bollinger Bands, particularly on the 4-hour chart. With band width tightening near $118,000, the market is preparing for a volatility expansion. Whether it resolves upward or downward depends on the ability of bulls to reclaim $120,000 with volume.
BTC Price Prediction: Short-Term Outlook (24h)
If Bitcoin price today fails to decisively clear $120,000 in the next session, a breakdown toward $116,000 and $113,600 becomes likely. The $115,398 Bollinger Band support on the 4-hour chart remains a near-term level to watch, with further downside targets near the liquidity clusters at $108,000 and $103,400.
However, if bulls reclaim $120,500 with confirmation, upside targets lie at $122,700 (upper band extension) and then $125,000, aligning with Fibonacci extensions and historic rejection zones.
Despite trend support from EMAs and Parabolic SAR, weakening OBV and rising volatility risk may favor short-term correction before any sustained breakout. Traders should monitor the $118,000–$120,000 zone closely as the immediate battlefield.
Bitcoin Price Forecast Table: July 18, 2025
| Indicator/Zone | Level / Signal |
| Bitcoin price today | $118,400 |
| Resistance 1 | $120,000 |
| Resistance 2 | $122,700 |
| Support 1 | $115,398 (BB Lower) |
| Support 2 | $113,653 / $108,000 |
| 4H EMA Cluster | 20/50/100/200 stacked (Bullish) |
| Bollinger Bands (4H) | Tightening, breakout likely |
| Parabolic SAR (1D) | Below price (bullish bias) |
| OBV (1D) | Flat near 1.84M |
| RSI (BTC Dominance) | 50.98 (falling) |
| Chande Momentum Oscillator | 64.87 (slightly curving down) |
| SMC Break of Structure | $119.2K swept, consolidation below |
| Derivatives Long/Short Ratio | 0.969 (Neutral) |
| Open Interest (Futures) | $86.77B (elevated, risk-sensitive) |
Disclaimer: The information presented in this article is for informational and educational purposes only. The article does not constitute financial advice or advice of any kind. Coin Edition is not responsible for any losses incurred as a result of the utilization of content, products, or services mentioned. Readers are advised to exercise caution before taking any action related to the company.


