
- Bitcoin faces bearish signals after losing $62K, with key support at $56K-$64K being tested.
- Market cautious as Bitcoin’s technicals weaken, caught between liquidity and economic pressures.
- Bitcoin’s RSI and MACD indicate declining momentum, with no imminent upside push.
Bitcoin (BTC) is experiencing a volatile technical landscape as September begins. The cryptocurrency recently dropped below a crucial $62,000 monthly close, and the weekly chart now reveals a bearish collapse pattern.
An analyst, Architect, noted that while technical indicators were not overtly positive, the situation may not be dire. Large buyers could still emerge this month, potentially preventing a steeper downturn. However, the technical backdrop doesn’t suggest any imminent upward price movement, keeping the market cautious.
The broader macroeconomic environment also significantly influences Bitcoin’s current positioning. The market is caught in a tug-of-war between improving global liquidity and deteriorating economic indicators. This balance has created a crisis, with no clear direction for risk assets, including Bitcoin.
On August 11, 2024, market analyst Architect highlighted a crucial level for Bitcoin to watch. He stated that holding above $62,000 would be extremely bullish, while a drop below $56,000 could signal a prolonged bearish period, potentially lasting up to a year.
Crypto analyst Captain Fabiak echoed this sentiment, stressing that Bitcoin’s ability to rally towards $68,000 in September hinges on defending the critical $54,000 support level. He suggested that if the bulls successfully protect this area, it could trigger a strong upward momentum, making $68,000 a realistic monthly target.
The technical analysis of the monthly Bitcoin chart noted by Architect on his X account shows key technical indicators, including the RSI, MACD, and moving averages. The RSI, currently at 62.50, suggests Bitcoin is approaching overbought territory, though it has not yet reached an extreme.
The MACD, which tracks momentum, shows a decline in bullish momentum, indicated by the narrowing gap between the MACD line and the signal line.
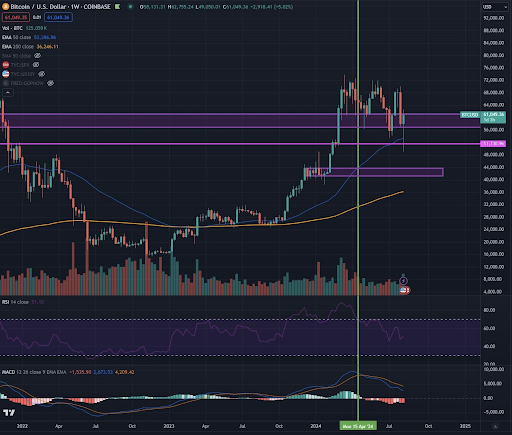
The chart also highlights a strong support zone between $56,000 and $64,000, a crucial range that Bitcoin has tested repeatedly. As of this writing, Bitcoin is trading at $57,740.51, with a market cap exceeding $1.14 trillion.
Disclaimer: The information presented in this article is for informational and educational purposes only. The article does not constitute financial advice or advice of any kind. Coin Edition is not responsible for any losses incurred as a result of the utilization of content, products, or services mentioned. Readers are advised to exercise caution before taking any action related to the company.


 Price Prediction: Canton Eyes Key Break After Market Activity Spike")

