
- BLUR’s bullish momentum pushes it to a 30-day high of $0.2278, with potential resistance at $0.2500.
- MACD shows growing bullish momentum, but a declining histogram hints at a possible reversal for BLUR.
- MFI indicates ongoing buying pressure, while RSI suggests a minor decrease in buying momentum for BLUR.
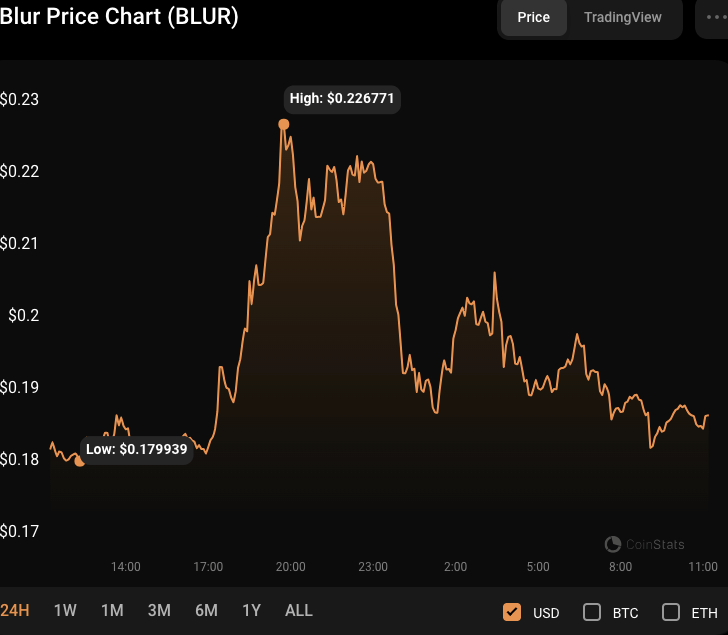
Despite kicking off the day at an intra-day low of $0.1796, the Blur (BLUR) market bulls have had the upper hand over the previous 24 hours. As a result, positive momentum drove the BLUR price to a 30-day high of $0.2278 before a modest decrease. BLUR was trading at $0.1859, up 3.17% from its 24-hour low, at press time.
If bullish momentum breaks over the $0.2278 barrier, the next resistance to monitor is around $0.2500. However, if the bullish trend fades, BLUR may find support around the $0.1800 level, where buyers may come in to halt further declines.
During the price increase, BLUR’s market capitalization and 24-hour trading volume increased by 3.53% and 180.03%, to $187,825,792 and $295,555,295 respectively. This market capitalization and trading volume growth implies that investor interest and activity in BLUR have increased significantly.
With a score of 0.0070, the Moving Average Convergence Divergence (MACD) is in the positive range, indicating that the bullish momentum for BLUR is growing. However, a reversal or consolidation might occur shortly, with the MACD blue line advancing south and nearing the signal line.
In addition, the histogram indicates less bullish momentum as it approaches the zero line. This pattern suggests a likely change in market mood and a decline in BLUR purchasing pressure. If the MACD blue line continues to move south and passes below the signal line, it might confirm a bearish signal and signify a probable reversal in BLUR’s positive momentum.
On the other hand, the Money Flow Index (MFI) rating of 67.62 indicates that there is still some purchasing pressure in the market for BLUR. This trend shows that, although there are some signals of a possible reversal or consolidation, it is not yet a significant negative signal. If the MFI rating falls below 50 and begins to trend lower, it may suggest a change in sentiment toward selling, thus strengthening the negative sentiment for BLUR.
Furthermore, the Relative Strength Index (RSI) is trending below its signal line with a value of 53.39, indicating a minor decrease in BLUR’s buying momentum. If the RSI goes below 50, the positive momentum may weaken even more, adding to the negative argument for BLUR.
However, suppose the RSI begins to climb above its signal line and go into overbought territory. In that case, it may suggest a possible change in sentiment toward purchasing, weakening the bearish argument for BLUR.
On the 3-hour price chart, the Average True Range (ATR) value of 0.0110 indicates that BLUR has been experiencing relatively moderate volatility in its price fluctuations. This low volatility pattern may signal that BLUR is in a consolidation phase when the price is range-bound and not making substantial swings. As the ATR falls, the bullish argument for BLUR may diminish, indicating a lack of momentum and likely price stagnation.
In conclusion, BLUR’s price surge shows promise, but signs of potential reversal and consolidation warrant caution for investors.
Disclaimer: The information presented in this article is for informational and educational purposes only. The article does not constitute financial advice or advice of any kind. Coin Edition is not responsible for any losses incurred as a result of the utilization of content, products, or services mentioned. Readers are advised to exercise caution before taking any action related to the company.


