
- BNB sustains bullish trend above $1,200 with strong support from major EMAs
- Rising open interest and spot inflows signal continued investor accumulation trend
- Key breakout above $1,242 may trigger sharp rally toward the $1,300–$1,340 zone
BNB (Binance Coin) continues to show strong bullish momentum, maintaining its position above the $1,200 mark. After reclaiming this critical psychological zone, the coin’s technical structure indicates sustained buying pressure and steady investor confidence. The broader trend remains firmly in favor of the bulls, with BNB comfortably trading above all major exponential moving averages (EMAs).
Uptrend Intact Above Key Moving Averages
BNB’s uptrend remains stable, supported by all four major EMAs—20, 50, 100, and 200. The 20 EMA, currently around $1,152, and the 50 EMA at $1,098, have both curved upward, confirming short-term bullish momentum. These zones serve as dynamic supports for traders looking to accumulate during minor pullbacks.
Additionally, the 100 EMA at $1,048 and 200 EMA near $991 continue to provide strong structural backing for the broader bullish trend. As long as BNB’s price stays above $1,150, market sentiment favors continued upside movement. A close below $1,080 might weaken short-term momentum, but the long-term trend remains aligned with bullish continuation.
Related: Dogecoin Price Prediction: 401(k) Inclusion Rumor Sparks Bullish Buzz
Fibonacci Zones Indicate Key Resistance Levels
The Fibonacci retracement drawn from the recent swing low of $926 to the high of $1,340 reveals multiple resistance points. The 0.382 level sits near $1,302, while the 0.5 and 0.618 levels lie at $1,291 and $1,279, respectively. These are crucial short-term barriers that traders are monitoring closely.
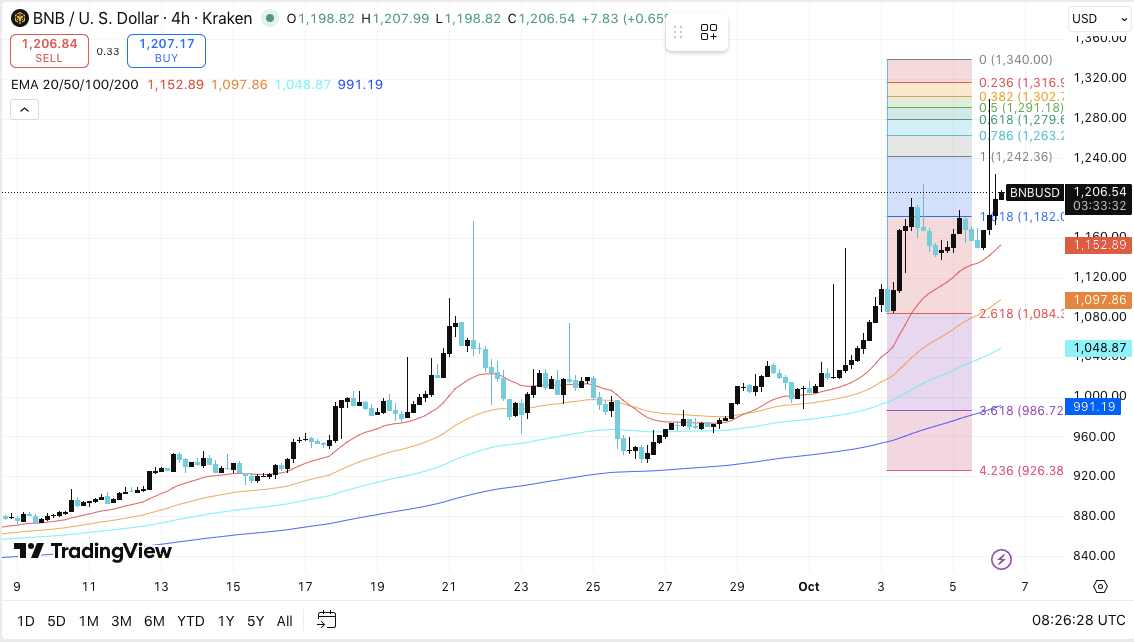
Currently, BNB trades near $1,206, between immediate support at $1,182 and resistance around $1,242. A decisive move above $1,242 could pave the way for a rally toward the $1,279–$1,302 zone. Beyond that, the range between $1,316 and $1,340 remains the next target for bulls. Hence, the $1,182–$1,152 range continues to serve as strong demand territory if a minor correction occurs.
Futures Open Interest Points to Rising Leverage
Data from BNB’s futures market shows a consistent surge in open interest throughout 2025. From less than $500 million in early March, open interest now exceeds $2.35 billion as of October 6. This sharp rise signals growing speculative and institutional activity in derivatives markets.

The expansion in leveraged positions often precedes higher volatility, but in this case, it reflects trader confidence in sustained price appreciation. As long as BNB maintains stability above $1,000, sustained open interest above $2 billion supports a bullish outlook, emphasizing that long positions continue to dominate the futures market.
Spot Inflows Highlight Investor Accumulation
On-chain data reveals a steady rise in BNB spot inflows since mid-September. On October 6, net inflows reached $45.74 million, coinciding with BNB’s climb to $1,209.51. This consistent pattern of positive netflows suggests that investors are accumulating, anticipating a continuation of the uptrend.
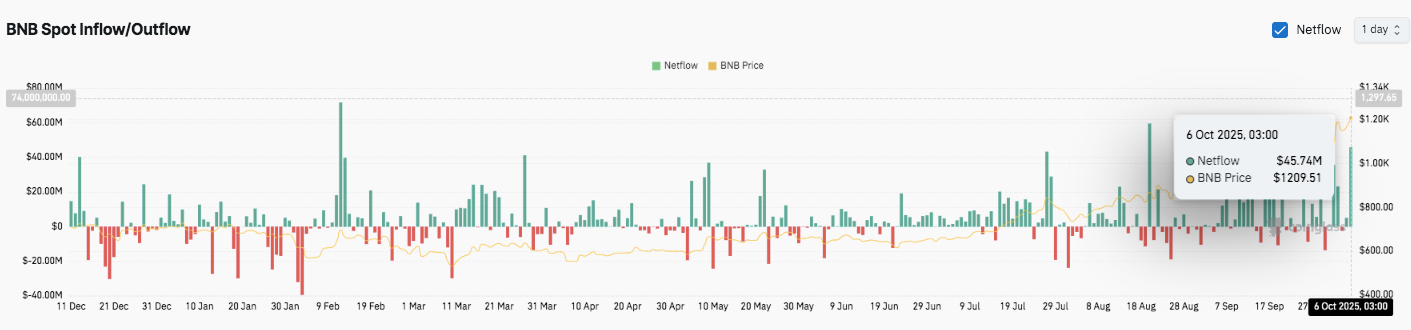
Moreover, historical patterns show that such inflow spikes have preceded strong rallies, reinforcing market optimism. If the buying trend continues, BNB could soon confirm a sustained breakout toward $1,300 and potentially retest the $1,340 zone.
Related: Cardano Price Prediction: ADA Consolidates as Coinbase Reserves Surge 462%
Technical Outlook for BNB (Binance Coin)
BNB maintains a solid technical structure as the market enters October, with well-defined support and resistance zones shaping near-term expectations.
Upside levels: $1,242, $1,279, and $1,302 stand as immediate resistance points. A breakout beyond these could propel BNB toward $1,316 and $1,340.
Downside levels: Initial support lies at $1,182, followed by $1,152 (20 EMA) and $1,098 (50 EMA). A deeper pullback could retest $1,048 or even $991 (200 EMA).
Resistance ceiling: The $1,316–$1,340 range forms a critical barrier. A daily close above $1,340 could confirm a continuation of the broader uptrend.
The chart suggests that BNB is consolidating above its short-term EMAs, forming a bullish continuation pattern. This compression phase often precedes sharp price expansion, especially when backed by rising volume and open interest.
Will BNB Hold Its Gains Above $1,200?
BNB’s bullish setup for October depends on its ability to sustain above $1,180 and reclaim the $1,242 resistance area. Sustained accumulation and strong inflows hint at continued optimism. If momentum strengthens, BNB could target $1,300–$1,340 in the short term.
However, a daily close below $1,150 would weaken near-term bias, opening the door to a correction toward $1,098. For now, buyers remain in control, and the confluence of on-chain demand and favorable technical structure suggests BNB is positioned for another upward leg this month.
Related: BNB Price Under Scrutiny as Grok Report Flags Centralized Supply Risk
Disclaimer: The information presented in this article is for informational and educational purposes only. The article does not constitute financial advice or advice of any kind. Coin Edition is not responsible for any losses incurred as a result of the utilization of content, products, or services mentioned. Readers are advised to exercise caution before taking any action related to the company.


