 Price Prediction for July 29, 2025: Can Bulls Maintain Control Above $840?")
The BNB price today is holding near $846 after staging an aggressive rally that broke above major structural resistance levels. The move has been supported by strong derivatives inflow and a bullish alignment of technical indicators. Market participants are now eyeing whether the rally can sustain without a pullback toward key demand zones.
What’s Happening With BNB’s Price?
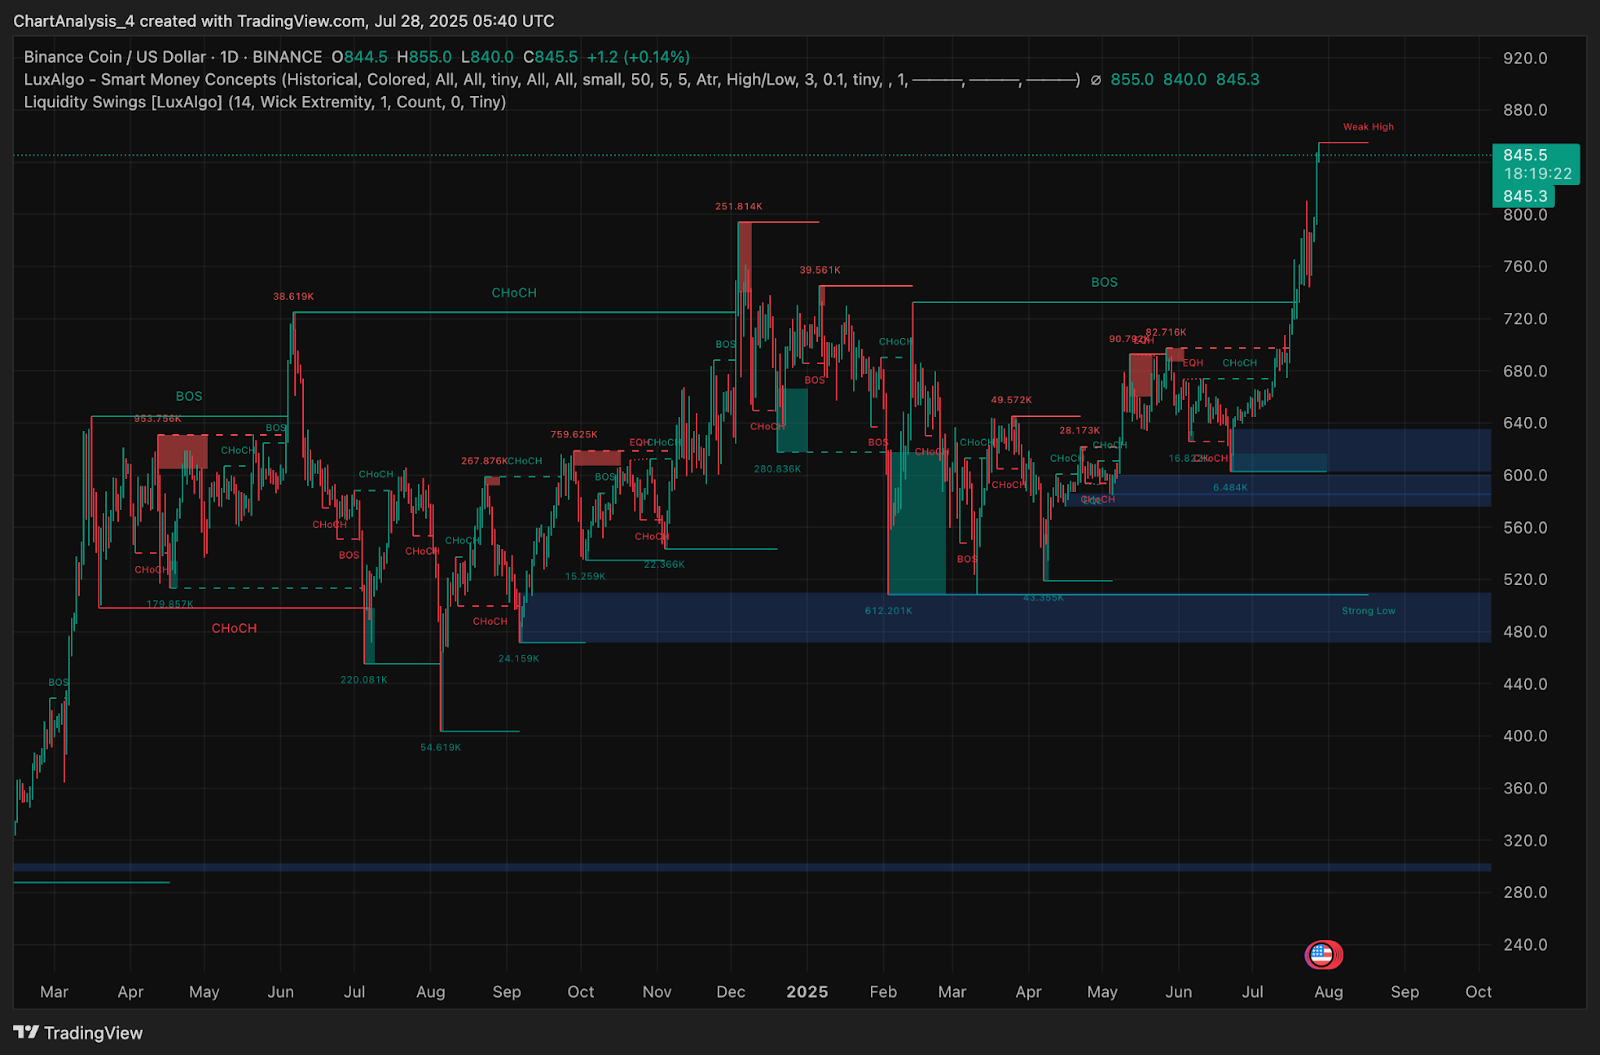
BNB has extended its bullish momentum into late July by clearing a critical structure near $730 and flipping previous highs into support. The daily chart confirms multiple Break of Structure (BOS) levels, and the Smart Money Concepts view shows a clean rally through a previously trapped liquidity zone between $620 and $680. With a weak high marked at $855, BNB is currently testing this zone with strength.
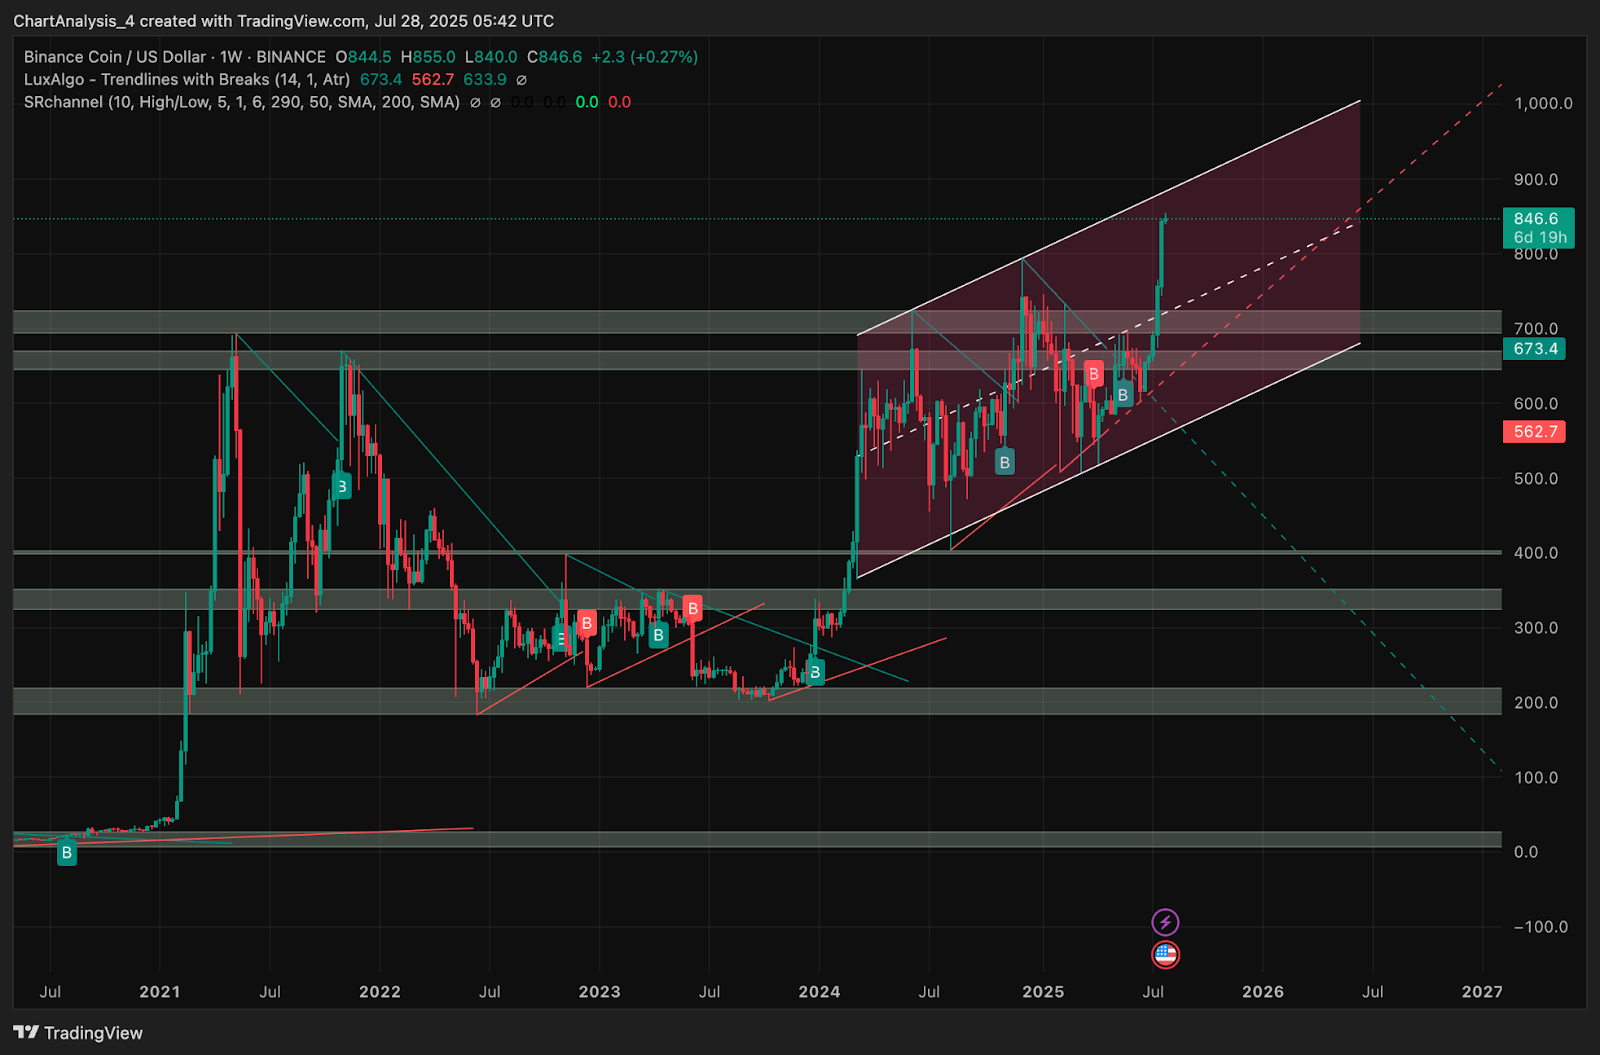
On the weekly chart, price has broken above the midline of the ascending channel and is pushing toward the upper trend boundary. BNB has also confirmed the breakout from the multi-month triangular compression that began in 2022. The current structure suggests a clear macro shift favoring bulls, with the $700–$730 region now acting as a key demand base.
Why Is The BNB Price Going Up Today?
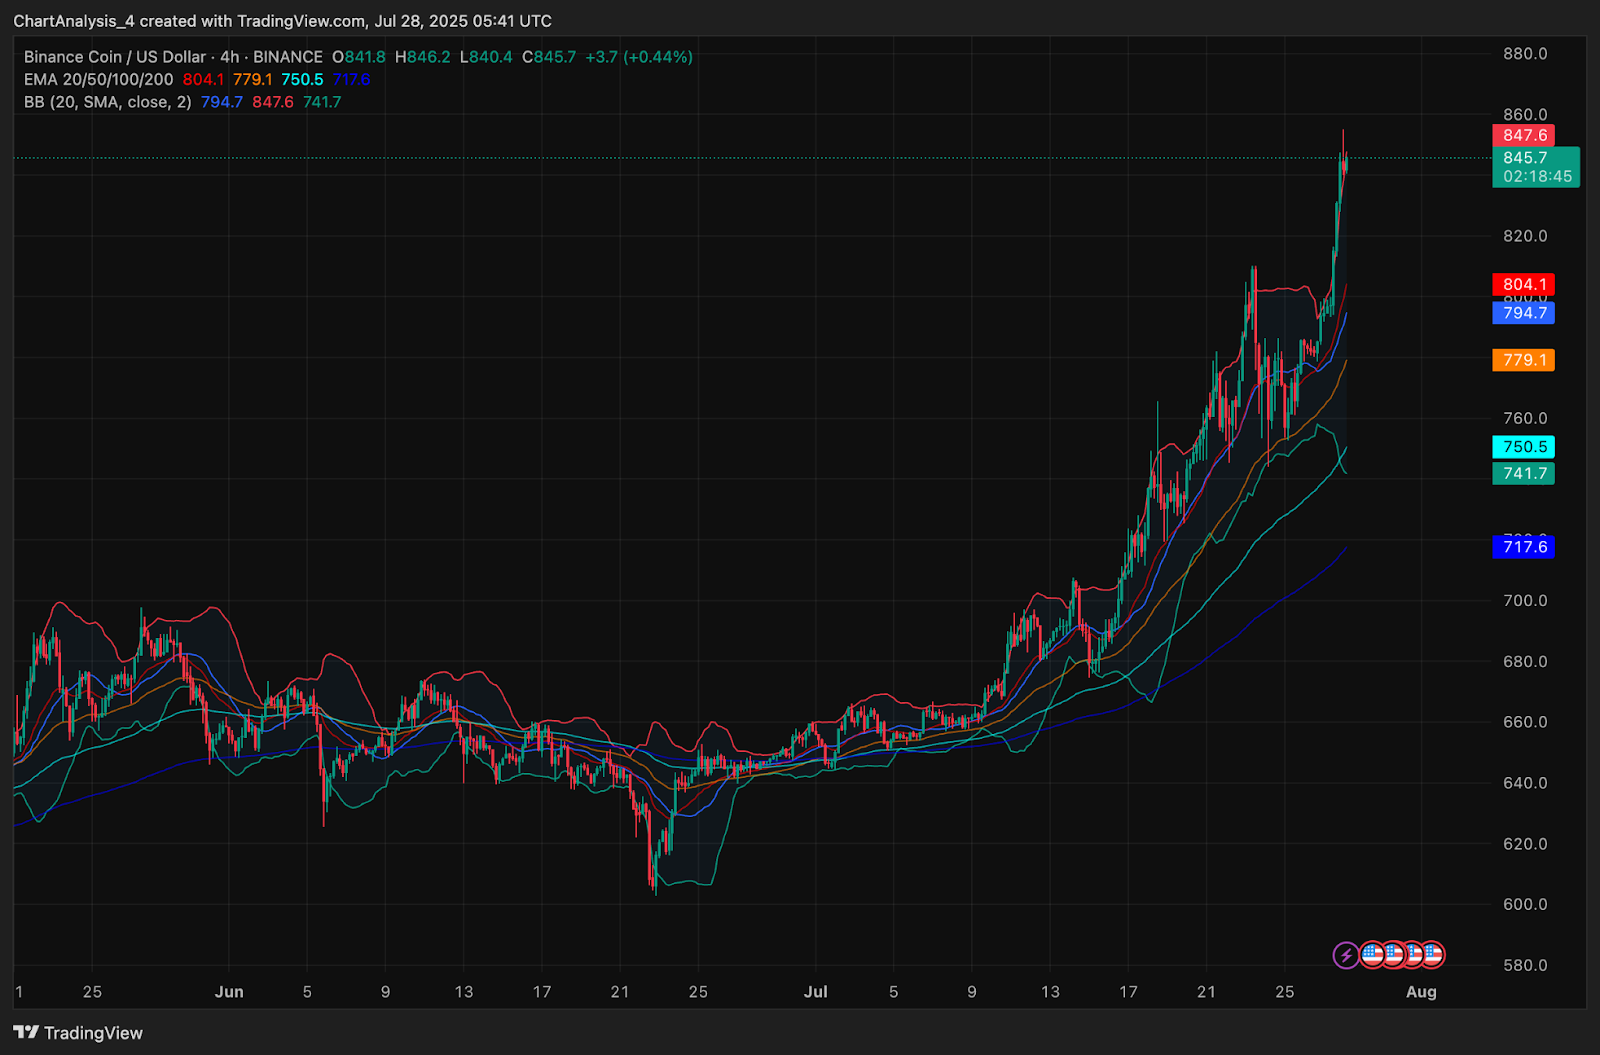
The answer to why BNB price going up today lies in both momentum and derivatives activity. BNB has rallied over 13% in the past five days, with the 4-hour chart showing exponential moving average clusters (20/50/100/200) now fully stacked in bullish order beneath price. Notably, the latest push found support at the 20 EMA near $804 before launching toward $855.
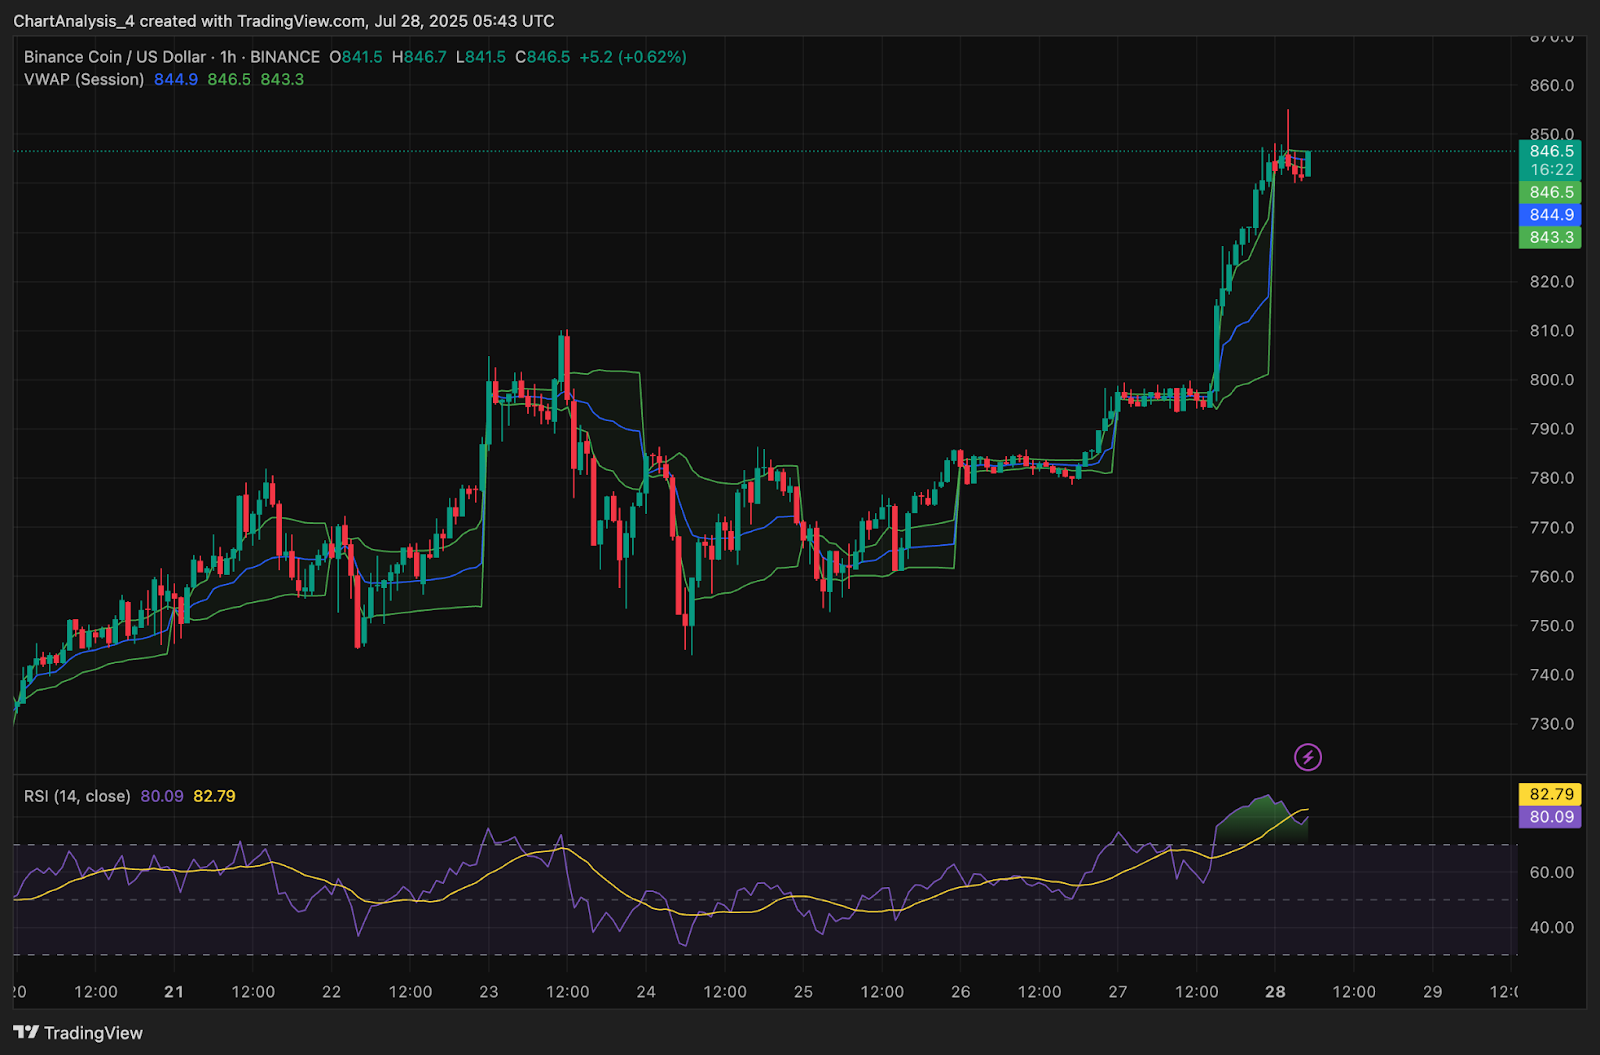
Bollinger Bands on the 4-hour chart are in full expansion mode, a classic volatility breakout signal. Price has consistently hugged the upper band since July 21, and pullbacks are being bought aggressively. On the 1-hour timeframe, RSI is now hovering above 82, suggesting overbought conditions, though the lack of divergence still supports bullish continuation. VWAP bands also confirm the bullish structure, with price riding above the session midline.
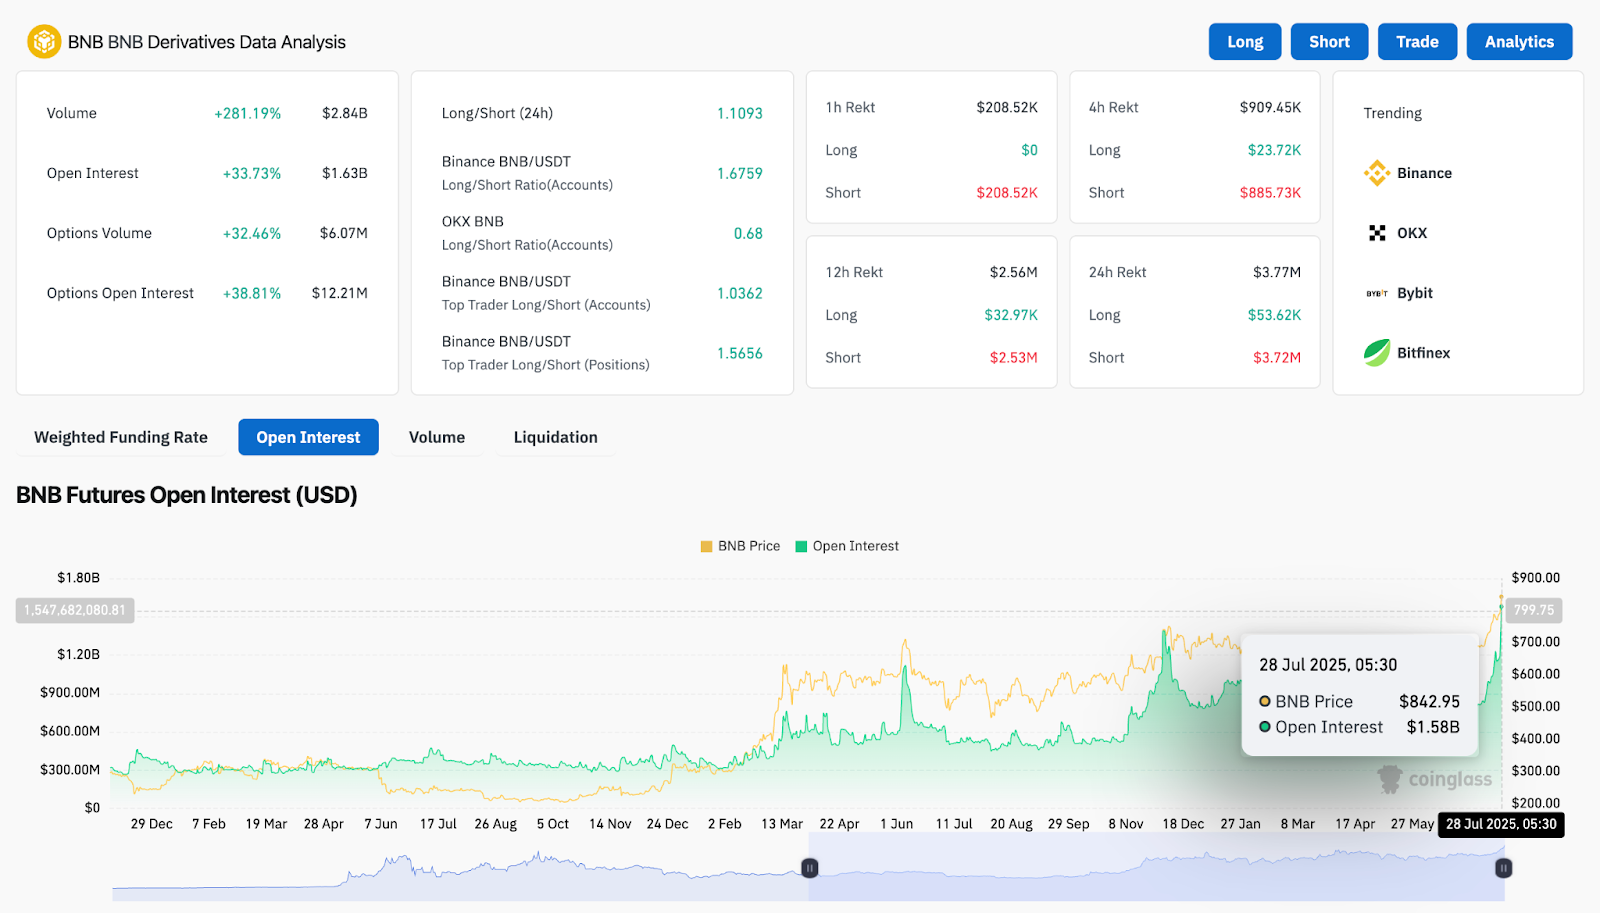
From a derivatives perspective, Coinglass data shows a massive +281% surge in daily volume to $2.84B. Open interest has jumped 33.7% to $1.63B, while the long/short ratio across Binance accounts is 1.67, reflecting strong long-side dominance. Top trader positioning is also tilted long, reinforcing the conviction behind this breakout.
Price Indicators Show Expansion With No Reversal Signals Yet
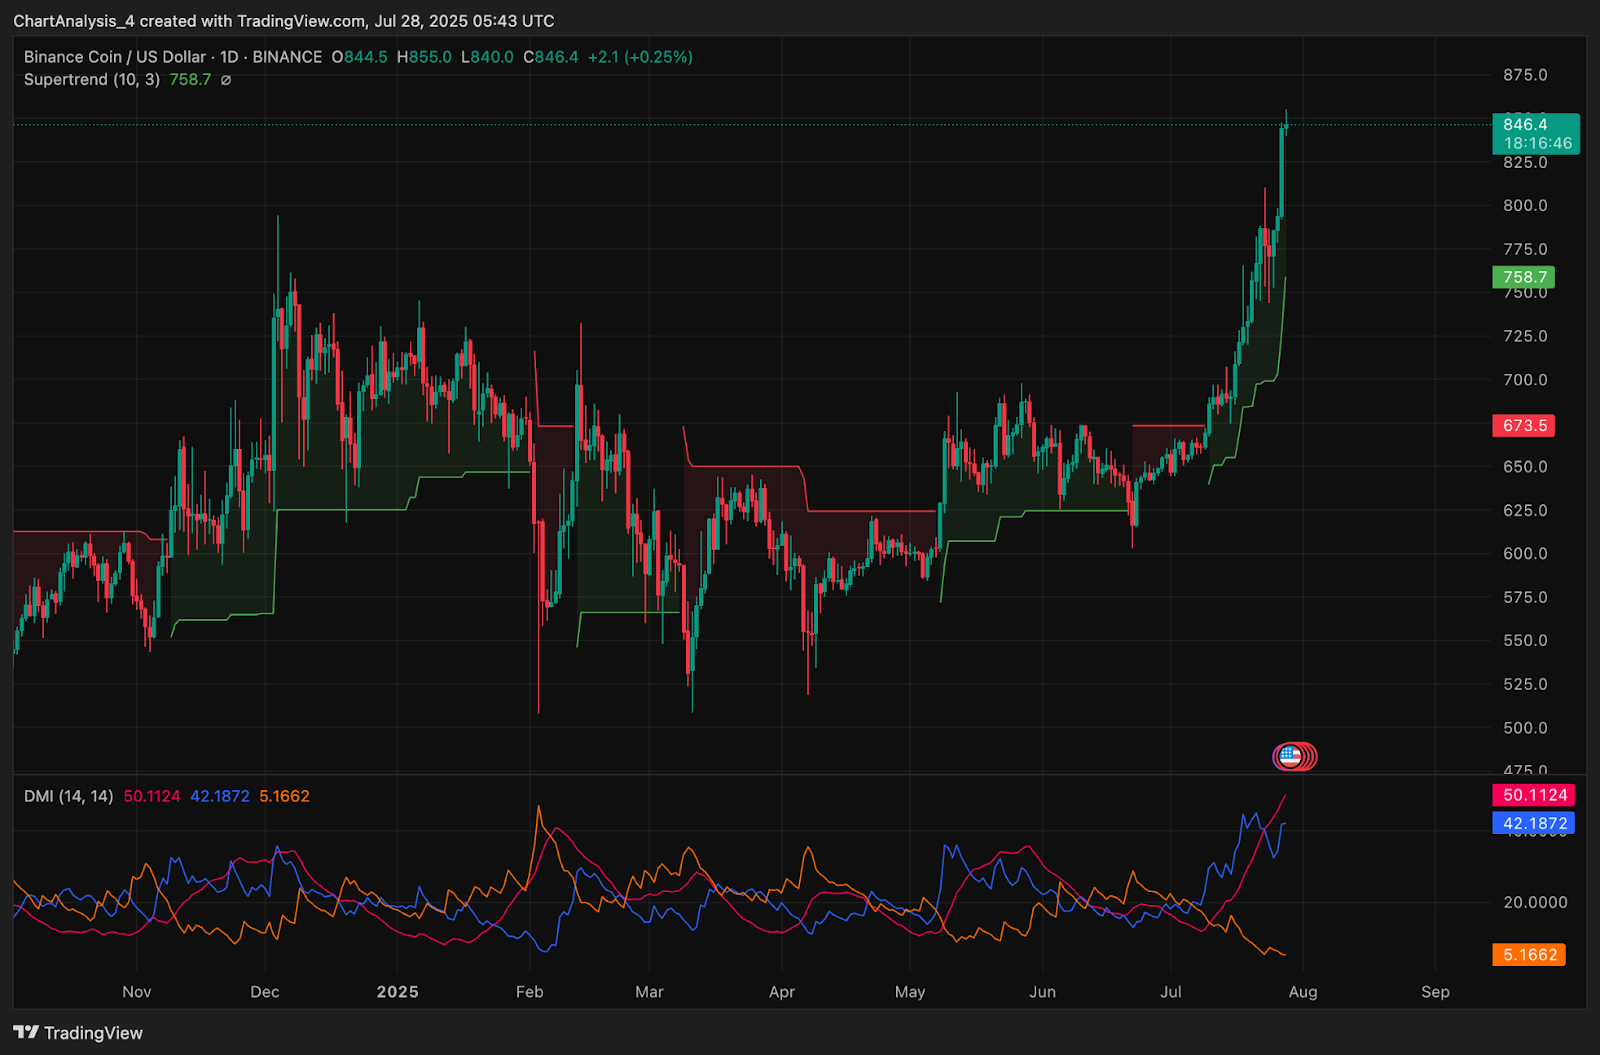
The daily Supertrend flipped bullish at $758.7 and remains intact as price extends above $840. Directional Movement Index (DMI) readings are also supportive: the +DI sits at 50.1 while ADX climbs above 42, indicating a trending environment with strong buyer pressure. The -DI remains suppressed near 5.1, further confirming the lack of active sell-side momentum.
On the 4-hour Bollinger chart, price action has not only breached the upper band but is maintaining body closes above it. This reinforces the likelihood of further expansion. The EMA cluster at $804 (20 EMA), $779 (50 EMA), and $750 (100 EMA) continues to trail the price, offering layered dynamic support zones.
BNB Price Prediction: Short-Term Outlook (24H)
If BNB price can consolidate above the $840–$845 zone, the next upside target lies near $880, which marks the upper boundary of the current trend channel on the weekly chart. A clean breakout above that could open a path to test $900–$920 zones in early August.
On the flip side, if a pullback occurs, the $804–$820 region remains the first key support cluster, aligning with the 20/50 EMA and Bollinger median band. A deeper correction would bring the $760–$780 zone into play, which holds confluence from the 100 EMA and prior breakout structure.
As long as derivatives interest remains skewed long and price stays above key short-term EMAs, BNB price today remains bullish. However, traders should monitor intraday RSI cooling and volume drops for early signs of reversal.
BNB Price Forecast Table: July 29, 2025
| Indicator/Zone | Level / Signal |
| BNB price today | $846.5 |
| Resistance 1 | $880 |
| Resistance 2 | $900 |
| Support 1 | $804 (20 EMA) |
| Support 2 | $760–$780 |
| RSI (1H) | 82.79 (Overbought) |
| Bollinger Bands (4H) | Expanded, breakout confirmation |
| Supertrend (1D) | Bullish, flipped at $758.7 |
| DMI / ADX (1D) | +DI 50.1, ADX rising (>42) |
| VWAP (1H) | Support around $844–$846 |
| Derivatives Volume | $2.84B (+281%), long-heavy |
| Open Interest | $1.63B (+33.7%) |
Disclaimer: The information presented in this article is for informational and educational purposes only. The article does not constitute financial advice or advice of any kind. Coin Edition is not responsible for any losses incurred as a result of the utilization of content, products, or services mentioned. Readers are advised to exercise caution before taking any action related to the company.


