- Analysis suggests that the recent decline in BNB might continue.
- The intraday peak of $245.08 for BNB is met with strong opposition.
- Bulls in BNB need to keep battling until they have snuffed out the bears and established a new trend.
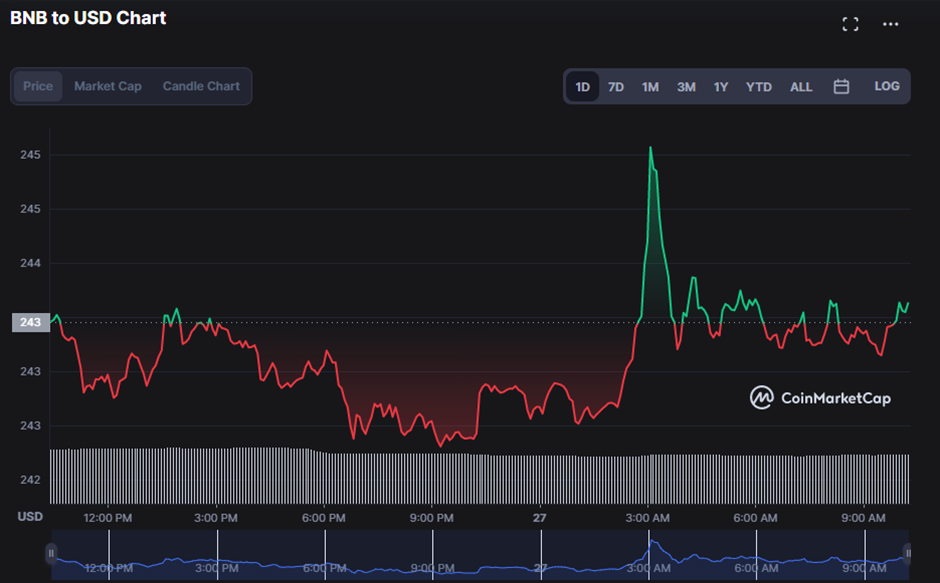
The BNB price has fluctuated between $242.22 and $245.08 during the last day, with the bears having a significant presence in the market. However, as of press time, this negative momentum was nullified and bulls seized market control, driving prices to $243.51, a 0.02% rise.
This improvement is reflected in a 0.03% increase to $38,931,044,132 in market capitalization; but, a 9.74% decline in 24-hour trading volume to $284,035,090 suggests the present trend is unlikely to continue and a reversal may be near.

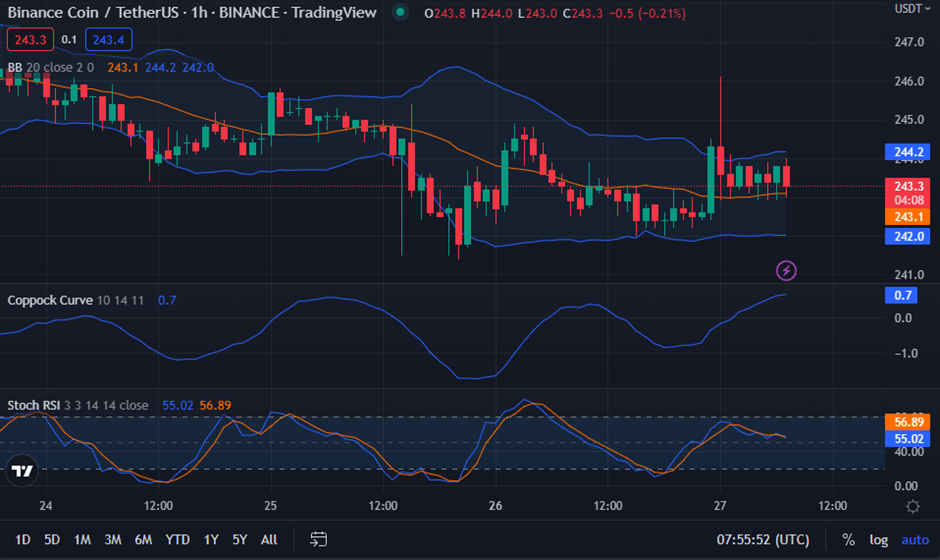
With the upper band touching 244.2 and the lower band touching 242.0, the Bollinger Bands indicate that selling pressure in the BNB market is increasing. This downward trend is supported by the bearish engulfing candlestick pattern.
Currently, the Coppock curve is pointing north with a reading of 0.6, indicating that bulls have the upper hand and may be able to take control of the market if they continue to fight.
A Stoch RSI reading of 55.02 suggests a steady market, raising the possibility of a breakout and anticipating a positive reversal in the short term, which has investors hopeful. Even if prices are likely to return upward, this is less likely now that the stochastic RSI has moved below the signal line, indicating that selling pressure is outweighing buying pressure.

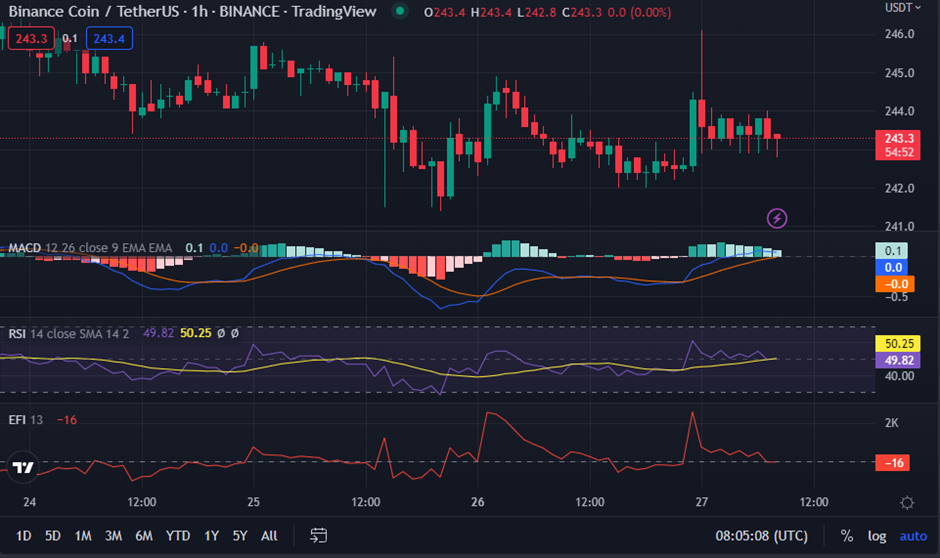
Bullish momentum in BNB prices is indicated by the moving average convergence/divergence (MACD) indicator being in the positive region. At the time of publication, the MACD blue line was rising above the signal line, supported by a value of 0.1. Additionally bolstering the notion that bear dominance will be threatened is the histogram’s upward tendency.
The Relative Strength Index (RSI) on the 1-hour price chart is 48.89 and is going south, reaching the oversold area. This RSI pattern suggests that bulls are becoming tired, and hence, more negative dominance may be anticipated in the near future.
Bearish market sentiment is predicted when the Elder Force Index falls below the “0” line, as shown on the BNB chart, where the EFI is now at -17 and going south, suggesting that the current downward trend on the BNB market is likely to persist.

BNB’s bullish trend may continue if the bulls are able to defend the resistance level, despite the fact that several indicators are pointing to another bear run.
Disclaimer: The views and opinions, as well as all the information shared in this price analysis, are published in good faith. Readers must do their own research and due diligence. Any action taken by the reader is strictly at their own risk, Coin Edition and its affiliates will not be held liable for any direct or indirect damage or loss.
Disclaimer: The information presented in this article is for informational and educational purposes only. The article does not constitute financial advice or advice of any kind. Coin Edition is not responsible for any losses incurred as a result of the utilization of content, products, or services mentioned. Readers are advised to exercise caution before taking any action related to the company.


