 Price Prediction 2025, 2026, 2027, 2028-2030")
BONK price is showing early signs of a bullish reversal in 2025 following months of range-bound trading. As key technical levels break and trend indicators realign, could the memecoin regain momentum heading into the latter half of the decade?
Bonk (BONK) Price Prediction 2025
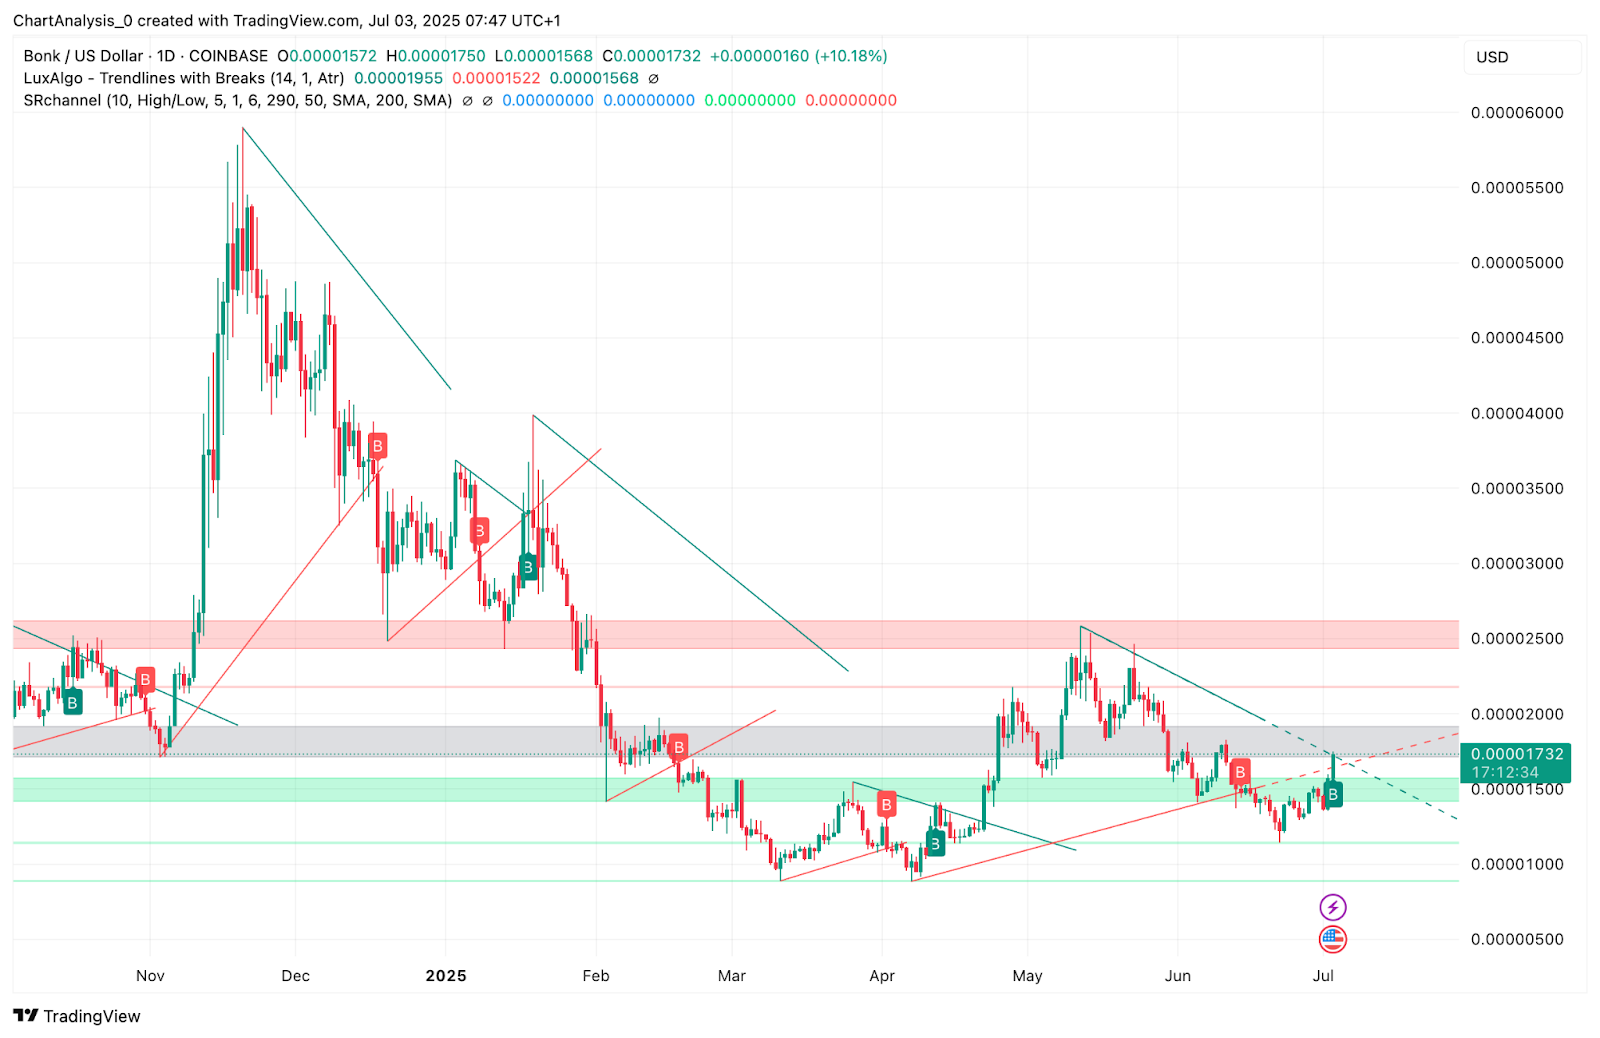
BONK price today trades around $0.0000173, rising over 10% on the day after breaking through a key falling wedge resistance. After bottoming out near $0.0000120 in June, BONK formed a series of higher lows and successfully reclaimed the $0.0000150 demand zone. This structure, along with improving volume, suggests accumulation may be underway heading into Q3 2025.
Bonk Price Indicators, Signals, and Graphs(1Y)
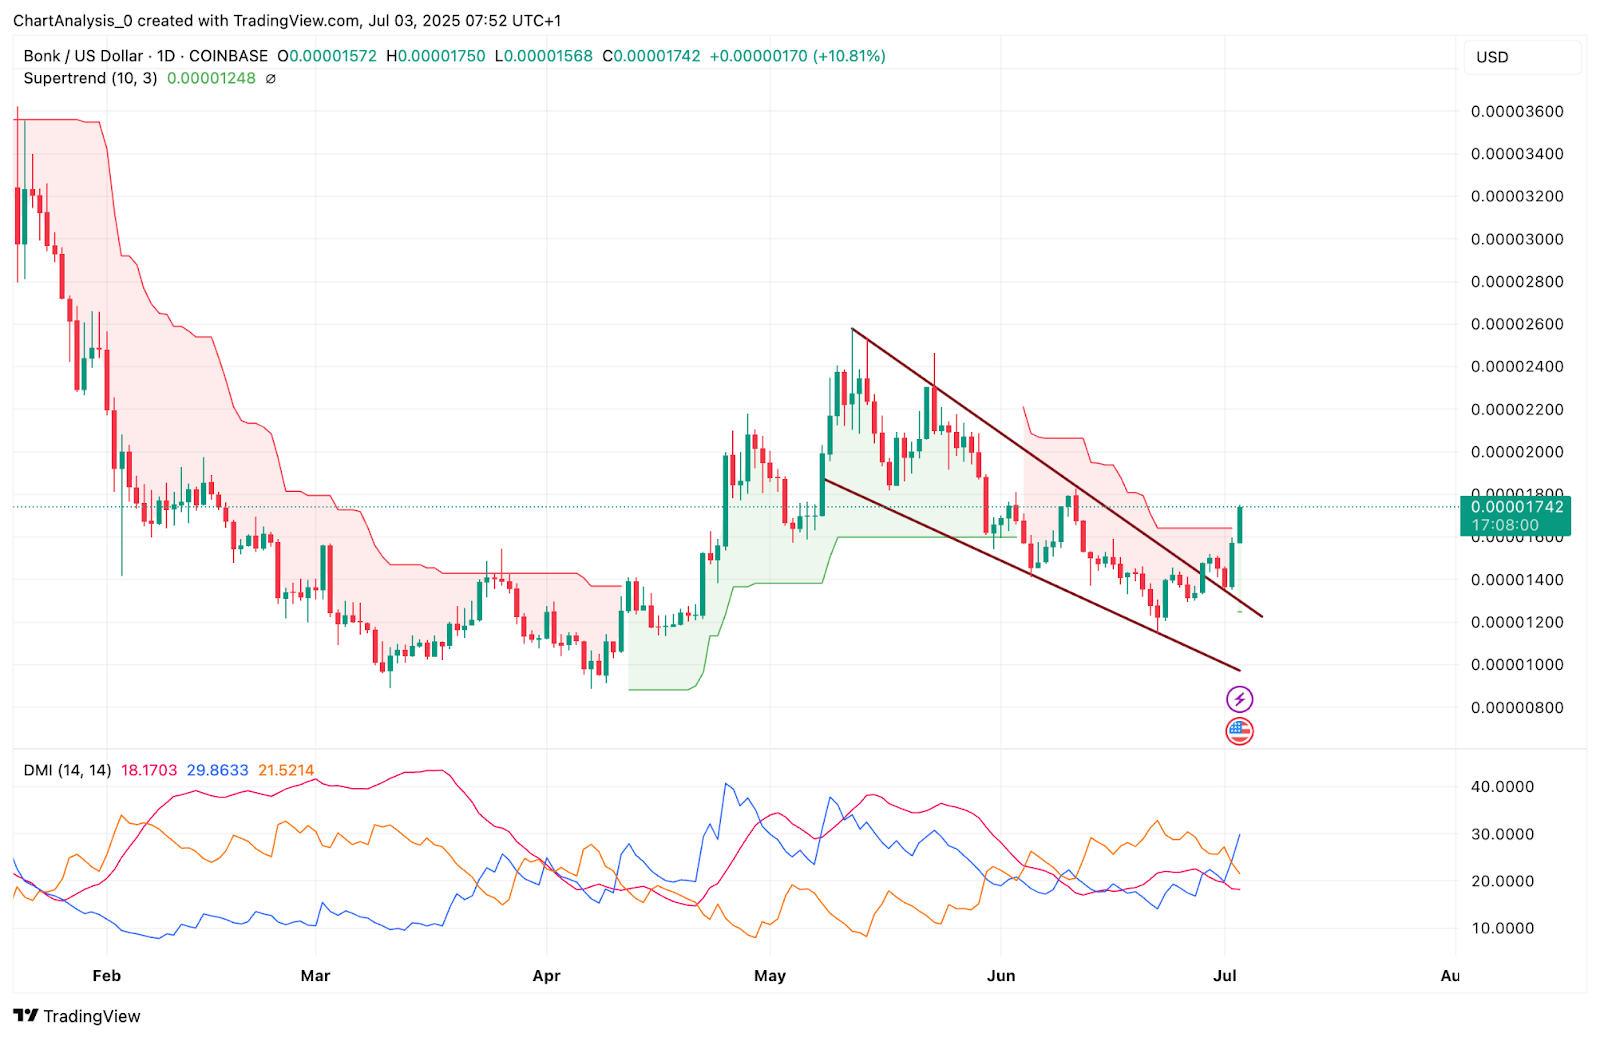
BONK has just broken out of a falling wedge structure that had restricted its upside since May, signaling a potential shift in trend. This breakout aligns with confirmation from multiple technical indicators, strengthening the case for bullish continuation in the second half of 2025.
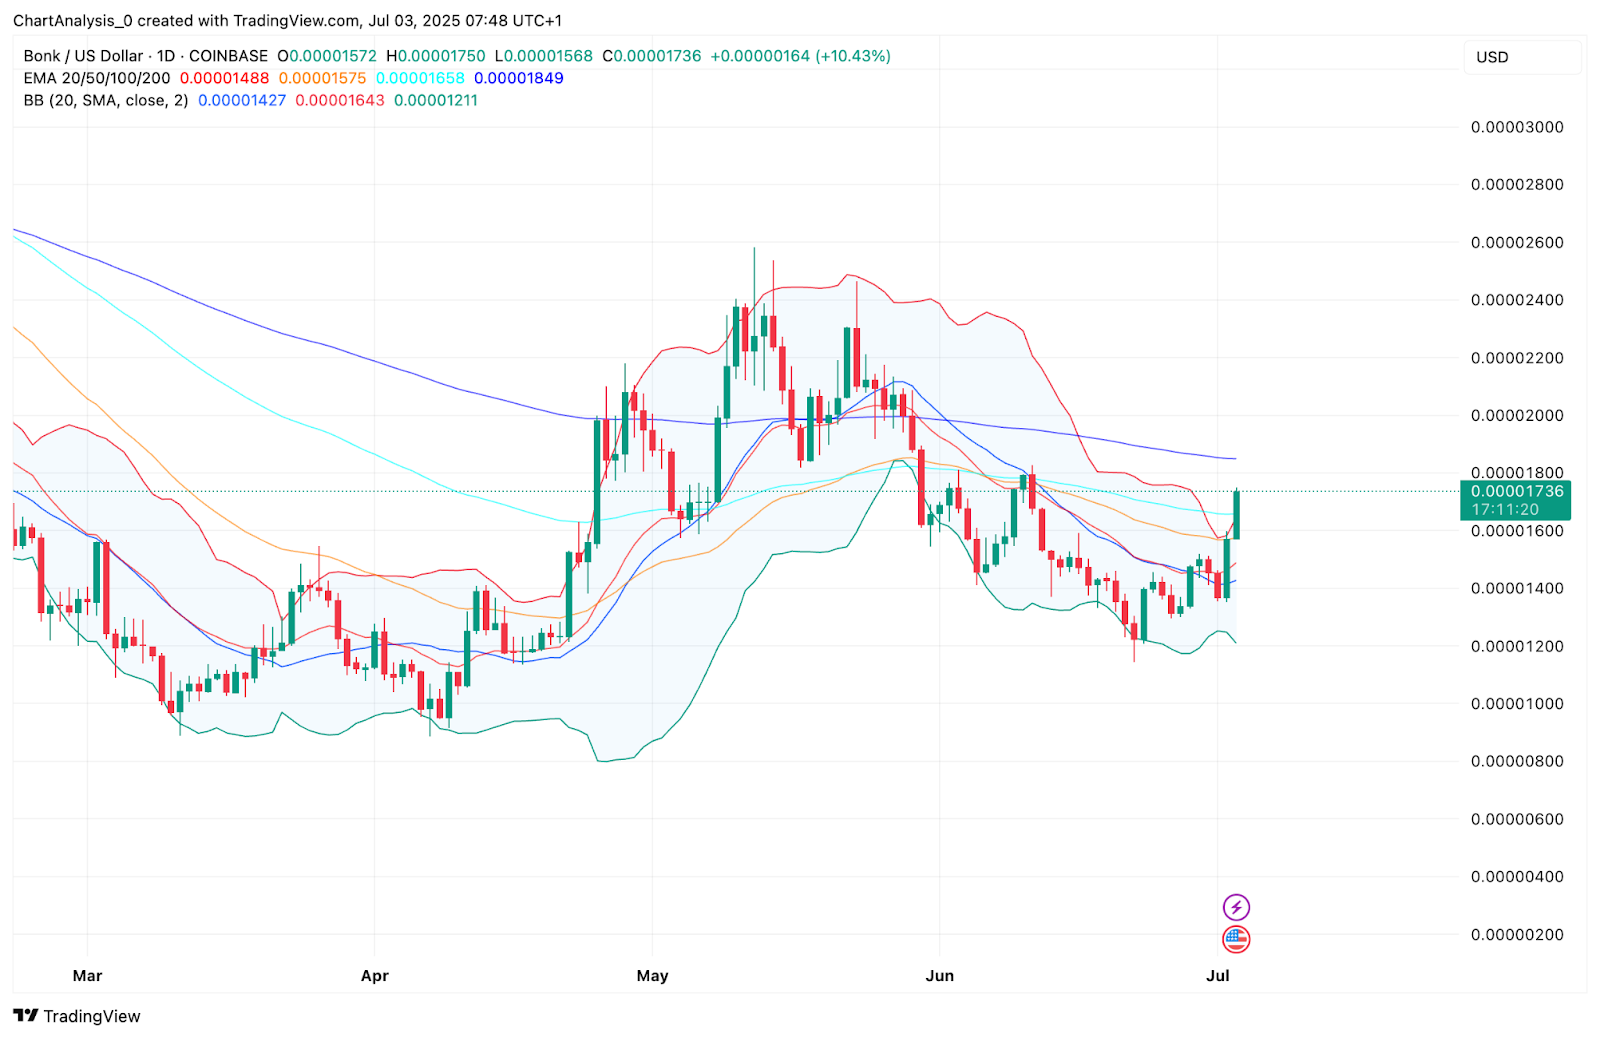
A recent crossover between the 20 and 50 exponential moving averages reflects short-term momentum gaining traction. Price is now testing the 100 EMA near $0.0000184, which may serve as the next area of dynamic resistance. Simultaneously, Bollinger Bands have begun to widen after a period of compression, a typical precursor to heightened volatility. The fact that price has climbed above the midline further reinforces bullish intent.
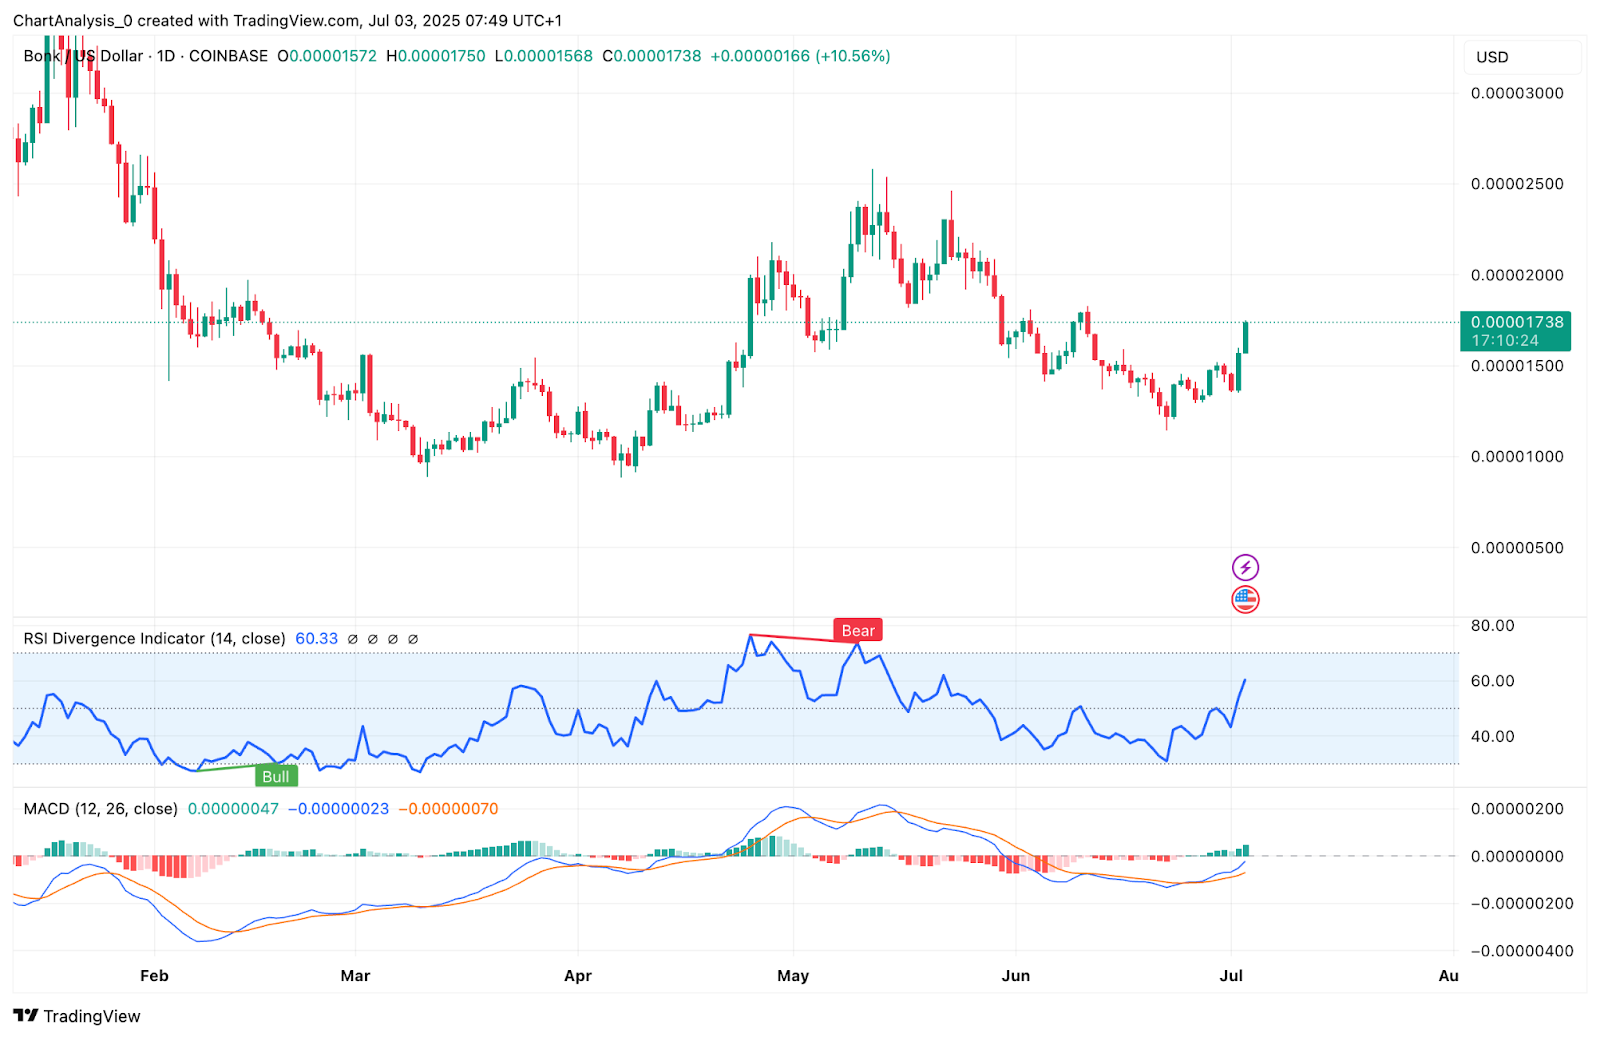
Momentum indicators also support the breakout. The relative strength index (RSI) has surged above 60, indicating renewed strength and confirming bullish momentum. At the same time, the MACD has crossed into positive territory for the first time since early May, with both the MACD line and histogram pointing upward, reflecting growing buyer conviction.
The Supertrend indicator has flipped green at approximately $0.0000124, ending a multi-week bearish phase and aligning with the broader reversal narrative.
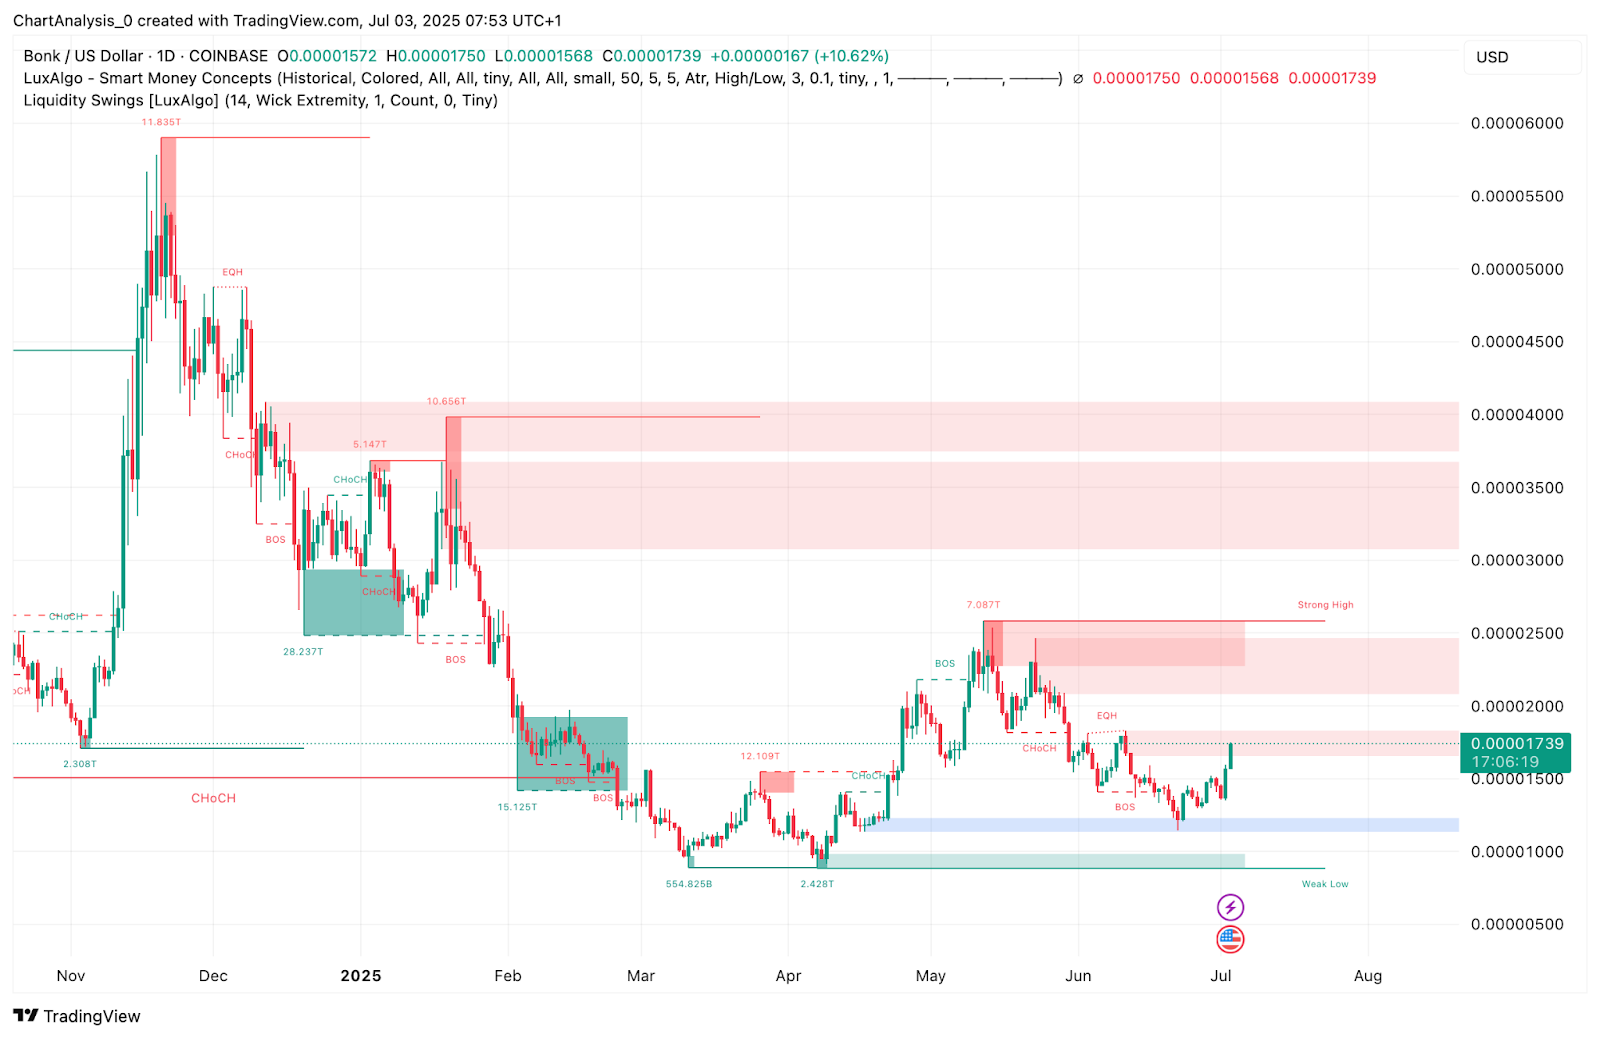
On-chain liquidity mapping and Smart Money Concepts add further insight. A clean break of structure (BOS) and change of character (CHoCH) are now visible, with BONK challenging the mid-supply zone between $0.0000180 and $0.0000200. If this level is cleared, a move toward the liquidity zone around $0.0000250 becomes increasingly likely.
For the remainder of 2025, if bulls can maintain control above the critical $0.0000150–$0.0000160 support cluster, BONK may advance toward $0.0000220–$0.0000250. However, should price fall back below $0.0000140, the uptrend could be temporarily disrupted. Even then, the higher low structure would remain intact as long as $0.0000120 holds as a macro support level.
Bonk (BONK) Price Targets 2025 – 2030
| Year | Potential Low ($) | Potential Average ($) | Potential High ($) |
| 2025 | 0.0000120 | 0.0000180 | 0.0000250 |
| 2026 | 0.0000150 | 0.0000235 | 0.0000300 |
| 2027 | 0.0000200 | 0.0000280 | 0.0000380 |
| 2028 | 0.0000240 | 0.0000325 | 0.0000450 |
| 2029 | 0.0000280 | 0.0000370 | 0.0000520 |
| 2030 | 0.0000300 | 0.0000430 | 0.0000600 |
Bonk (BONK) Price Prediction 2026
BONK may build on 2025’s breakout momentum if it holds above the $0.0000200–$0.0000225 zone. As the bullish structure matures, a sustained climb toward $0.0000300 is possible, especially if broader crypto sentiment remains favorable. However, short-term corrections toward $0.0000150 may occur as resistance zones from early 2025 are revisited.
Bonk (BONK) Price Prediction 2027
By 2027, BONK could benefit from increased memecoin market penetration and greater ecosystem adoption. If the 2026 rally sustains, the token may attempt a retest of prior highs near $0.0000380. RSI and MACD trends across longer timeframes could continue signaling higher lows and institutional accumulation.
Bonk (BONK) Price Prediction 2028
In 2028, BONK’s price action may reflect broader crypto market cycles. If altcoin bullishness expands, BONK might reach $0.0000450, supported by growing meme culture engagement and possible layer-2 integrations. However, macro-driven pullbacks may briefly push price toward $0.0000240.
Bonk (BONK) Price Prediction 2029
BONK could enter a mature phase of price consolidation between $0.0000300 and $0.0000520 in 2029, with speculative interest rotating between meme and AI-linked tokens. Should bullish channels remain intact on monthly charts, BONK may retest upper ranges near $0.0000500.
Bonk (BONK) Price Prediction 2030
Heading into 2030, BONK may attempt a full-cycle extension toward $0.0000600, supported by increased DeFi and NFT ecosystem integrations. The average may stabilize closer to $0.0000430 if the token maintains its relevance, while $0.0000300 may act as long-term support during pullbacks.
Conclusion
Bonk’s technical setup for 2025 hints at a structural shift as trendline resistance breaks and volume increases. With RSI and MACD turning positive and price reclaiming supertrend support, BONK appears poised for a medium-term recovery. While volatility and meme-sector uncertainty remain, the strengthening base around $0.0000150 offers bulls a compelling launchpad through 2030. Targets above $0.0000250 and later $0.0000380 become realistic if price sustains its breakout structure. Long-term traders may look to accumulate during dips toward $0.0000140–$0.0000160.
Disclaimer: The information presented in this article is for informational and educational purposes only. The article does not constitute financial advice or advice of any kind. Coin Edition is not responsible for any losses incurred as a result of the utilization of content, products, or services mentioned. Readers are advised to exercise caution before taking any action related to the company.


 Price Prediction: Canton Eyes Key Break After Market Activity Spike")

