 Price Prediction 2025-2030: Can BMT Reach New Highs?")
- Bubblemaps (BMT) could see a price range between $0.30 and $1.50 in 2025, depending on market sentiment and adoption.
- A break above $0.272 could trigger a strong rally, potentially pushing BMT toward $1.50 in a bullish scenario.
- If BMT struggles to hold support at $0.2100, the price may consolidate before the next upward move.
Bubblemaps (BMT) is a blockchain data visualization platform that simplifies on-chain analysis. It converts complex blockchain data into interactive visuals called “bubble maps.” Each bubble represents a wallet, with its size indicating the wallet’s token holdings, while connections between bubbles reveal token transfers and interactions. This approach helps identify token distribution patterns, wallet activity, and potential insider behavior in crypto markets.
Table of contents
- Key features
- Recent developments
- Market performance
- Tokenomics
- Partnerships and integrations
- Community feedback
- Bubblemaps (BMT) Price Prediction 2025-2030 Overview
- Bollinger Band Analysis for Bubblemaps (BMT)
- MACD Analysis for Bubblemaps (BMT)
- Relative Strength Index (RSI) Analysis for Bubblemaps (BMT)
- Support and resistance levels for Bubblemaps (BMT)
- Bubblemaps (BMT) 2025 Price Prediction Analysis
- Bubblemaps (BMT) Price Prediction for 2026
- Bubblemaps (BMT) Price Prediction for 2027
- Bubblemaps (BMT) Price Prediction for 2028
- Bubblemaps (BMT) Price Prediction for 2029
- Bubblemaps (BMT) Price Prediction for 2030
- FAQs
Key features
- Investigate wallets – Users can explore individual wallets to understand their holdings and transaction history.
- Reveal connections – The platform highlights relationships between wallets, making it easier to detect clusters or coordinated activities.
- Manage your map – Users can customize their bubble maps for tailored analysis.
- Time travel feature – Allows users to view historical data, showing how token distributions and wallet interactions have evolved.
Recent developments
Bubblemaps has gained traction with recent listings on major crypto exchanges:
- Binance listing – Binance added BMT for trading on March 18, 2025, with pairs like USDT, USDC, BNB, FDUSD, and TRY. The listing was accompanied by a HODLer airdrop program for users who had subscribed their BNB to Simple Earn products.
- Bithumb listing – The South Korean exchange Bithumb also listed BMT, increasing its accessibility to a broader audience.
Market performance
Following these listings, BMT saw a strong price movement:
- Price rally – BMT surged 147% post-Binance listing, reaching an all-time high of $0.321233 on March 18, 2025.
- Market correction – Profit-taking led to a 17% decline as investors capitalized on the surge.
- Current price – As of March 20, 2025, BMT is trading around $0.221168, with a market cap of $58.05 million and a 24-hour trading volume of $594.10 million.
Tokenomics
- Total supply – 1,000,000,000 BMT
- Circulating supply – Around 263,363,878 BMT (26.34% of total supply)
Partnerships and integrations
Bubblemaps has integrated with various platforms:
- NFT marketplaces – Collaborates with NFT platforms to analyze token distributions in collections.
- Blockchain networks – Supports Polygon, Avalanche, Solana, and BNB Chain.
- Analytical tools – Works with platforms like DEXTools and DEX Screener for deeper market insights.
Community feedback
The platform has received strong endorsements:
- Fantom Foundation – Welcomed Bubblemaps as part of its ecosystem for blockchain analysis.
- Kyber Network – Highlighted Bubblemaps as a powerful visualization tool.
- Cronos – Appreciated its role in simplifying blockchain data insights.
Bubblemaps (BMT) Price Prediction 2025-2030 Overview
| Year | Minimum Price | Average Price | Maximum Price |
| 2025 | $0.35 | $0.70 | $1.60 |
| 2026 | $1.60 | $2.10 | $3.60 |
| 2027 | $3.50 | $4.20 | $5.10 |
| 2028 | $5.00 | $6.30 | $7.00 |
| 2029 | $6.80 | $8.00 | $9.30 |
| 2030 | $9.20 | $11.00 | $13.50 |
Bollinger Band Analysis for Bubblemaps (BMT)
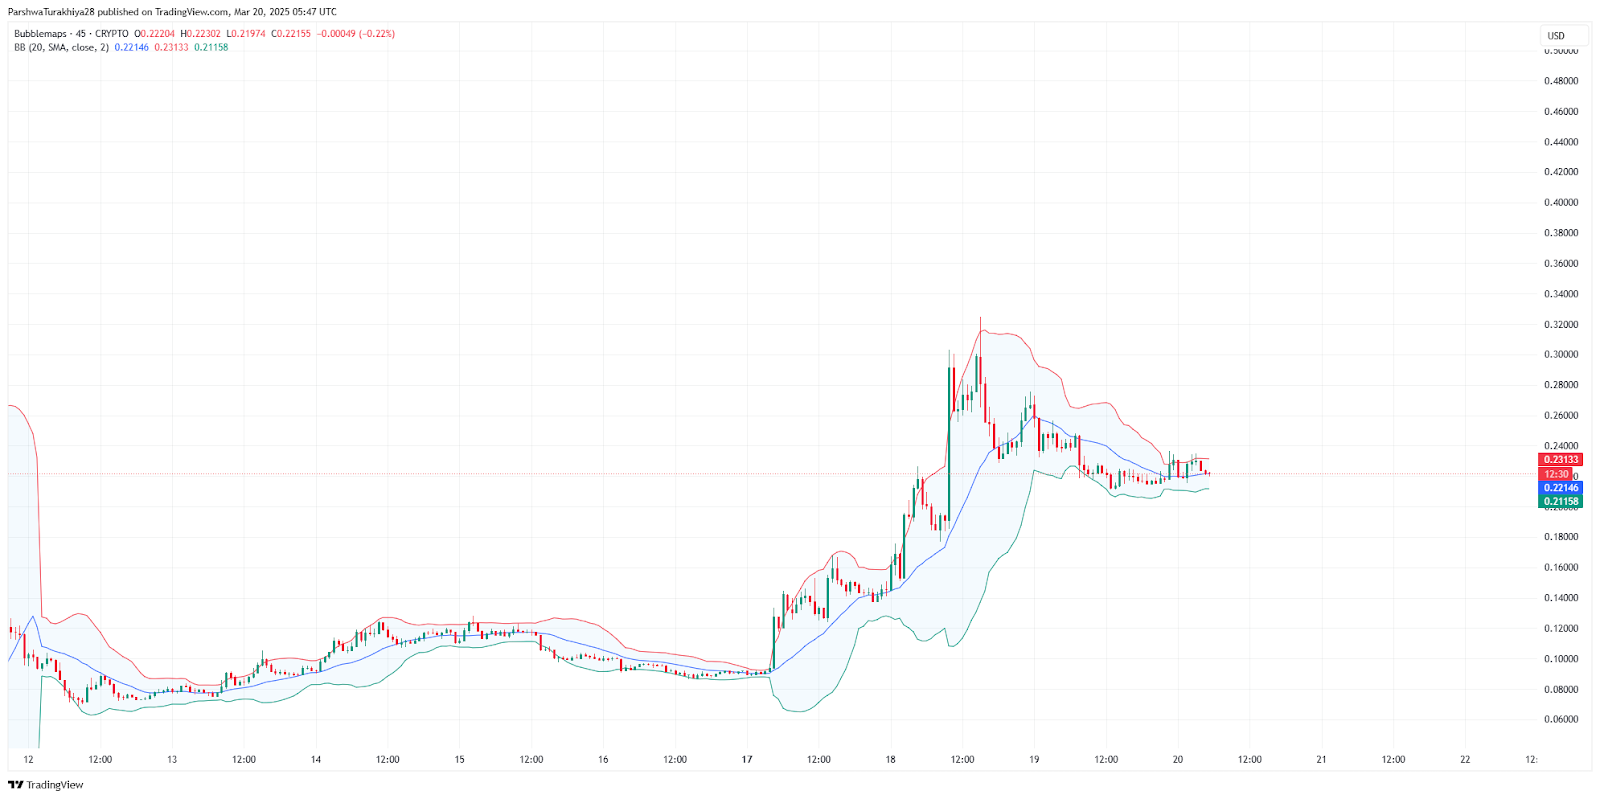
The Bollinger Bands for Bubblemaps (BMT) indicate a contraction in volatility after a period of high price fluctuation. The price is currently consolidating near the middle band, which is a 20-period simple moving average (SMA), suggesting that buying and selling forces are in equilibrium. The lower Bollinger Band at $0.21158 acts as a support level, while the upper band at $0.23133 acts as immediate resistance. A breakout above the upper band could indicate the beginning of an upward trend, with price targets extending toward $0.2500 – $0.2800 if bullish momentum sustains. Conversely, if the price breaks below the lower band, a retest of $0.2000 or lower support zones could occur, signaling bearish sentiment.
Historically, BMT has shown a tendency to bounce from the lower band, making this an important zone for traders to monitor. If the bands start to widen with an upward price move, it would suggest increasing volatility and a potential breakout. On the other hand, a further narrowing of the bands might indicate a period of extended consolidation before a major price movement.
MACD Analysis for Bubblemaps (BMT)
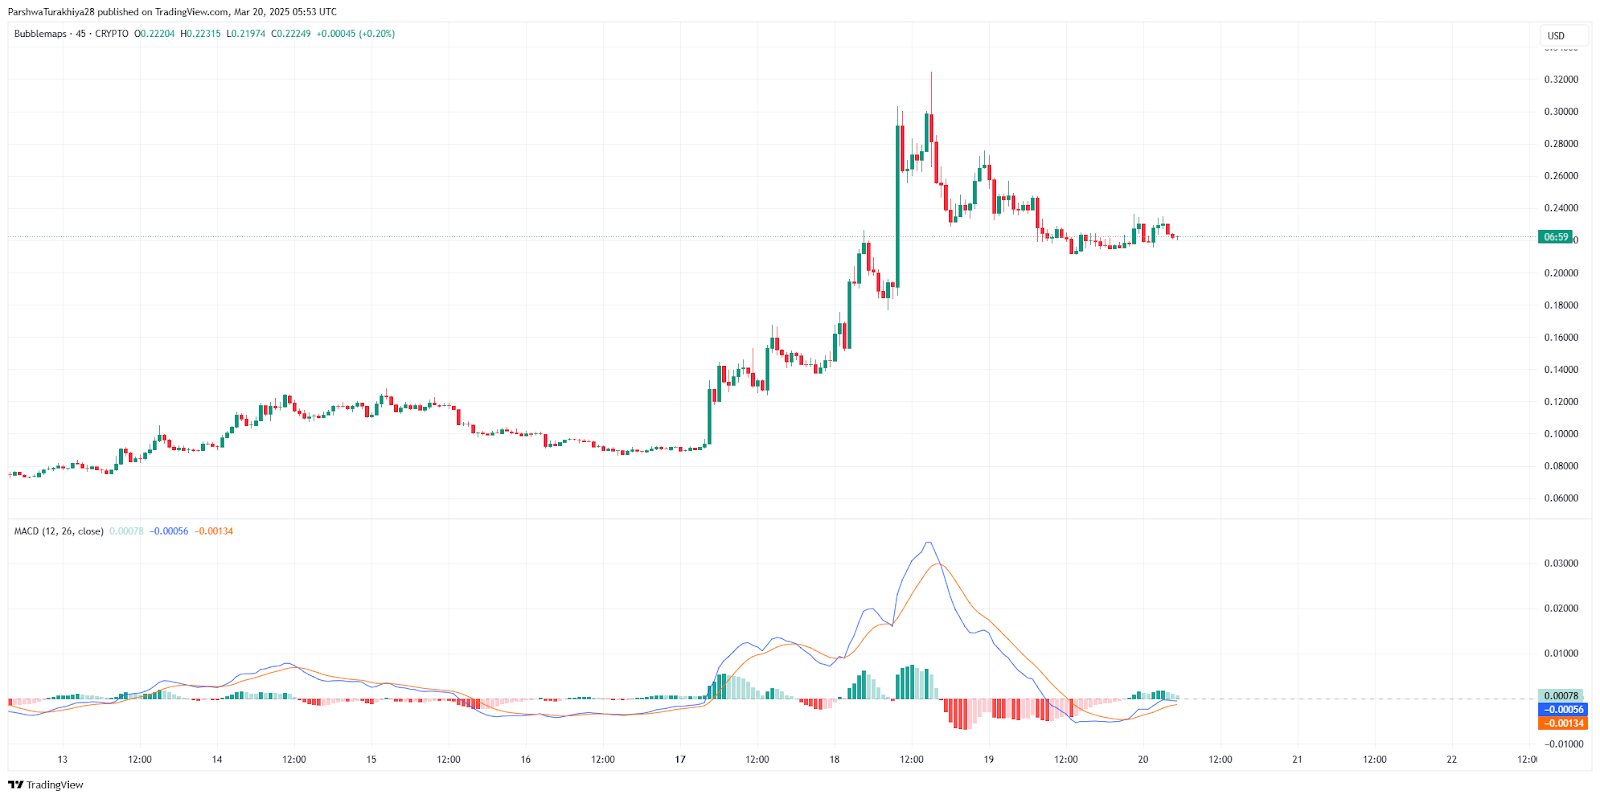
The Moving Average Convergence Divergence (MACD) indicator presents a cautious recovery signal. The MACD line (0.00066) has recently crossed above the signal line (-0.00071), forming a bullish crossover, which is an early indication of potential upside momentum. However, the histogram bars remain relatively small, suggesting that the bullish momentum is still weak and needs confirmation through further price action.
For a sustained bullish trend, the MACD histogram should continue to expand with green bars, confirming increasing buying pressure. If this scenario plays out, BMT could challenge resistance levels at $0.2500 – $0.2800. Conversely, if the MACD line fails to hold above the signal line and turns downward, it may indicate weakening momentum, leading to another test of $0.2100 – $0.2000 support levels.
Historically, BMT has shown strong rallies following MACD crossovers, but traders should watch for increasing volume alongside the crossover to confirm the strength of the move. If the MACD histogram remains near zero without expanding, the price may stay in consolidation before the next decisive move.
Relative Strength Index (RSI) Analysis for Bubblemaps (BMT)
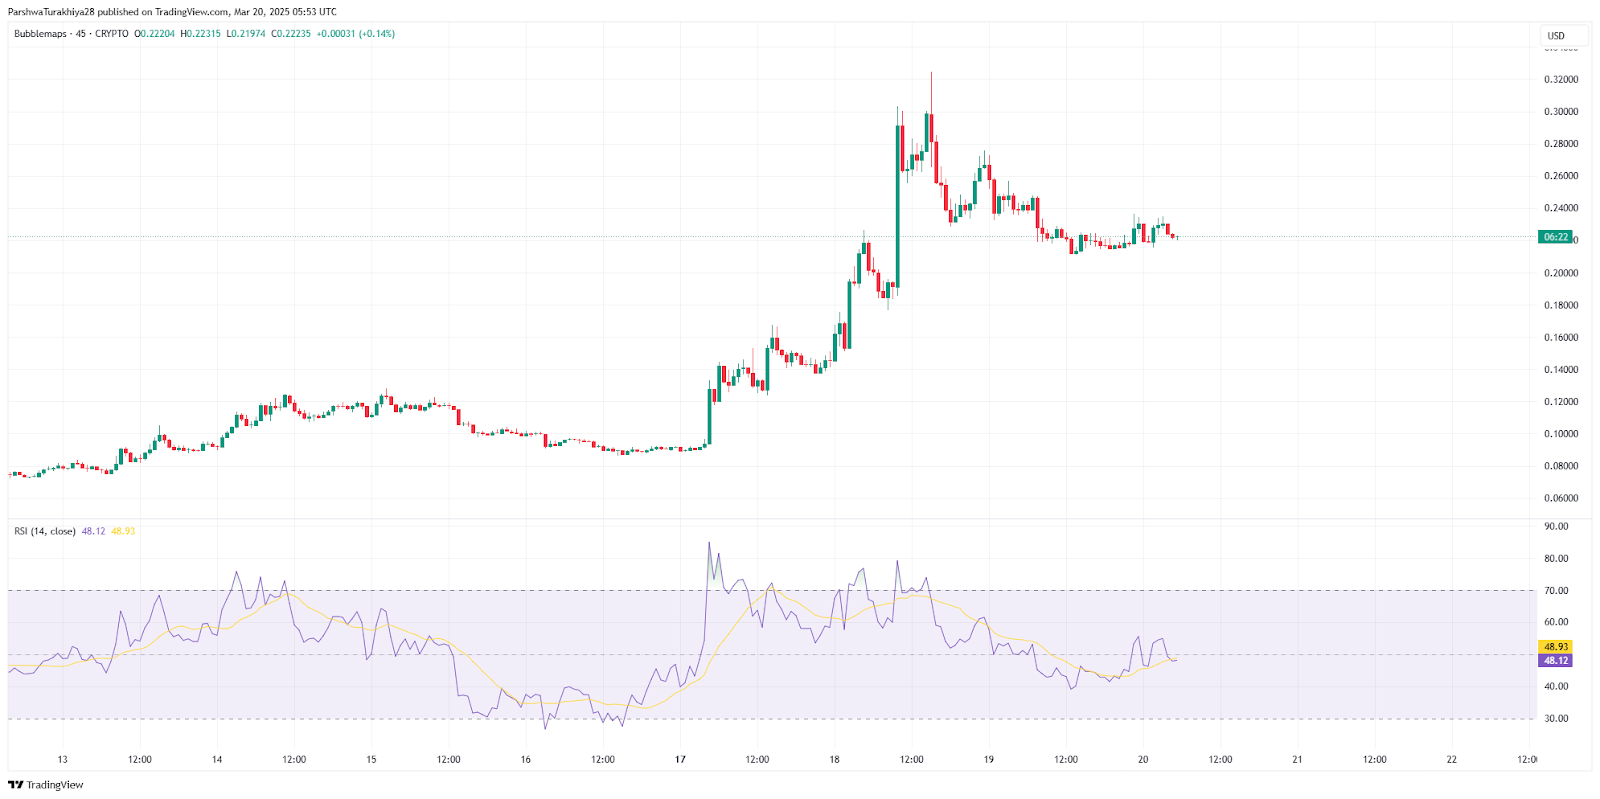
The Relative Strength Index (RSI) for BMT is currently around 47.16, slightly below the neutral 50 mark, suggesting a lack of strong momentum in either direction. The RSI level below 50 but above 40 indicates that selling pressure has slightly outweighed buying interest, but not significantly enough to confirm a bearish trend. If RSI moves above 55-60, it would signal growing bullish momentum and could push the price past the immediate resistance levels.
A key observation is that the RSI previously dipped close to 30, indicating oversold conditions before rebounding sharply. This suggests that if RSI falls below 40, it could trigger another accumulation phase, potentially leading to a reversal. However, if RSI remains in the 45-50 zone, the market could stay in a range-bound phase for some time. A breakout above 65-70 would indicate strong bullish momentum, with potential targets of $0.2800 and beyond.
Support and resistance levels for Bubblemaps (BMT)
The price structure of BMT highlights well-defined support and resistance zones, crucial for traders to identify potential entry and exit points. The strongest support zone currently lies between $0.2000 – $0.2100, where buyers have previously stepped in to prevent further downside. If this level holds, it could serve as a base for another upward push.
The first resistance is observed at $0.23133, aligning with the upper Bollinger Band and a previous supply zone. A breakout above this level would open the path toward $0.2500 – $0.2800, which has historically acted as a major resistance region. A move beyond $0.2800 could lead to a bullish continuation targeting $0.3200 – $0.3500 in an extended rally.
If BMT fails to hold the $0.2100 support level, the next major support lies near $0.1800 – $0.1900, where the price previously found strong buying interest. A breakdown below this level would indicate a prolonged bearish phase, with further downside targets around $0.1500.
Overall, Bubblemaps (BMT) is currently at a critical juncture, consolidating within a tight range. The next major move will likely be dictated by whether the price breaks above resistance at $0.2313 or loses support at $0.2100. Traders should closely monitor volume, MACD trends, and RSI strength to confirm the next breakout direction.
Bubblemaps (BMT) 2025 Price Prediction Analysis
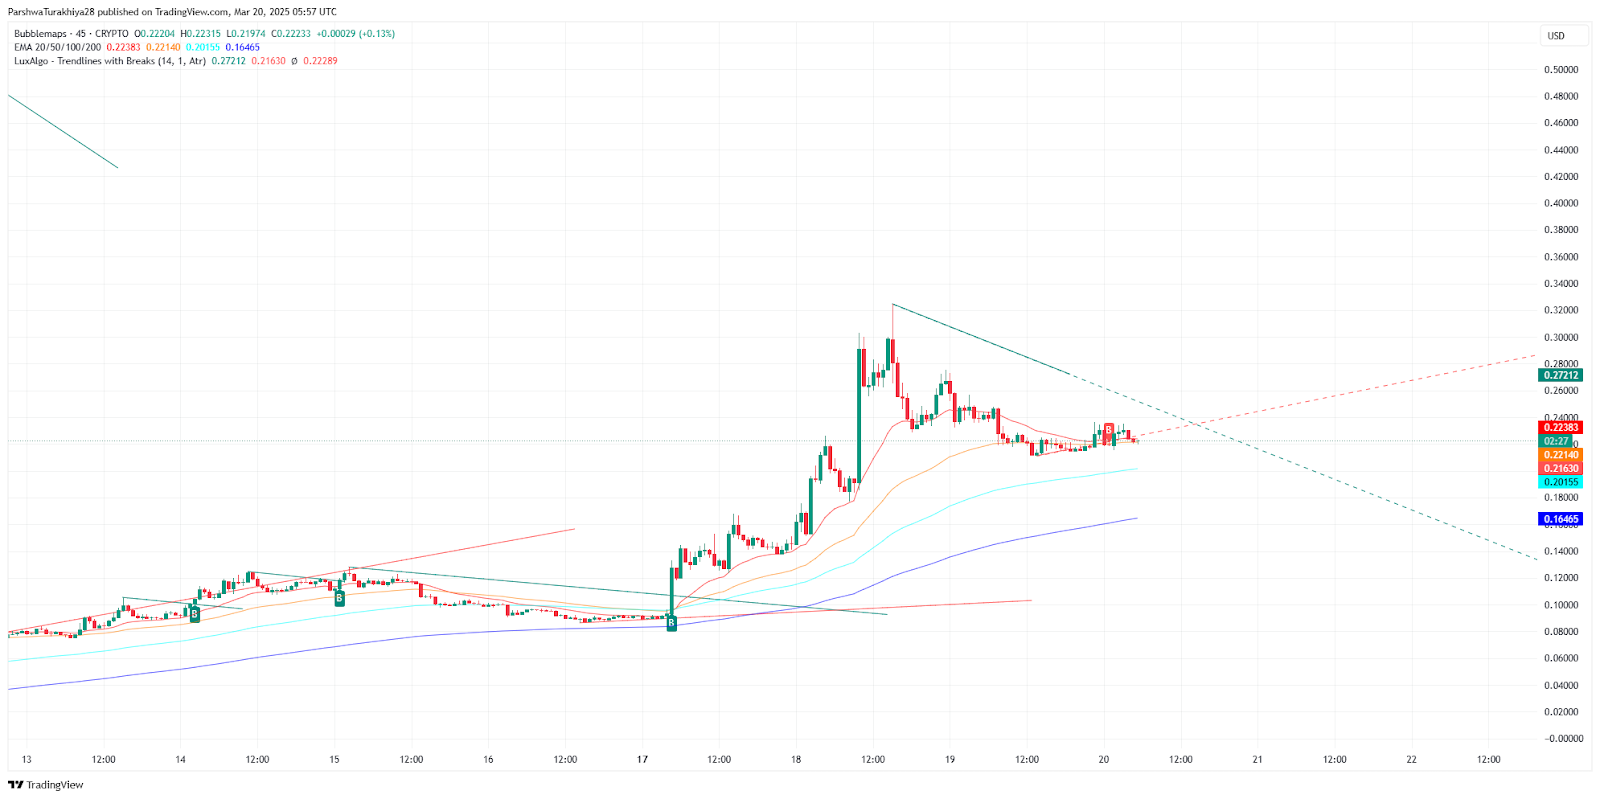
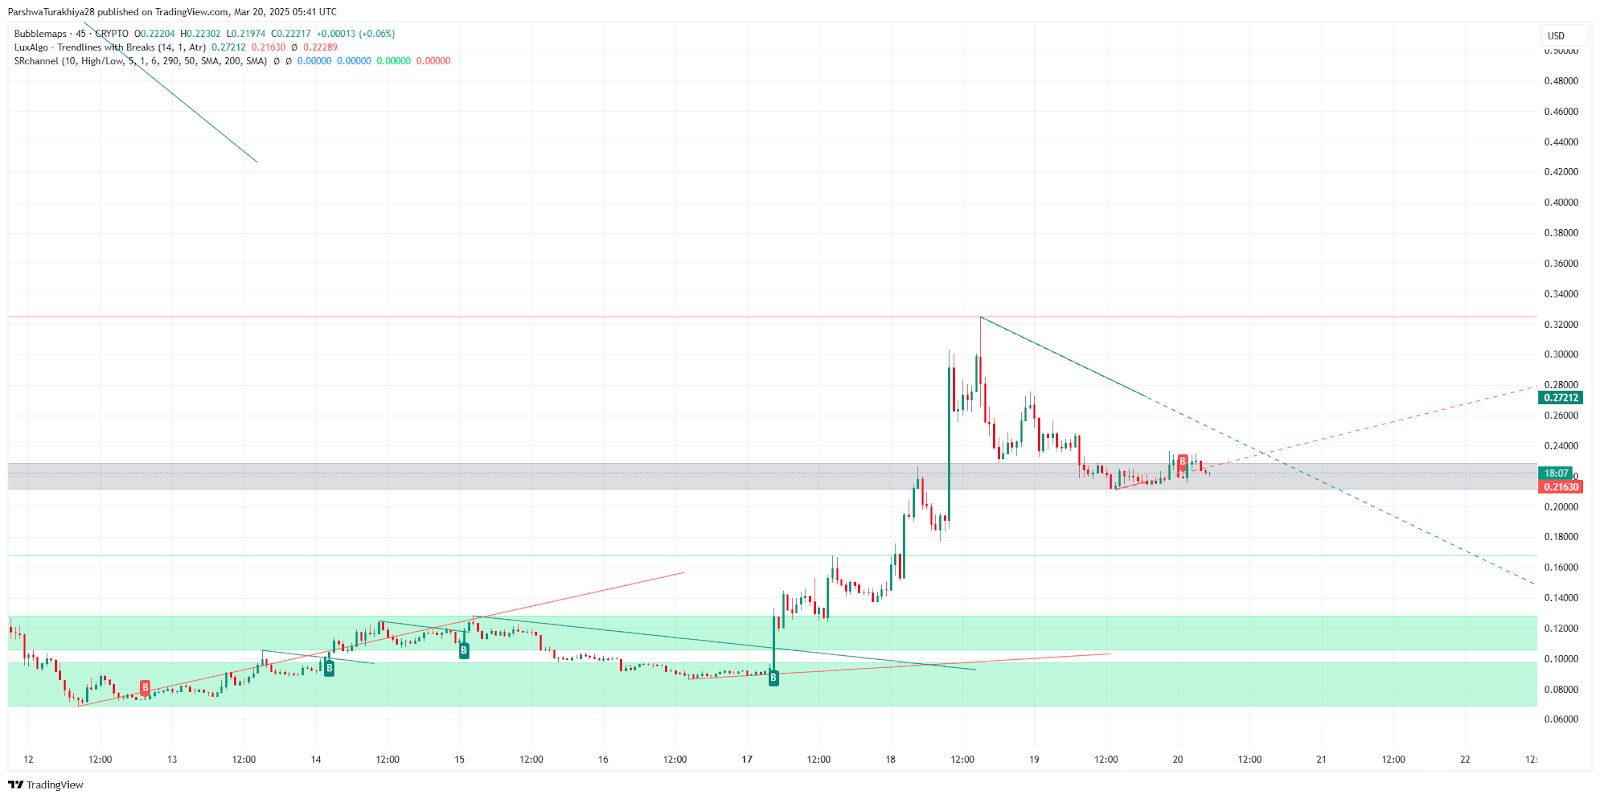
Based on the chart analysis, Bubblemaps (BMT) is currently consolidating near the $0.22-$0.23 range, forming a descending triangle pattern. The resistance level at $0.272 is a key breakout point, while the support level near $0.164 is critical for downside protection.
2025 Price Prediction Based on Chart Analysis
| Year | Minimum Price | Average Price | Maximum Price |
| 2025 | $0.30 | $0.65 | $1.50 |
Analysis:
- Minimum Price: If the price faces rejection from resistance and continues the downtrend, it could test support near $0.16-$0.18 before recovery. However, considering the adoption and volume, $0.30 seems more reasonable as the lowest point for 2025.
- Average Price: A steady uptrend in 2025, driven by exchange listings and market expansion, could stabilize the price around $0.65.
- Maximum Price: If the breakout above $0.272 is strong and bullish sentiment returns, the price may rally towards $1.50, aligning with previous high levels.
The key to further upside will be breaking the descending trendline, which could trigger a bullish rally. If resistance holds strong, expect prolonged consolidation before a breakout.
Bubblemaps (BMT) Price Prediction for 2026
Bubblemaps (BMT) could witness significant growth in 2026 as adoption increases and market sentiment turns more bullish. With an expected minimum of $1.60, the price could stabilize around $2.10, driven by stronger partnerships and exchange liquidity. If broader crypto trends remain positive, BMT might surge towards $3.60, testing new highs as institutional interest grows.
Bubblemaps (BMT) Price Prediction for 2027
By 2027, BMT could establish itself as a key player in blockchain analytics, pushing its valuation higher. The minimum price may hover around $3.50, while growing adoption in DeFi and NFT analytics could push the average price to $4.20. In a strong bull cycle, an extended rally could take BMT toward $5.10, fueled by strategic partnerships and mainstream crypto adoption.
Bubblemaps (BMT) Price Prediction for 2028
If Bubblemaps continues expanding its ecosystem and integrating with top-tier blockchain networks, 2028 could be a breakout year. A strong support level around $5.00 is likely, while steady demand could position the price near $6.30. If market conditions remain highly favorable, BMT may test $7.00, capitalizing on increasing institutional adoption and innovative product developments.
Bubblemaps (BMT) Price Prediction for 2029
BMT’s growing relevance in blockchain forensics and institutional analytics could drive further growth in 2029. The token may find support near $6.80, while increased usage and new exchange listings could push it toward an average price of $8.00. If another major bull run occurs, price action could test highs of $9.30, solidifying BMT as a long-term asset in the crypto space.
Bubblemaps (BMT) Price Prediction for 2030
By 2030, Bubblemaps could evolve into an essential tool for both retail and institutional traders, leading to sustained long-term value. With a projected minimum of $9.20, the token may establish itself around $11.00, backed by strong fundamentals and continued development. If widespread adoption accelerates, BMT might rally towards $13.50, reflecting its growing role in blockchain analytics and transparency tools.
FAQs
BMT is expected to trade between $0.30 and $1.50 in 2025, with the average price around $0.65, depending on adoption and market conditions.
The $0.272 resistance level is critical. A breakout above this could drive BMT toward $0.30-$1.50, depending on market sentiment.
The minimum projected price for BMT in 2025 is around $0.30, assuming support levels near $0.2100 hold.
Yes, in a bullish breakout scenario, BMT could surge to $1.50, particularly if adoption and trading volume increase significantly.
Key factors include exchange listings, adoption by traders, blockchain analytics expansion, and overall market trends in the crypto space.
If BMT loses this support level, it could test $0.1800-$0.2000 before recovering, indicating short-term weakness.
BMT has strong potential due to its role in blockchain analytics, but market risks remain, making it suitable for long-term investors.
An RSI above 55-60 would signal bullish momentum, potentially pushing the price past $0.2800, while an RSI below 40 may indicate further consolidation.
If BMT maintains steady adoption and price appreciation, its market cap could surpass $100 million, depending on volume and demand.
Traders should monitor Bollinger Bands, MACD crossovers, RSI levels, and volume spikes for potential breakout signals.
Disclaimer: The information presented in this article is for informational and educational purposes only. The article does not constitute financial advice or advice of any kind. Coin Edition is not responsible for any losses incurred as a result of the utilization of content, products, or services mentioned. Readers are advised to exercise caution before taking any action related to the company.


