
The Pi Network price is struggling to maintain key support levels, with market indicators suggesting persistent downside momentum. As of June 18, the Pi Network price today is trading near $0.54, down over 2.5% in the last 24 hours. This prolonged bearish trend raises questions about the possibility of Pi reclaiming higher valuation targets such as $1 or even reaching $10 in the foreseeable future.
Smart Money Zones And Liquidity Gaps Weigh On Price
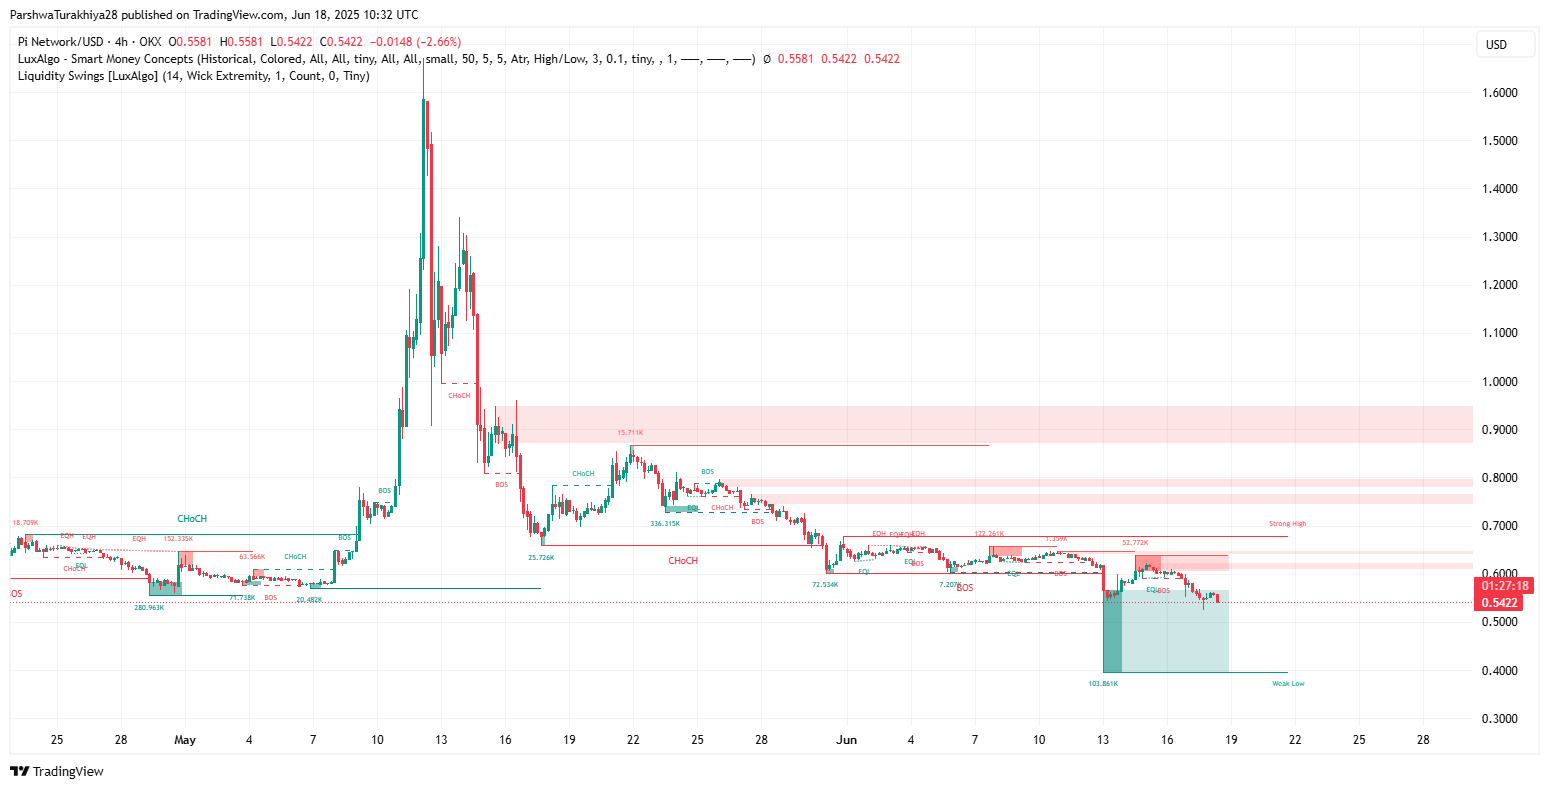
The liquidity swing chart shows clear breakdowns below previous BOS and CHoCH levels, especially near $0.60 and $0.70. A large bearish order block sits between $0.70 and $0.85, where sell-side liquidity remains dominant. In the recent sessions, the price was rejected from a minor FVG zone around $0.58 and has been drifting downward ever since. The price currently trades inside a bearish imbalance area, with a “Weak Low” marked at the $0.52–$0.50 range, increasing the chances of further downside sweeps.
Without a bullish CHoCH or BOS reclaim above $0.61, the Pi Network price action is expected to remain under pressure.
Pi Price Analysis: Moving Averages And Bollinger Bands Point To A Squeeze
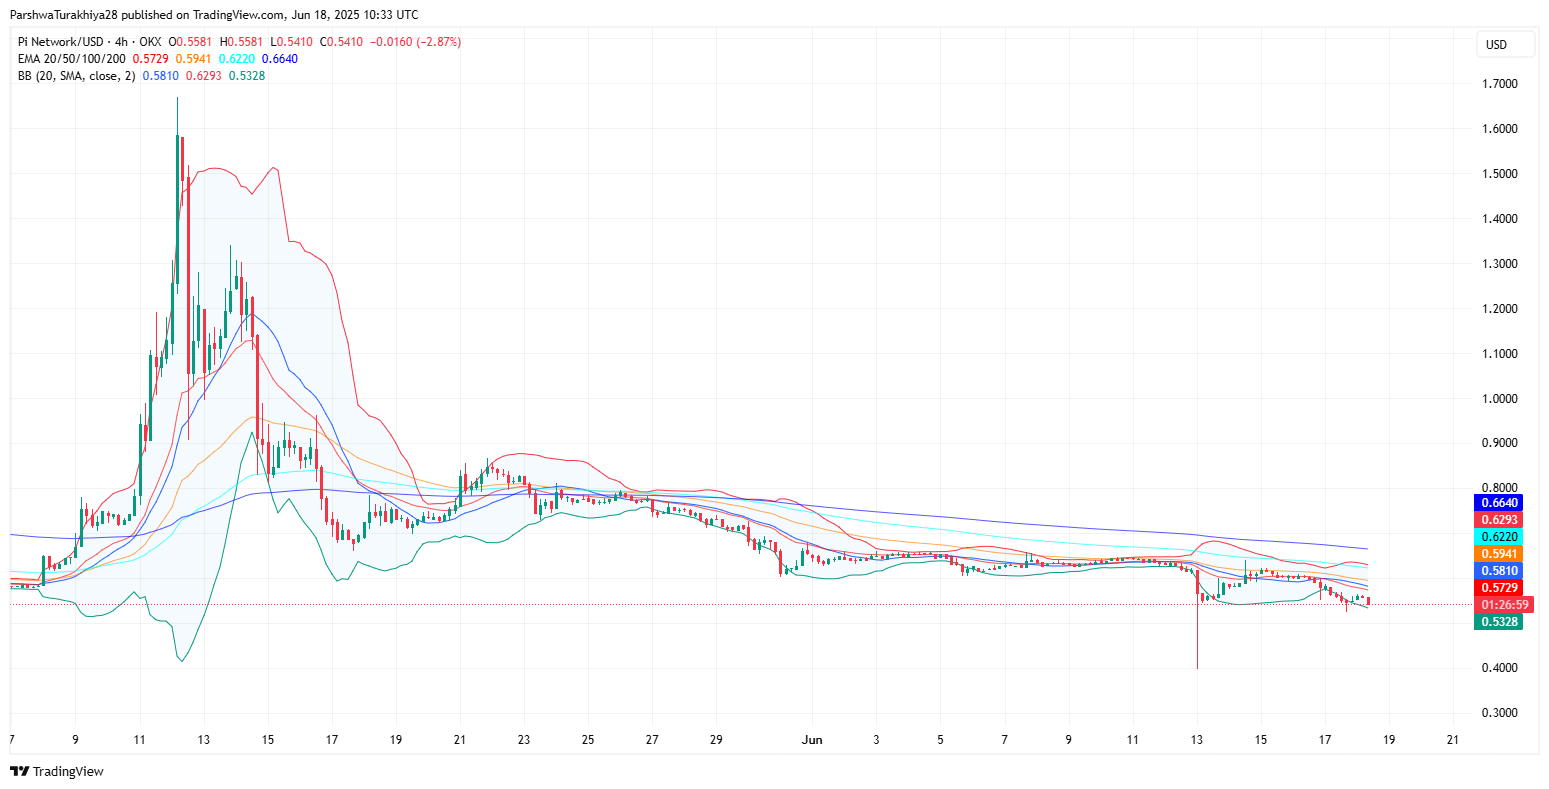
On the 4-hour chart, all four exponential moving averages (20/50/100/200 EMA) are aligned bearishly. The Pi Network price is trading below the 20-EMA ($0.5729), 50-EMA ($0.5941), 100-EMA ($0.6220), and 200-EMA ($0.6640). This cluster acts as a strong resistance band between $0.57 and $0.66. Until Pi breaks above this confluence, recovery will likely remain capped.
Bollinger Bands have also started narrowing, with the upper band at $0.5810 and the lower band at $0.5328, suggesting that Pi Network price volatility could expand soon. However, without a significant volume breakout, the pressure favors continuation to the downside.
Pi Price Analysis: Trendlines, Structure, And MACD Support Bearish Outlook
The daily structure shows a decisive breakdown from the symmetrical triangle pattern earlier formed in May. The trendline resistance sits steeply near $0.93, while daily support is being tested around $0.52. With no strong bullish engulfing candle present, the price continues to grind lower toward its April low near $0.3969.
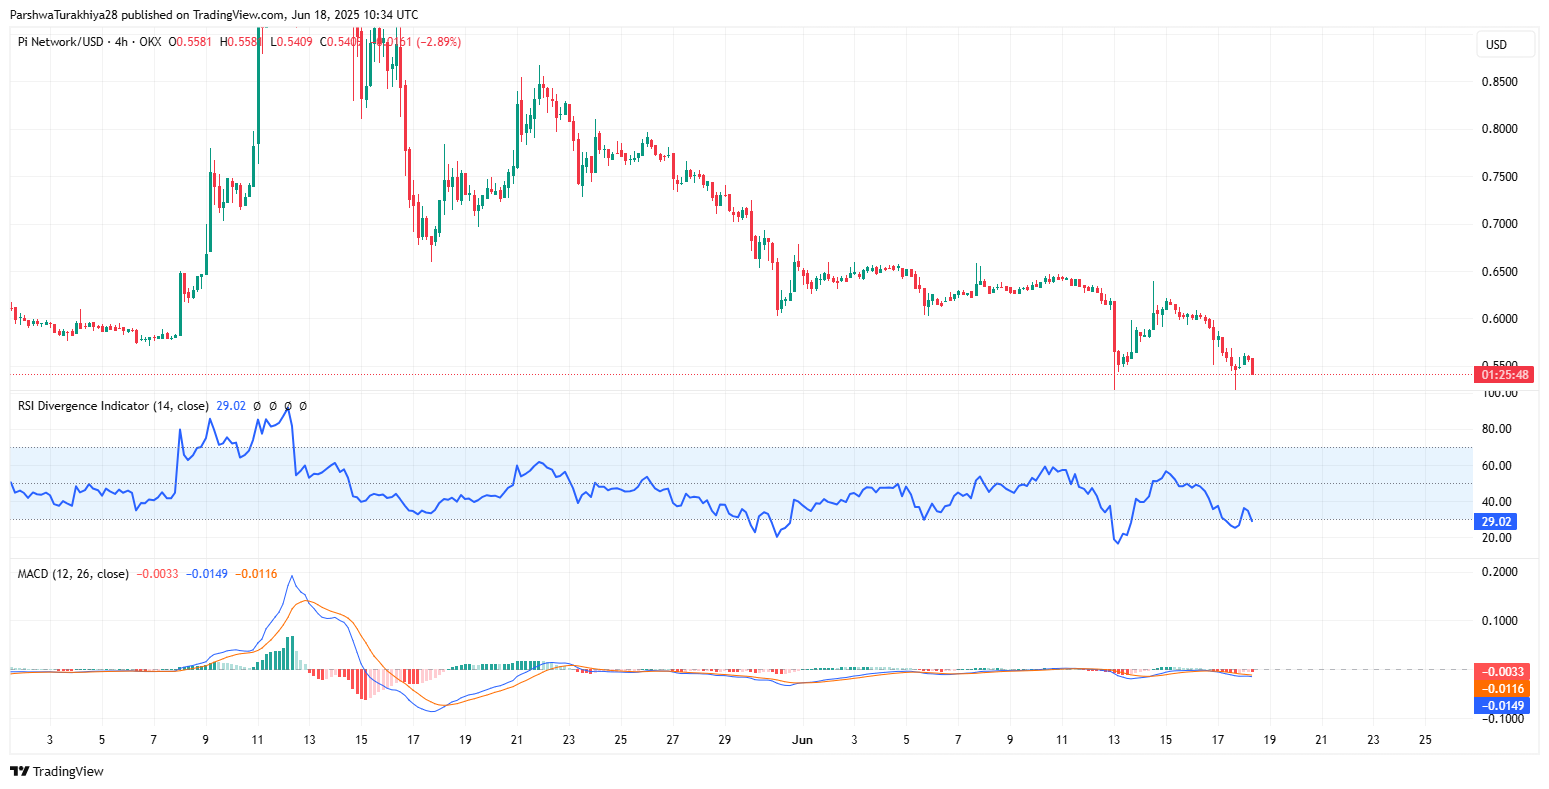
The MACD histogram on the 4-hour chart has remained negative for several sessions, and the signal line crossover below the baseline confirms bearish control. Similarly, the RSI is stuck around 29.02, staying oversold but without showing any confirmed divergence. This keeps the Pi Network price update anchored in weakness for now.
Pi Price: Volume Profile And VWAP Levels Signal Declining Interest
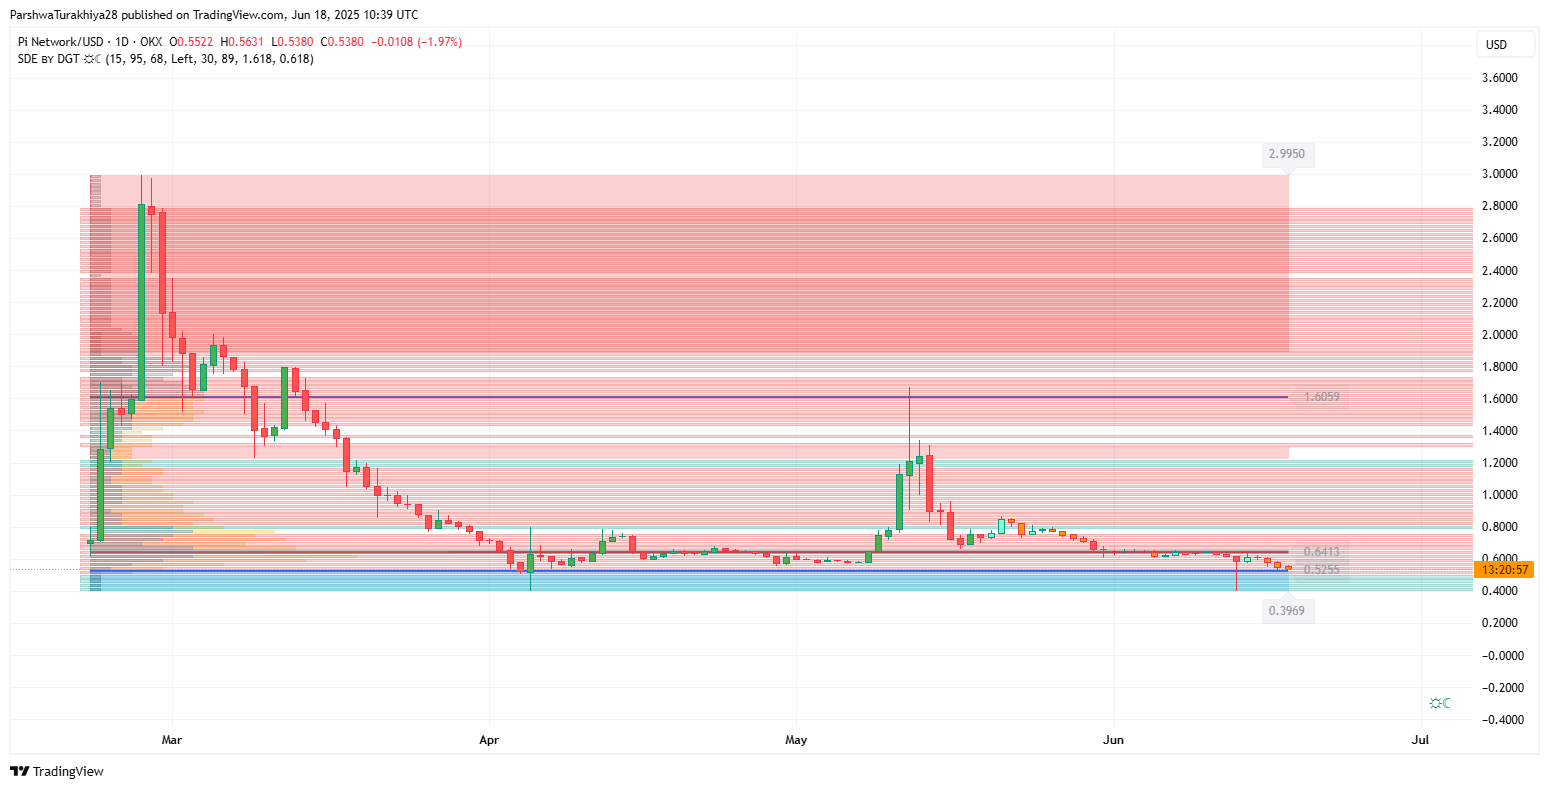
The long-term volume profile shows a heavy distribution between $0.80 and $1.60, where the bulk of trading activity occurred during previous spikes.
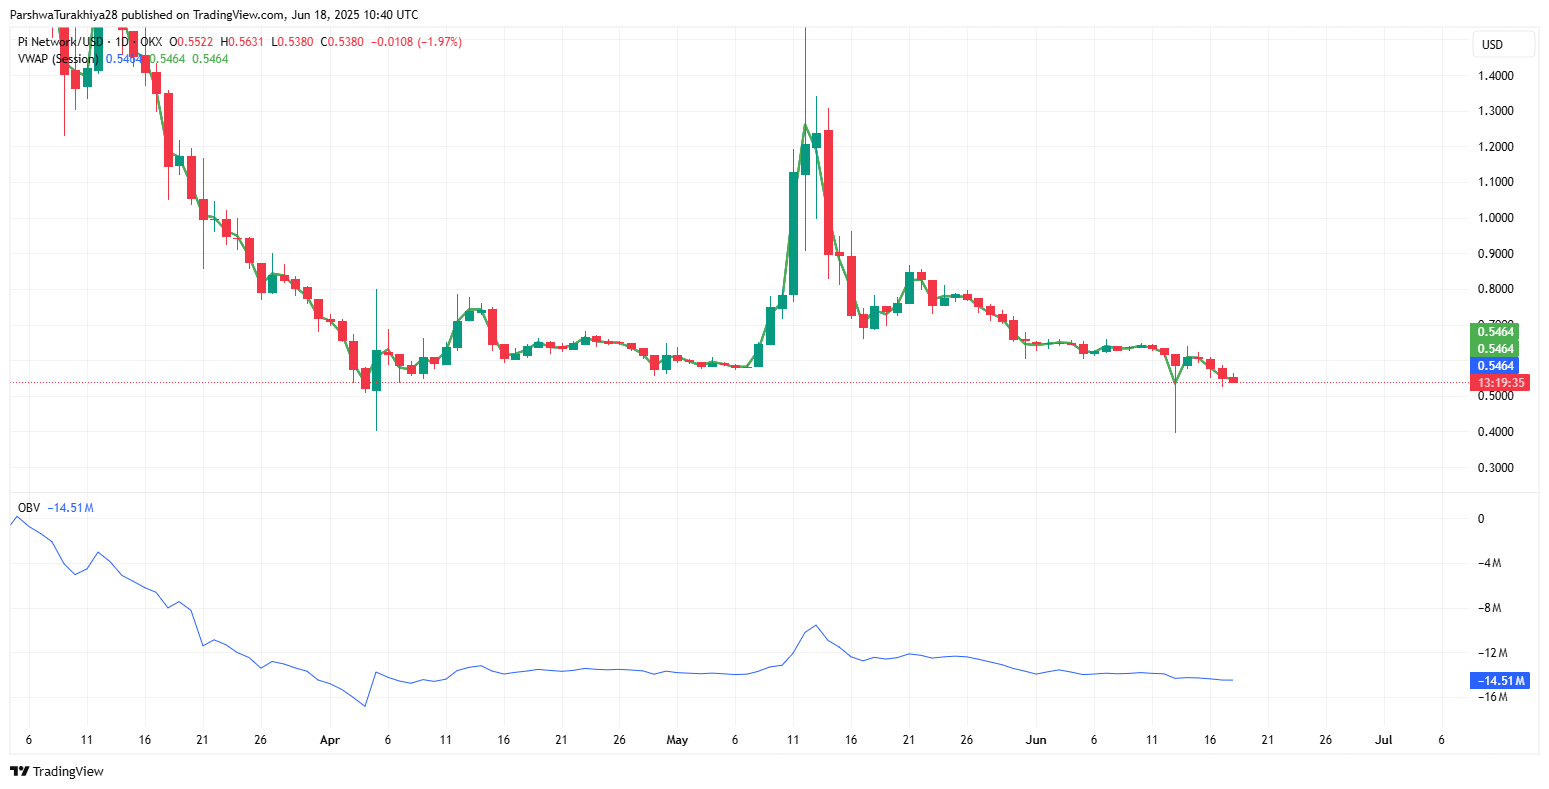
However, recent candles indicate a steady decline in OBV (On-Balance Volume), now at -14.51 million. The VWAP line has flattened near $0.5464, close to current market price, suggesting a short-term mean reversion zone rather than a breakout.
Until significant accumulation is visible around current lows, why Pi Network price going down today remains answered by declining demand and lack of bullish conviction.
Can Pi Price Realistically Reach $10?
While the long-term vision for Pi Network might include scaling toward higher valuations, a rise to $10 would require a sustained 18x rally from current levels. This is only achievable under conditions such as:
- Broad crypto market bullish cycle,
- Major exchange listings and increased utility,
- Supply restriction or tokenomics changes,
- Sustained demand from Pi’s global user base.
However, from a chart perspective, a reclaim of the $1.00 mark is the first psychological hurdle. Only a strong breakout above $1.47 (daily trendline resistance) would initiate a possible structure for a new uptrend channel. Without that, the prospect of Pi Network price spikes toward $10 remains a distant speculative goal rather than a near-future probability.
PI Price Short-Term Forecast And Key Levels
| Level Type | Price Level |
| Immediate Resistance | $0.58 – $0.60 |
| EMA Cluster Resistance | $0.57 – $0.66 |
| Key Support Zone | $0.52 – $0.50 |
| Breakdown Risk Area | $0.47 – $0.40 |
| Bullish Breakout Zone | Above $0.70 |
| Weekly Target (If Bullish) | $0.78 – $0.93 |
In conclusion, the Pi Network price today remains under intense pressure, failing to hold above key moving averages or structure zones. While a recovery is possible from oversold levels, the broader outlook suggests that Pi Network price must clear multiple resistance zones before any talk of $10 becomes relevant. Until then, traders should remain cautious, with focus on reclaiming $0.70 and $1.00 first.
Disclaimer: The information presented in this article is for informational and educational purposes only. The article does not constitute financial advice or advice of any kind. Coin Edition is not responsible for any losses incurred as a result of the utilization of content, products, or services mentioned. Readers are advised to exercise caution before taking any action related to the company.


